
A Comparative Pattern for Populus spp. and Betula spp. Stand Biomass in Eurasian Climate Gradients
doi: 10.5552/crojfe.2022.1340
volume: 43, issue:
pp: 14
- Author(s):
- Shobairi Seyed Omid Reza
- Lin Hui
- Usoltsev Vladimir Andreevich
- Osmirko Anna Andreevna
- Tsepordey Ivan Stepanovich
- Ye Zilin
- Anees Shoaib Ahmad
- Article category:
- Original scientific paper
- Keywords:
- regression models, forest biomass structure, space-for-time substitution, average January temperature, average annual precipitation
Abstract
HTML
Based on the generated database of 413 and 490 plots of biomass of Populus spp. and Betula spp. in Eurasia, statistically significant changes in the structure of forest stand biomass were found with shifts in January temperatures and average annual precipitation. When analyzing harvest data, the propeller-shaped biomass patterns in the gradients of average annual precipitation and average January temperatures are obtained, which are common for both deciduous species. Correspondingly, Populus and Betula forests show a regularity common to the biomass components: in the cold zones the precipitation increase leads to the increase of biomass, and in the warm ones to their decrease. In wet areas, the increase of temperature causes the decrease of biomass, and in dry areas, it causes their increase. In accordance with the law of the limiting factor by Liebig-Shelford, it is shown that both an decrease in temperature in dry conditions and a increase in precipitation in a warm climate lead to a decrease in the biomass of trees.
A Comparative Pattern for Populus spp. and Betula spp. Stand Biomass in Eurasian Climate Gradients
Seyed Omid Reza Shobairi, Hui Lin, Vladimir Andreevich Usoltsev, Anna Andreevna Osmirko, Ivan Stepanovich Tsepordey, Zilin Ye, Shoaib Ahmad Anees
Abstract
Based on the generated database of 413 and 490 plots of biomass of Populus spp. and Betula spp. in Eurasia, statistically significant changes in the structure of forest stand biomass were found with shifts in January temperatures and average annual precipitation. When analyzing harvest data, the propeller-shaped biomass patterns in the gradients of average annual precipitation and average January temperatures are obtained, which are common for both deciduous species. Correspondingly, Populus and Betula forests show a regularity common to the biomass components: in the cold zones the precipitation increase leads to the increase of biomass, and in the warm ones to their decrease. In wet areas, the increase of temperature causes the decrease of biomass, and in dry areas, it causes their increase. In accordance with the law of the limiting factor by Liebig-Shelford, it is shown that both an decrease in temperature in dry conditions and a increase in precipitation in a warm climate lead to a decrease in the biomass of trees.
Keywords: regression models, forest biomass structure, space-for-time substitution, average January temperature, average annual precipitation
1. Introduction
Most of the environmental problems facing human society today can be solved on a global scale only, and the priorities of environmental research are shifting to the macro-scale level. Unfortunately, the climate system of our planet has lost its stationarity, climate disasters are becoming more frequent and strong, and climate scenarios are becoming unpredictable. It remains to use the principle: »What will happen if...?«, describing possible scenarios of changes in the stand biomass, using spatial gradients of climatic variables. The climatically determined spatial gradients of the productivity of trees and stands can be applied to prognosticate its temporal shifts using the theory of space-for-time substitution (SfTS). It means using current patterns and phenomena observed in spatial gradients to understand and model the same patterns in prospective time gradients that are currently unobservable. Methods based on SfTS are used in different fields (Gaüzère et al. 2020). In particular, ecological time series are used to study the long-term nutrient cycle and plant succession (Johnson and Miyanishi 2008). SfTS is used in biodiversity forecasting, and there are encouraging results in this regard (Pickett 1989, Blois et al. 2013).
Allometric models of tree biomass are suggested commonly for estimating stand biomass. A study of the biases of generic models of tree biomass showed that their use in local geographical conditions leads to biases: in Pinus sp. from –92 to +94% (Usoltsev et al. 2017b), in Abies spp. from –68 to +315% (Usoltsev et al. 2017b), in Picea spp. from –86 to +311% (Usoltsev et al. 2017c), and in Larix spp. from –52 to +95% (Usoltsev et al. 2017a). It has been suggested that these fluctuations are due to regional climatic conditions. The inclusion of values of territorial temperature and precipitation, as additional independent variables in allometric models of tree biomass, improved the accuracy of estimates (Zeng et al. 2017, Fu et al. 2017). In mentioned studies, the territorial differences in climate are extrapolated to the predicted climate shifts over time in accordance with the principle of SfTS (Zeng et al. 2017, Fu et al. 2017).
Due to current climate changes, priority is given to changing the biomass and NPP of forest ecosystems under the influence of average temperatures and precipitation (Lieth 1974). Similar studies are performed at both a regional (Forrester et al. 2017, Fu et al. 2017, Zeng et al. 2017) and transcontinental (Usoltsev et al. 2018a, Usoltsev et al. 2019a, Usoltsev et al. 2019b, Usoltsev et al. 2019c) level. Studies of forest stand biomass at the transcontinental level, performed for four coniferous species of Eurasia, showed that changes in their biomass due to temperatures and precipitation are species-specific, i.e. they differ between species both in the total and aboveground biomass, and in the component composition.
It seems relevant to investigate similar patterns for hardwoods. This article is devoted to the study of transcontinental climate-related trends in the structure of forest biomass formed by fast-growing species of the genus Populus spp. in comparison with the genus Betula spp.
The genus Populus plays a disproportionately important role in promoting biodiversity and sequestering carbon. In Eurasia, it is presented with P. tremula L., P. alba Ledeb., P. nigra L., P. laurifolia Ledeb., P. pruinosa Schrenk, P. davidiana Dode, etc. It is illustrative of efforts to move beyond single-species conservation worldwide. The genus Populus is valued for many reasons, but one highlights their potential as key contributors to regional and global biodiversity (Rogers et al. 2020). The genus Betula spp. is included in Betulaceae family. This family has 120–150 species (Grimm and Renner 2013). The majority of species are present in northern zones and have a wide natural distribution area on the Eurasian continent, ranging from the Atlantic to eastern Siberia. Birch is among ten common species in Russia. There are several species in the common birch category from the section Albae Rgl.: silver birch (B. pendula Roth.), downy birch (B. pubescens Ehrh.), mountain birch (B. tortuosa Ldb.), Japanese white birch or Siberian silver birch (Hynynen et al. 2009).
The aim of this study is as follows:
Þ when using the examples of Populus spp. and Betula spp. stand biomass, to identify how their stand biomass structure is related to the values of territorial temperatures and precipitation at the transcontinental level
Þ when using the theory of SfTS, to apply the obtained patterns to predict changes in biomass due to climate shifts in Eurasia.
2. Objects of Research
This article uses the following abbreviations:
A stand age, years
D stem diameter at breast height
H tree biomass
V stem volume, m3 per ha
N tree density, 1000/ha
Tm mean January temperature, °C
PRm mean annual precipitation, mm
Pi biomass of i-th component, t per ha; involving:
Pa aboveground
Pf foliage
Pb branches
Ps stem over bark
Pr roots
Pt total.
To analyze geographical patterns of biomass distribution in Eurasian forests formed by stands of the genera Populus spp. and Betula spp., from the author's database in the amount of 8 thousand sample plots (Usoltsev 2020), the materials of 413 and 490 biomass estimates of Populus spp. and Betula spp., respectively, are involved (Tables 1 and 2). These biomass data are presented in different components (stems, branches, foliage, and roots). The distributions of sample plots with biomass data of these genera on the map-schemes of Eurasia are shown in Fig. 1. Statistics of database samples is shown in Table 3.
Table 1 Distribution of plots with Populus biomass estimates (t/ha) by species and countries
Species of Populus | Country | Plot quantity |
Populus tremula L. | Russia, Ukraine Kazakhstan Estonia, Belarus | 188 |
P. davidiana Dode | China, Japan | 129 |
P. trichocarpa Torr. & A.Gray ex Hook. | France, Austria Belgium Netherlands | 37 |
P. laurifolia Ledeb. | Russia | 12 |
P. alba Ledeb. | Russia Kazakhstan | 10 |
Populus × euroamericana | Ukraine | 10 |
P. euphratica Olivier | China | 9 |
Populus hybrid | Japan | 8 |
P. deltoides W.Bartram ex Humphry Marshall | China | 6 |
P. nigra L. | Russia | 2 |
Populus × bachelieri Solemacher | Bulgaria | 1 |
P. pruinose Schrenk | Tajikistan | 1 |
Total | 413 | |
Table 2 Distribution of plots with Betula spp. biomass estimates (t/ha) by species and countries
Species of Betula | Country | Number of sampling sites |
Betula pendula Roth. B. pubescens Ehrh. | Russia, Ukraine, Kazakhstan Great Britain, Belarus, Azerbaijan Finland, Japan, Sweden Mongolia, Lithuania, Belgium Norway, France, Denmark (Greenland) | 340 |
B. utilis D.Don | China | 127 |
B. tortuosa Ldb. | Russia | 9 |
B. platyphylla Suk. | China, Russia, Japan | 6 |
B. ermanii Cham. | China, Japan | 4 |
B. maximowicziana Rgl. | Japan | 4 |
Total | 490 | |

Fig. 1 Allocation of sample plots with biomass (t/ha) estimates in a number of 413 of Populus (a) and 490 of Betula (b) forest stands on the territory of Eurasia
Table 3 Statistics of database samples for the genera Populus spp. and Betula spp.in Eurasia
Statistic designation* | Indices analyzed | ||||||||||
A | N/1000 | D | H | V | Pf | Pb | Ps | Pa | Pr | Pr/Pa | |
Populus L. | |||||||||||
Mean | 38 | 5.1 | 13.9 | 14.8 | 176.3 | 3.6 | 14.4 | 78.4 | 98.0 | 30.4 | 0.33 |
Min | 2 | 0.1 | 0.3 | 1.0 | 1.5 | 0.15 | 0.31 | 0.37 | 0.83 | 1.0 | 0.12 |
Max | 222 | 150 | 38.3 | 31.0 | 772.0 | 10.7 | 50.6 | 331.4 | 377.6 | 116.0 | 0.7 |
SD | 24.3 | 14.8 | 9.0 | 7.1 | 123.2 | 1.9 | 9.7 | 54.2 | 62.3 | 16.6 | 0.09 |
CV, % | 64.7 | 291.7 | 64.9 | 47.9 | 69.9 | 53.0 | 67.5 | 69.2 | 63.6 | 54.6 | 29.2 |
n | 413 | 413 | 413 | 413 | 413 | 413 | 413 | 413 | 413 | 196 | 194 |
Betula L. | |||||||||||
Mean | 44 | 16.1 | 13.5 | 14.8 | 167.8 | 3.3 | 12.9 | 86.9 | 104.2 | 26.6 | 0.27 |
Min | 2 | 0.08 | 0.5 | 0.4 | 0.34 | 0.02 | 0.08 | 0.17 | 0.27 | 0.38 | 0.06 |
Max | 240 | 2163 | 48.2 | 30.3 | 500.0 | 14.8 | 51.2 | 239.0 | 280.2 | 87.1 | 1.4 |
SD | 27.8 | 113.7 | 7.8 | 6.8 | 103.6 | 1.8 | 8.7 | 54.3 | 61.5 | 13.6 | 0.14 |
CV, % | 63.7 | 705.7 | 57.8 | 45.8 | 61.7 | 54.9 | 67.8 | 62.5 | 59.0 | 51.0 | 51.8 |
n | 490 | 490 | 490 | 490 | 490 | 490 | 490 | 490 | 490 | 188 | 184 |
* Min = minimum, Max = maximum, SD = standard deviation, CV = coefficient of variation | |||||||||||
3. Methods
The use of evapotranspiration as a combined index in the assessment of tree production is futile, since it explains only 24% of its variance compared to 42%, which provides the relation to mean annual precipitation, and compared to 31%, which provides the relation to mean annual temperature (Ni et al. 2001). Therefore, the use of temperature and precipitation indices taken from World Weather Maps (2007) is preferable as the most informative climatic factors. We superimposed the input data of the biomass based on the known coordinates of the sample plots established, on the maps of January temperatures and average annual precipitation distribution (World Weather Maps 2007) and related them with the isolines of the mentioned indices on the maps.
Against the background of long-term climatic shifts for decades, the prevailing influence is acquired by winter temperatures (Toromani and Bojaxhi 2010, Bijak 2010, Morley et al. 2017), having in mind that winter temperatures in the Northern hemisphere increased faster than summer ones during the 20th century (Emanuel et al. 1985, Folland et al. 2001, Laing and Binyamin 2013, Felton et al. 2016). This phenomenon may be associated with the shift of the earth's magnetic pole towards Siberia (Olsen and Mandea 2007).
Therefore, our preference is for using the mean January (as the coldest month) temperature as one of the climatic variables. Morley et al. (2017) have summarized as follows: »We found that winter temperatures were particularly useful for explaining inter-annual variation in species distribution and biomass, although the direction and magnitude of the response varied among species from strongly negative, to little response, to strongly positive. Across species, the response to winter temperature varied greatly, with much of this variation being explained by thermal preference« (P. 2590). In terms of regression analysis, a weak temporal trend of summer temperatures compared to a steep trend of winter ones means a smaller regression slope and a worse ratio of residual variance to the total variance explained by this regression. Therefore, our study used the winter temperature.
We included in the regression equations not only climate variables, but also mass-forming stand parameters as independent variables. The initial structure of the model included the main stand parameters – age, stem volume, tree density, mean diameter and mean height. Mean diameter as correlated with tree density and mean height as correlated with age, were excluded in the process of the regression analysis as not statistically significant. The cross-products (synergism) (lnA)·(lnN) were introduced in the model to account for the decrease in the tree density with age and their effect on the stand biomass.
In contrast to the previously published model of Populus biomass in temperature and precipitation gradients (Usoltsev et al. 2020), in this study, we have included an additional climate variable in the biomass models that takes into account the combined effect of temperature and precipitation, in the form of cross-products [ln(Tm+50)]·(lnPRm). The distribution of temperatures and precipitation on the territory of Eurasia does not occur according to geographical coordinates, but is characterized by a large variability in the ratio of climatic variables in different regions (Lapenis et al. 2005, Usoltsev 2014). Accordingly, the stand biomass in critical situations will be minimized both by the shortage or excess in temperatures, as well as both by the shortage or excess of precipitation, in full compliance with the law of the limiting factor by Liebig-Shelford (Odum 1971). The minimum and maximum values of biomass will be determined, all other things being equal, by the corresponding limiting and optimal combinations of climatic variables. Such a pattern is described by a propeller-shaped surface, the analytical description of which includes not only temperature and precipitation, but also synergism [ln(Tm+50)]·(lnPRm) (Usoltsev et al. 2018a, Usoltsev et al. 2019a, Usoltsev et al. 2019b, Usoltsev et al. 2019c).
The technique of multiple regression analysis (http://www.statgraphics.com/for more information) according to three blocks of recursive equations is used: two blocks of mass-forming indices N and V and single block of biomass Pi (arrows show the sequence of calculations)
→lnN = f {lnA, ln(Tm+50), lnPRm, [ln(Tm+50)]·(lnPRm)} →
→lnV = f [lnA, lnN, (lnA) (lnN), ln(Tm+50), lnPRm, [ln(Tm+50)] (lnPRm)} →
→lnPi = f {lnA, lnV, lnN, (lnA) (lnN), ln(Tm+50), lnPRm, [ln(Tm+50)] (lnPRm)} (1)
4. Results and Discussion
The calculated Eq. 1 for stand biomass are presented in Table 4. Most of the variables are significant at the level of probability of P95 as shown in the above table. The proportions of the contribution of independent variables to the explanation of the variance of the dependent variables in Eq. 1 are shown in Table 5. We can see that mass-forming stand parameters explain on average about 89 and 86% of the variability of all biomass components in Populus and Betula, respectively, including 66 and 69% of the contribution from the stem volume. Climate variables explain only about 11 and 14% of the total biomass variability in Populus and Betula, respectively.
The Eq. 1 is tabulated in the sequence illustrated by arrows. We took from the results of tabulating the values of the component composition of biomass of Populus and Betula forests for the age of 50 years and built 3D-graphs of their dependence upon temperature and precipitation (Fig. 2 and Fig. 3).
We can see that, as a result of the introduction of synergy in the structure of the model (1), theoretical values of aspen and birch component biomass (besides branches biomass) have a common propeller-like configuration. It should be taken in mind that these propeller-shaped patterns, shown in Fig. 2 and Fig. 3, are an integral variant of sequential superposition of chain-linked regularities for the tree density, then for the volume stock, and finally for the component composition of biomass, i.e. the combined effect of both the temporal and morphological structure of stands, the geographical factor mediated by temperature and precipitation gradients being also taken into account.
Populus and Betula forests show a regularity common to all the components: in the cold zones (Tm=–40°C), the precipitation increase from 300 to 900 mm leads to the increase of biomass, with the exception of branches, and in the warm ones (Tm=10°C) to their decrease. In wet areas (РRm=900 mm), the increase of temperature from –40 to 0°C causes the decrease of biomass, and in dry areas (РRm=300 mm), it causes their increase, with the exception of branches (Fig. 2 and Fig. 3). The question of why the biomass of branches in both species goes beyond the limits of a common pattern is still to be answered.
Our results confirmed the extended concept of limiting factors (Liebig 1840, Shelford 1913, Molchanov 1971) on the example of climatic gradients of biomass of the genera Populus and Betula spp. within Eurasia, i.e. we quantified the reaction of the biomass structure of stands to the deficit or excess of heat in conditions of sufficient moisture supply and to the deficit or excess of moisture in conditions of sufficient air temperature. In warm regions (Tm=10°C), the biomass of stands is limited by excess moisture (РRm=900 mm), and in cold regions (Tm=–40°C) – by its deficit (РRm=300 mm).
Table 4 Characteristic of equations (Eq. 1) for forest stands of the genera Populus spp. and Betula spp. in Eurasia
ln(Y)(1) | а0(2) | lnA | lnV | lnN | (lnA)·(lnN) | ln(Tm+50) | lnPRm | [ln(Tm+50)]·(lnPRm) | adjR2(3) | SE(4) |
Populus | ||||||||||
ln(N) | –43.3267 | –1.2821 | – | – | – | 12.6004 | 9.0994 | –2.3803 | 0.627 | 0.78 |
ln(V) | –50.0362 | 0.2005 | – | –0.5218 | 0.1119 | 15.0504 | 8.8788 | –2.4424 | 0.420 | 0.55 |
ln(Pt) | –8.6206 | –0.0266 | 0.7473 | –0.3944 | 0.1242 | 2.2732 | 1.4947 | –0.3531 | 0.905 | 0.15 |
ln(Pa) | –1.5513 | 0.1609 | 0.8081 | –0.0132 | 0.0191 | 0.2174 | 0.1643 | –0.0185 | 0.933 | 0.16 |
ln(Pr) | –16.5031 | 0.0646 | 0.6402 | –0.3064 | 0.1094 | 3.8113 | 2.5545 | –0.5898 | 0.673 | 0.31 |
ln(Ps) | –3.5544 | 0.1812 | 0.8778 | –0.0347 | 0.0336 | 0.6100 | 0.3837 | –0.0825 | 0.946 | 0.16 |
ln(Pf) | –11.7855 | 0.1128 | 0.3782 | 0.1761 | –0.0131 | 1.9379 | 1.8206 | –0.3409 | 0.480 | 0.33 |
ln(Pb) | 6.9828 | 0.1818 | 0.5483 | –0.1436 | 0.0224 | –2.2058 | –1.4421 | 0.4097 | 0.621 | 0.40 |
Betula | ||||||||||
ln(N) | –14.3298 | –1.7556 | – | – | – | 4.9674 | 4.1686 | –0.9833 | 0.715 | 0.75 |
ln(V) | –26.8621 | 0.7441 | – | –0.4407 | 0.1195 | 8.0501 | 4.4803 | –1.2297 | 0.707 | 0.47 |
ln(Pt) | 1.4864 | –0.0459 | 0.8448 | –0.1550 | 0.0380 | 0.0336 | –0.1811 | 0.0117 | 0.940 | 0.14 |
ln(Pa) | 2.0881 | –0.0263 | 0.9323 | 0.0140 | –0.0110 | –0.5446 | –0.3178 | 0.0818 | 0.973 | 0.13 |
ln(Pr) | –4.0860 | 0.0883 | 0.5914 | –0.1821 | 0.0554 | 1.5260 | 0.4457 | –0.1905 | 0.630 | 0.36 |
ln(Ps) | 0.5362 | –0.0665 | 1.0035 | –0.0647 | 0.0121 | –0.3218 | –0.0801 | 0.0322 | 0.979 | 0.13 |
ln(Pf) | –29.6226 | 0.0321 | 0.5605 | 0.2644 | –0.0287 | 8.2177 | 4.3173 | –1.2789 | 0.423 | 0.42 |
ln(Pb) | 21.1054 | 0.1267 | 0.6788 | 0.0814 | –0.0510 | –5.4827 | –3.8714 | 0.9525 | 0.798 | 0.34 |
1 Dependent variables; 2 The constant corrected for logarithmic retransformation by: Baskerville (1972); (3)adjR2 – Determination coefficient adjusted for the number of variables; (4) SE – Standard error of the equations | ||||||||||
Table 5 Contribution of independent variables of equations (1) to the explanation of variance of dependent variables, %
ln(Y)(1) | Independent variables** | |||||||||
lnA(I) | lnV(II) | lnN(III) | (lnA)·(lnN) (IV) | I+II+III+IV | ln(Tm+M) (V) | lnPRm (VI) | [ln(Tm+M)]·(lnPRm) (VII) | V+VI+VII | ||
Populus | ||||||||||
ln(Pt) | 1.2 | 66.7 | 9.6 | 11.0 | 88.5 | 3.7 | 4.2 | 3.6 | 11.5 | |
ln(Pa) | 11.3 | 82.7 | 0.8 | 4.1 | 98.9 | 0.4 | 0.5 | 0.2 | 1.1 | |
ln(Pr) | 2.8 | 55.7 | 10.0 | 12.6 | 81.1 | 6.0 | 7.0 | 5.9 | 18.9 | |
ln(Ps) | 11.9 | 77.2 | 1.9 | 6.3 | 97.3 | 0.9 | 1.0 | 0.8 | 2.7 | |
ln(Pf) | 10.8 | 52.9 | 15.3 | 3.9 | 82.9 | 4.6 | 7.4 | 5.1 | 17.1 | |
ln(Pb) | 14.4 | 58.3 | 9.3 | 5.0 | 87.0 | 3.9 | 4.4 | 4.7 | 13.0 | |
X±σ(1) | 8.7±5.4 | 65.6±12.2 | 7.8±5.5 | 7.2±3.7 | 89.3±7.4 | 3.3±2.2 | 4.1±2.9 | 3.4±2.4 | 10.7±7.4 | |
Betula | ||||||||||
ln(Pt) | 2.9 | 84.7 | 6.0 | 5.4 | 99.0 | 0.1 | 0.7 | 0.2 | 1.0 | |
ln(Pa) | 1.7 | 90.4 | 1.1 | 3.0 | 96.2 | 1.3 | 1.3 | 1.2 | 3.8 | |
ln(Pr) | 6.4 | 66.2 | 8.9 | 9.9 | 91.4 | 3.8 | 1.8 | 3.0 | 8.6 | |
ln(Ps) | 3.8 | 87.3 | 4.6 | 2.9 | 98.6 | 0.7 | 0.3 | 0.4 | 1.4 | |
ln(Pf) | 1.5 | 38.6 | 15.0 | 5.5 | 60.6 | 13.8 | 12.3 | 13.3 | 39.4 | |
ln(Pb) | 5.9 | 48.1 | 4.7 | 10.1 | 68.8 | 9.6 | 11.4 | 10.2 | 31.2 | |
X±σ(1) | 3.7±2.1 | 69.2±21.9 | 6.7±4.8 | 6.1±3.2 | 85.8±16.7 | 4.9±5.6 | 4.6±5.6 | 4.7±5.6 | 14.2±16.7 | |
(1) X±σ – mean ± standard deviation; Designations of independent variables see in characteristics of equations (1) | ||||||||||

Fig. 2 Dependence of Populus forest biomass of Eurasia upon the mean January temperature (Tm) and mean annual precipitation (PRm)
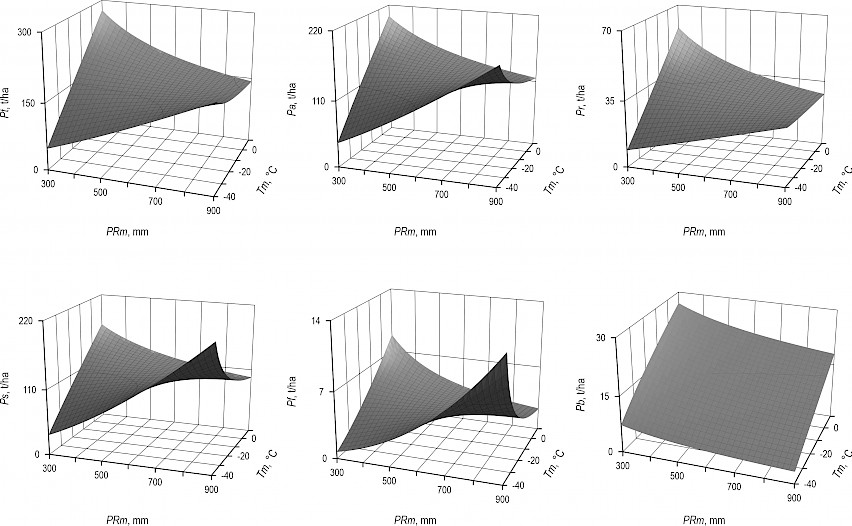
Fig. 3 Dependence of Betula forest biomass of Eurasia upon the mean January temperature (Tm) and mean annual precipitation (PRm)
However, the law of limiting factors works well in stationary conditions. With a rapid change in limiting factors (for example, air temperature or precipitation), forest ecosystems are in a transitional state, in which some factors that were still not significant may come to the fore, and the end result may be determined by other limiting factors (Odum 1971, Du et al. 2019). This may also be likely due to the small contribution of climate variables to the explanation of biomass variability compared to the temporal and morphological indices of stands (Table 2).
The pattern obtained for the genera Populus and Betula spp. are opposite to the previously obtained patterns for evergreen subgenus Pinus sp. (Usoltsev et al. 2018a). The explanation of this paradoxical phenomenon was sought with the known contradiction by the different winter physiology of evergreen and deciduous species. It was stated that in zonal gradient from the northern temperate to the subequatorial belt, foliage efficiency of deciduous species decreases, while that of the evergreen spruce and pine increases in the same direction. One of the possible causes of these opposite zonal trends of foliage efficiency in evergreen and deciduous species lies in the different conditions of physiological processes in the year cycle, in particular, in year-round assimilates accumulation in the first and seasonal one in the second (Usoltsev et al. 2018b). Besides, until 2100 different forest carbon sinks will remain in Europe: the sink strength decreases for coniferous forest (–8%), and strongly increases for deciduous forest (+67%), which is largely benefited by the lengthening of the foliated period (Davi et al. 2006).
The soundness of the modeling results needs to be proven by the goodness-of-fit statistics (collinearity tests and residuals diagnostics) obligatory for multiple regression models. This is especially important when the cross-products are used, such as (lnA)·(lnN) and [ln(Tm+50)]·(lnPRm). In our opinion such a procedure can be avoided, having in mind many uncertainties associated with both the variety of methods for obtaining harvest biomass data and their uneven representation in different climatic regions, as well as with the approximate binding of sample plots to climate maps, with the low resolution of the climate maps used, with the discrepancy between the time of obtaining harvest data and the time of compiling climate maps, etc. Therefore, we believe that our analysis is performed in the first approximation only, and its results are preliminary. If two independent variables are closely correlated, then one of them is not statistically significant and is removed from the analysis. We assume that the higher the significance of the independent variables in the equation, the more they can be considered as orthogonal or close to orthogonal. Ultimately, the contribution of each independent variable to the explanation of the variance of the dependent variable is also important. Today, the most important question is whether the dryness of habitats will increase with climate warming. This determines the possible increase in carbon sink during climate warming, or, on the contrary, its decrease and the corresponding change to the source of carbon dioxide in the atmosphere (Tyrrell et al. 2012).
5. Conclusion
Based on the database of Populus and Betula forest biomass, propeller-shaped patterns of their changes in the gradients of average annual precipitation and average January temperatures are obtained, which are common for both deciduous species. Using the principle of space-for-time substitution, it is assumed that similar patterns can also be expected in the temporal gradient in connection with different scenarios of climate shifts.
The patterns stated are opposite to the previously obtained regularities for evergreen subgenus Pinus L. An attempt is made to explain this contradiction by the different winter physiology of evergreen and deciduous species and by different reaction to the lengthening of the foliated period due to climate change.
The results obtained can be useful in the management of biosphere functions of forests, which is important in the implementation of climate stabilization measures, as well as in the validation of the results of simulation experiments to assess the carbon-deposition capacity of forests. They also provide a preliminary idea of possible shifts in forest biological productivity indicators under the influence of climate change.
6. References
Baskerville, G.L., 1972: Use of logarithmic regression in the estimation of plant biomass. Canadian Journal of Forest Research 2(1): 49–53. https://doi.org/10.1139/x72-009
Bijak, S., 2010: Tree-ring chronology of silver fir and its dependence on climate of the Kaszubskie Lakeland (Northern Poland). Geochronometria 35(1): 91–94. https://doi.org/10.2478/v10003-010-0001-9
Blois, J.L., Williams, J.W., Fitzpatrick, M.C., Jackson, S.T., Ferrier; S., 2013: Space can substitute for time in predicting climate-change effects on biodiversity. Proceedings of the National Academy of Sciences of the United States of America 110(23): 9374–9379. https://doi.org/10.1073/pnas.1220228110
Davi, H., Dufrene, E., Francois, C., Le Maire, G., Loustau, D., Bosc, A., Rambal, S., Granier, A., Moors, E., 2006: Sensitivity of water and carbon fluxes to climate changes from 1960 to 2100 in European forest ecosystems. Agricultural and Forest Meteorology 141(1): 35–56. https://doi.org/10.1016/j.agrformet.2006.09.003
Du, J., Watts, J.D., Jiang, L., Lu, H., Cheng, X., Duguay, C., Farina, M., Qiu, Y., Kim, Y., Kimball, J.S., Tarolli, P., 2019: Remote Sensing of Environmental Changes in Cold Regions: Methods, Achievements and Challenges. Remote Sensing 11(16): 1952. https://doi.org/10.3390/rs11161952
Emanuel, W.R., Shugart, H.H., Stevenson, M.P., 1985: Climate change and the broad scale distribution of terrestrial ecosystem complexes. Climate Change 7: 29–43. https://doi.org/10.1007/BF00139439
Felton, A., Nilsson, U., Sonesson, J., Felton, A.M., Roberge, J.M., Ranius, T., Ahlström, M., Bergh, J., Björkman, C., Boberg, J., Drössler, L., Fahlvik, N., Gong, P., Holmström, E., Keskitalo, E.C., Klapwijk, M.J., Laudon, H., Lundmark, T., Niklasson, M., Nordin, A., Pettersson, M., Stenlid, J., Sténs, A., Wallertz, K., 2016: Replacing monocultures with mixed-species stands: Ecosystem service implications of two production forest alternatives in Sweden. Ambio 45(2): 124–139. https://doi.org/10.1007/s13280-015-0749-2
Folland, C.K., Palmer, T.N., Parker, D.E., 2001: Climate change 2001: The scientific basis. In Contribution of Working Group I to the Third Assessment Report of the Intergovernmental Panel on Climate Change;. Houghton, J.T., Ding, Y., Griggs, D.J., Noguer, M., van der Linden, P.J., Dai, X., Maskell, K., Johnson, C.A. Eds; Cambridge University Press, Cambridge, UK: 1032.
Forrester, D.I., Tachauer, I.H.H., Annighoefer, P., Barbeito, I., Pretzsch, H., Ruiz-Peinado, R., Stark, H., Vacchiano, G., Zlatanov, T., Chakraborty, T., Saha, S., Sileshi, G.W., 2017: Generalized biomass and leaf area allometric equations for European tree species incorporating stand structure, tree age and climate. Forest Ecology and Management 396: 160–175. https://doi.org/10.1016/j.foreco.2017.04.011
Fu, L., Sun, W., Wang, G., 2017: A climate-sensitive aboveground biomass model for three larch species in northeastern and northern China. Trees 31(2): 557–573. https://doi.org/10.1007/s00468-016-1490-6
Gaüzère, P., Iversen, L.L., Seddon, A.W.R., Violle, C., Blonder, B., 2020: Equilibrium in plant functional trait responses to warming is stronger under higher climate variability during the Holocene. Global Ecology & Biogeography 29(11): 2052–2066. https://doi.org/10.1111/geb.13176
Grimm, G.W., Renner, S.S., 2013: Harvesting Betulaceae sequences from GenBank to generate a new chronogram for the family. Botanical Journal of the Linnean Society 172(4): 465–477. https://doi.org/10.1111/boj.12065
Hynynen, J., Niemistö, P., Viherä-Aarnio, A., Brunner, A., Hein, S., Velling, P., 2009: Silviculture of birch (Betula pendula Roth and Betula pubescens Ehrh.) in northern Europe. Forestry: An International Journal of Forest Research 83(1): 103–119. https://doi.org/10.1093/forestry/cpp035
Johnson, E.A., Miyanishi, K., 2008: Testing the assumptions of chronosequences in succession. Ecology Letters 11(5): 419–431. https://doi.org/10.1111/j.1461-0248.2008.01173.x
Laing, J., Binyamin, J., 2013: Climate change effect on winter temperature and precipitation of Yellowknife, Northwest Territories, Canada from 1943 to 2011. American Journal of Climate Change 2(4): 275–283. http://dx.doi.org/10.4236/ajcc.2013.24027
Lapenis, A., Shvidenko, A., Shepaschenko, D., Nilsson, S., Aiyyer, A.R., 2005: Acclimation of Russian forests to recent changes in climate. Global Change Biology 11(12): 2090–2102. https://doi.org/10.1111/j.1365-2486.2005.001069.x
Liebig, J., 1840: Die organische Chemie in ihrer Anwendung auf Agricultur und Physiologie. Braunschweig, Verlag Vieweg. In: Deutsches Textarchiv.
Lieth, H., 1974: Modeling the primary productivity of the world. International Section for Ecology Bulletin 4: 11–20.
Molchanov, A.A., 1971: Productivity of organic mass in the forests of different zones. Moscow: »Nauka« Publishing House, 275 p.
Morley, J.W., Batt, R.D., Pinsky, M.L., 2017: Marine assemblages respond rapidly to winter climate variability. Global Change Biology 23(7): 2590–2601. https://doi.org/10.1111/gcb.13578
Ni, J., Zhang, X.S., Scurlock, J.M.O., 2001: Synthesis and analysis of biomass and net primary productivity in Chinese forests. Annals of Forest Science 58(4): 351–384. https://doi.org/10.1051/forest:2001131
Odum, E.P., 1971: Fundamentals of Ecology. The third Edition. Philadelphia-London-Toronto, W.B. Saunders Company.
Olsen, N., Mandea, M., 2007: Will the Magnetic North Pole move to Siberia?. Eos Transactions American Geophysical Union 88(29): 293–300. https://doi.org/10.1029/2007EO290001
Pickett, S., 1989: Space-for-time substitution as an alternative to long-term studies. In Long-term studies in ecology: Approaches and alternatives; Likens, G.E., Eds;Springer, New York; 110–135.
Rogers, P.C., Pinno, B.D., Sebesta, J., Albrectsen, B.R., Li, G., Ivanova, N., Kusbach, A., Kuuluvainen, T., Landhäusser, S.M., Liu, H., Myking, T., Pulkkinen, P., Wen, Z., Kulakowski, D., 2020: A global view of aspen: Conservation science for widespread keystone systems. Global Ecology and Conservation 21: e00828. https://doi.org/10.1016/j.gecco.2019.e00828
Shelford, V.E., 1913: Animal communities in temperate America: as illustrated in the Chicago region; a study in animal ecology, Issue 5, Part 1. Pub. for the Geographic Society of Chicago by the University of Chicago Press: 362.
Toromani, E., Bojaxhi, F., 2010: Growth response of silver fir and Bosnian pine from Kosovo. South-East European Forestry 1(1): 20–28. https://doi.org/10.15177/seefor.10-03
Tyrrell, M.L., Ashton, M.S., Spalding, D., Gentry, B., 2012: Synthesis and Conclusions. In Managing Forest Carbon in a Changing Climate, Ashton, M.S., Tyrrell, M.L., Spalding, D., Gentry, B.,Eds.; Springer; Dordrecht, Heidelberg, London, New York: 377–387.
Usoltsev, V.A., 2014: Modeling of geographic distribution of forest primary production: according to geographical coordinates or climatic factors? Eco-Potencial 1(5): 128–138.
Usoltsev, V.A., 2020: Forest biomass and primary production database for Eurasia: digital version. The third edition, enlarged. Monograph. Yekaterinburg: Ural State Forest Engineering University.
Usoltsev, V.A., Kolchin, K.V., Malenko, А.А., 2017a: Biases of generic allometric models in local estimation of larch biomass. Bulletin of Altai State Agricultural University 4(150): 85–90.
Usoltsev, V.A., Kolchin, K.V., Noritsina, Yu.V., Azarenok, M.V., Bogoslovskaya, O.A., 2017b: Biases of generic allometric models when local estimating tree biomass of firs and 2- or 5-needled pines (Abies Mill., Pinus sylvestris L., Pinus sibirica Du Tour). Eco-Potencial 18(2): 47–58.
Usoltsev, V.A., Kolchin, K.V., Voronov, M.P., 2017c: Dummy variables and biases of allometric models when local estimating tree biomass (on an example of Picea L.). Eco-Potencial 18(1): 22–39.
Usoltsev, V.A., Shobairi, S.O.R., Tsepordey, I.S., Chasovskikh, V.P., 2018a: Modeling the additive structure of stand biomass equations in climatic gradients of Eurasia. Environmental Quality Management 28(2): 55–61. https://doi.org/10.1002/tqem.21603
Usoltsev, V.A., Shobairi, S.O.R., Chasovskikh, V.P., 2018b: Foliage productivity in Eurasian forests as related to climatic variables. Discovery Nature 12: 91–101.
Usoltsev, V., Kovyazin, V., Osmirko, A., Tsepordey, I., Chasovskikh, V., 2019a: Additive model of Larix sp. forest stand biomass sensitive to temperature and precipitation variables in Eurasia. IOP Conference Series: Earth and Environmental Science 316: 1–9. 012074. https://doi.org/10.1088/1755-1315/316/1/012074
Usoltsev, V., Piernik, A., Osmirko, A., Tsepordey, I., Chasovskikh, V., Zukow, W., 2019b: Forest stand biomass of Picea spp.: an additive model that may be related to climate and civilisational changes. Bulletin of Geography. Socio-Economic Series 45(45): 133–147. http://dx.doi.org/10.1515/18860
Usoltsev, V.А., Merganičová, K., Konôpka, B., Osmirko, A.A., Tsepordey, I.S., Chasovskikh, V.P., 2019c: Fir (Abies spp.) stand biomass additive model for Eurasia sensitive to winter temperature and annual precipitation. Central European Forestry Journal 65(3–4): 166–179. https://doi.org/10.2478/forj-2019-0017
Usoltsev, V.А., Chen, B., Shobairi, S.O.R., Tsepordey, I.S., Chasovskikh, V.P., Anees, S.A., 2020: Patterns for Populus spp. stand biomass in gradients of winter temperature and precipi-tation of Eurasia. Forests 11(9): 906. https://doi.org/10.3390/f11090906
World Weather Maps (2007). Retrieved from https://www.mapsofworld.com/referrals/weather/
Zeng, W.S., Duo, H.R., Lei, X.D., Chen, X.Y., Wang, X.J., Pu, Y., Zou, W.T., 2017: Individual tree biomass equations and growth models sensitive to climate variables for Larix spp. in China. European Journal of Forest Research 136(20): 233–249. https://doi.org/10.1007/s10342-017-1024-9
© 2022 by the authors. Submitted for possible open access publication under the
terms and conditions of the Creative Commons Attribution (CC BY) license (http://creativecommons.org/licenses/by/4.0/).
Authors’ addresses:
Seyed Omid Reza Shobairi
e-mail: omidshobeyri214@gmail.com
Research Center of Forestry Remote Sensing & Information Engineering
Central South University of Forestry and Technology
Changsha 410004
CHINA
Hui Lin *
e-mail: linhui@csuft.edu.cn
Zilin Ye
e-mail: loyzer@163.com
Research Center of Forestry Remote Sensing & Information Engineering
Central South University of Forestry and Technology
Key Laboratory of Forestry Remote Sensing Based Big Data & Ecological Security for Hunan Province
Key Laboratory of State Forestry Administration on Forest Resources Management and Monitoring in Southern Area
Changsha Changchang Forestry Technology Consulting Co., Ltd.
Changsha 410004
CHINA
Vladimir Andreevich Usoltsev
e-mail: usoltsev50@mail.ru
Ural State Forest Engineering University
Faculty of Forestry
Sibirskiy Trakt 37
620100 Yekaterinburg
and
Botanical Garden of Ural Branch of RAS
Department of Forest Productivity
ul. 8 Marta 202a
620144 Yekaterinburg
RUSSIA
Anna Andreevna Osmirko
Ural State Forest Engineering University
Faculty of Forestry
Sibirskiy Trakt 37
620100 Yekaterinburg
RUSSIA
Ivan Stepanovich Tsepordey
e-mail: common@botgard.uran.ru
Botanical Garden of Ural Branch of RAS
Department of Forest Productivity
ul. 8 Marta 202a
620144 Yekaterinburg
RUSSIA
Shoaib Ahmad Anees
e-mail: saanees@bjfu.edu.cn; anees.shoaib@uad.edu.pk
Beijing Key Laboratory of Precision Forestry
Forestry College, Beijing Forestry University
Beijing 100083
CHINA
* Corresponding author
Received: December 26, 2020
Accepted: August 9, 2021
Original scientific paper