
Effects of Reduced Tyre Pressures on Wear of Thin-Surfaced Roads
doi: https://doi.org/10.5552/crojfe.2025.3610
volume: issue, issue:
pp: 9
- Author(s):
-
- Bergqvist Mikael
- Björheden Rolf
- Eliasson Lars
- Article category:
- Original scientific paper
- Keywords:
- forest roads, CTI, road surface, rut formation
Abstract
HTML
There are about 230,000 km of forest roads in Sweden, and maintenance and construction costs for forest roads per harvested cubic meter of wood is increasing. This is to some extent caused by increased demands for precision in delivery of fresh wood cut to customer specifications, shorter periods with frozen roads, increased vehicle weights and an ageing forest road network. Although many roads are constructed using the Swedish Forest Agency’s Guidelines, deviations are made to reduce construction costs. Further, short planning horizons reduces the period of settling, intended to allow the road to dry and consolidate under its own weight. In northern Sweden, central tyre inflation systems are used to reduce road wear from logging trucks and increase the period a road is accessible for traffic with logging trucks. To reduce road costs, the industry needs efficient road building methods and ways to reduce road wear. Thus, they want to know how thinner surface layers influence road wear and if reduced tyre pressures can help to reduce road wear on such roads. The aim of this study was to compare rutting by vehicles with low tyre pressures to rutting by vehicles running with standard highway tyre pressures on forest roads with thin surface layers.Three test roads, each divided into six sections with systematical sampling points for measurement of rut depth and road strength, were built. The test roads were trafficed by a fully laden CTI equipped log truck and trailer. Low tyre pressures were used on one side of the road and standard pressures on the other. Rutting was measured throughout the study. Reduced tyre pressures reduced rut development on two roads, while no differences could be found on the road that had not dried prior to testing. The positive effects of reduced pressures were largest on the best built road sections. The effect of thin aggregate layers should be further studied. This study failed in that sense as the variability in gravel thicknesses was to large within sections. Although the need to access the road may be high, access should not be approved until the terrace has dried and settled. Road wear can be mitigated by using CTI equipped trucks, but not on roads of too low quality.
Effects of Reduced Tyre Pressures on Wear of Thin-Surfaced Roads
Mikael Bergqvist, Rolf Björheden, Lars Eliasson
https://doi.org/10.5552/crojfe.2025.3610
Abstract
There are about 230,000 km of forest roads in Sweden, and maintenance and construction costs for forest roads per harvested cubic meter of wood is increasing. This is to some extent caused by increased demands for precision in delivery of fresh wood cut to customer specifications, shorter periods with frozen roads, increased vehicle weights and an ageing forest road network. Although many roads are constructed using the Swedish Forest Agency's Guidelines, deviations are made to reduce construction costs. Further, short planning horizons reduces the period of settling, intended to allow the road to dry and consolidate under its own weight. In northern Sweden, central tyre inflation systems are used to reduce road wear from logging trucks and increase the period a road is accessible for traffic with logging trucks. To reduce road costs, the industry needs efficient road building methods and ways to reduce road wear. Thus, they want to know how thinner surface layers influence road wear and if reduced tyre pressures can help to reduce road wear on such roads. The aim of this study was to compare rutting by vehicles with low tyre pressures to rutting by vehicles running with standard highway tyre pressures on forest roads with thin surface layers.Three test roads, each divided into six sections with systematical sampling points for measurement of rut depth and road strength, were built. The test roads were trafficed by a fully laden CTI equipped log truck and trailer. Low tyre pressures were used on one side of the road and standard pressures on the other. Rutting was measured throughout the study. Reduced tyre pressures reduced rut development on two roads, while no differences could be found on the road that had not dried prior to testing. The positive effects of reduced pressures were largest on the best built road sections. The effect of thin aggregate layers should be further studied. This study failed in that sense as the variability in gravel thicknesses was to large within sections. Although the need to access the road may be high, access should not be approved until the terrace has dried and settled. Road wear can be mitigated by using CTI equipped trucks, but not on roads of too low quality.
Keywords: forest roads, CTI, road surface, rut formation
1. Introduction
In Sweden between 70 and 75 million cubic meters of wood is harvested each year to supply saw mills, pulp mills and the energy sector with raw material (Paulsson 2020). Transport of the harvested wood products from roadside landings to the forest industries is a crucial part of the supply from stump to industry (Väätäinen et al. 2021). Although various modes of transportation are used, all harvested wood on the landings must be transported by truck, either directly to the mill or to a terminal for storage and/or reloading to railway cars or ships/barges (Väätäinen et al. 2021). Truck transports of wood start at a landing where the different products harvested are stacked and use a dense network of small forest roads and private roads of varying trafficability for the first kilometres, and public roads with good trafficability and better maintenance for most of the distance. The 79 million cubic meter harvested in Sweden in 2018 were on average transported 90 km by truck from 236,000 individual landings, of which 86% were on private roads (Asmoarp et al. 2020).
In Sweden, there are 610,500 km of roads, whereof 98,500 km of public roads, 42,800 km of municipal roads and 469,200 km of private roads (The Swedish Transport Administration 2020). Forest roads make up about half of the private roads, and the costs for forest roads per harvested cubic meter of wood is rapidly increasing (Constantino and Eliasson 2021). This applies to both construction of new roads, including upgrading to a higher road class, and to road maintenance (Fig. 1). There are a number of factors that may contribute to this trend, e.g. increased demands for precision in delivery of fresh wood cut-to-length according to customer demands i.e. correct volumes of ordered assortments each month, shorter periods with frozen roads, increased vehicle weights and an ageing forest road network.
Parts of the forest road network are more than 50 years old and need to be either upgraded to a higher standard or replaced by new roads. Many old roads were built in low laying parts of the terrain to improve the extraction of wood from the forest to the road using horses or early forest machines, i.e. often on wetter and more fine-grained soil than if they had been built in higher terrain. This makes them costlier both to maintain and to upgrade, and Swedish road managers, as their American colleagues (cf. Swift and Burns 1999, Dodson 2021), have to consider if it is economically sensible to relocate the road upslope instead of upgrading the existing road to meet current standards. Furthermore, a significant proportion of the existing road network has been built for heavy transport use during frozen conditions. However, the time when roads are frozen is getting shorter (Lehtonen et al. 2019), reducing the value of roads built for winter use only.
An increasing importance of road network accessibility, caused by greater requirements for precision in deliveries to customers and financial penalties if the agreed delivery volumes are not met, is enhancing the need for high standard roads. Climate models indicate further reductions of the periods with frozen road conditions in Fenno-Scandia (Lehtonen et al. 2019) and North America (Daniel et al. 2018). This will decrease the amount of wood that can be transported on roads that are only accessible in winter conditions. Consequently, a larger share of the road network needs to be accessible regardless of weather conditions to enable the wood supply organisations to deliver agreed amounts of wood to the industry at the agreed time. This leads to increasing costs for standard improvements of existing roads and construction of new roads per harvested cubic metre (Fig. 1, Eliasson 2024).
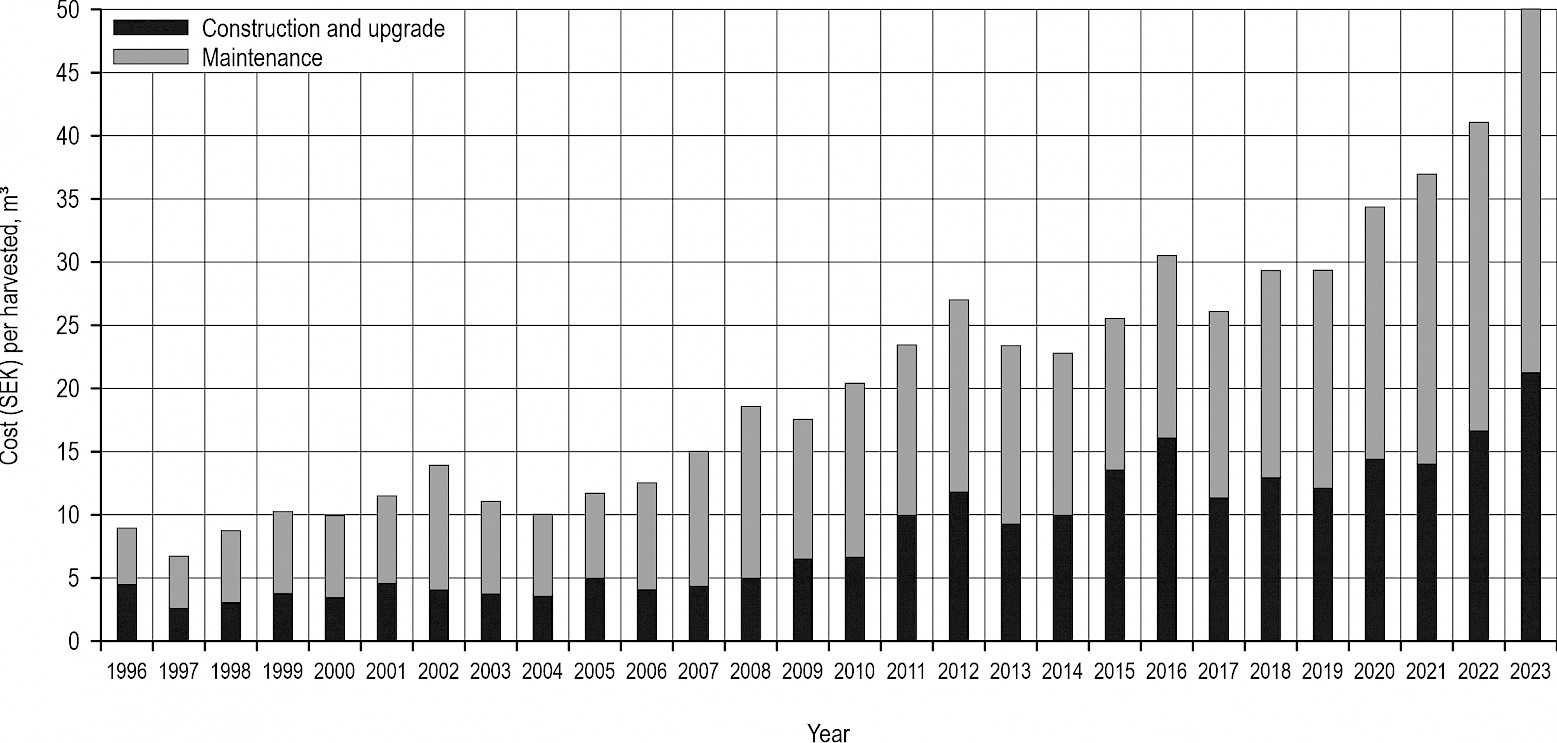
Fig. 1 Development of forest road costs (SEK per m3) for large scale forest owners split to costs for new construction including standard improvements and maintenance costs from 1996 to 2023 (Eliasson 2024)
Although it is up to the road owner to decide how a road should be built, as long as environmental regulations are followed, many roads are constructed using the Swedish Forest Agency's Guidelines for Planning and Construction of Road Class 3 and 4 (Swedish Forest Agency 2011). The guidelines give recommendations on the amount of crushed aggregate needed in the road surface layer depending on the in-situ subgrade material type, road construction type (through cut or raised embankment), and the intended road accessibility class.
To reduce road construction costs, these recommendations are not always followed. Furthermore, according to short planning horizons, recommendations for a period of settling, to allow the road to consolidate under its own weight (cf. Ryan et al. 2004), may not be adhered to. Instead, technical solutions to reduce the road wear from logging trucks have been introduced in northern Sweden, e.g. tyre pressure control systems (TPC), also known as central tyre inflation (CTI) systems. Reduced tyre pressures have been shown to reduce rutting on gravel surfaced roads (Bradley 1993, 2001, Granlund 2006a, 2006b, Brokmeier 2017) and to increase the period a road is accessible for traffic with logging trucks (Bradley 2006). Furthermore, reduced tyre pressure increases traction (Bradley 1993, Brokmeier 2017), reduces slip (Brokmeier 2017), but increases fuel consumption on paved roads (Brokmeier 2017).
Industry is interested to know how thinner surface layers influence road wear and if the use of reduced tyre pressures can help to reduce road wear on forest roads with thin surface layers. The aim of this study was to contribute to such knowledge by comparing rutting by vehicles with low tyre pressures (using CTI) to rutting by vehicles running with standard highway tyre pressures on forest roads with thin surface layers.
2. Materials and Methods
In 2015, three test roads (in the following referred to as Road 1, 2 and 3, respectively) were built in central Sweden (Fig. 2) by the host company, SCA Skog AB. Each test road was built in in a horseshoe shape connecting to an existing high standard forest road in both ends creating an endless loop for the test vehicle. Roads 1 and 2 were built on silty sand soils, and Road 3 partly on a well-graded gravel soil and partly on a poorly graded sand.
At the time of road construction, the intention was to evaluate both tyre pressure setting and road surface thickness. The intended surface thickness classes for the sections (5, 10 and 15 cm) were narrow, and when measuring surface layer thickness after road construction no significant differences between sections could be found. Thus, the evaluation of surface thickness was dropped from the analysis.
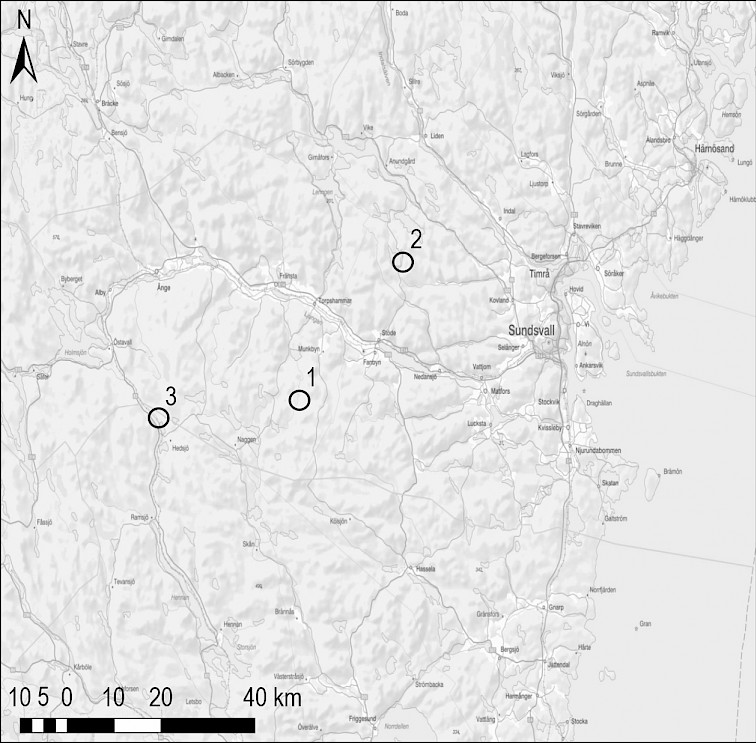
Fig. 2 Location of test roads, west of Sundsvall in central Sweden
2.1 Test Roads
The horseshoe shaped test roads had two 150 m long straight sides connected at one end by an existing forest road and at the other end by a 180° curve. The straight sides were divided into six 50 m long sections, which were numbered consecutively from 1 to 6 in the direction of travel.
The roads were built with a 5.5–6 m wide and level running surface, which was chosen instead of the usual cross sloped one to avoid load shift on the truck that might unequally influence rut formation. Subgrade construction started in June 2015 on Road 1 and ended in September for Road 3 (Table 1). After levelling, the subgrade was compacted with a 5.9 tonne Dynapac CH47 vibrating drum towed compactor. The compactor made six passes over the test road subgrade. Thereafter, a surface layer of gravel was spread by CTI-fitted gravel trucks and levelled by an excavator with a levelling bar on Road 1 and 3; on Road 2, under-body- spreading blades mounted on gravel trucks were used for levelling. The surface gravel was not compacted, except for sections 1 to 3 on Road 3. All three test roads were surfaced with crushed rock aggregate (fraction 0–40) taken from different quarries.
Road 3 had two construction differences compared to Road 1 and 2. Firstly, due to the stoniness of the till soil, the terrace was cleared of large stones (>200 mm) down to a depth of 20 cm by an excavator using a screening bucket. These stones were discarded on the back slope of the ditch. Secondly, on sections 1 to 3 of Road 3, the surface layer was packed by six passes of the CH47 compactor. On average, this increased gravel CBR by 16 per cent and terrace CBR by 17 per cent.
A sample of the subgrade was taken in each road section and two samples from the surface material were taken per road, and all samples were sent to the NCC material laboratory in Sundsvall for screening according to SS-EN 933-1. While there were no variations in the subgrade within Roads 1 and 2, this was not the case for Road 3. It had a subgrade that consisted of well drained sands and gravels with a low proportion of fine-grained material. The material was layered and very varied, leading to a variation between sections, were sections 1 and 6 were situated on poorly graded sands and the remaining sections on well graded gravel soils (Fig. 3).
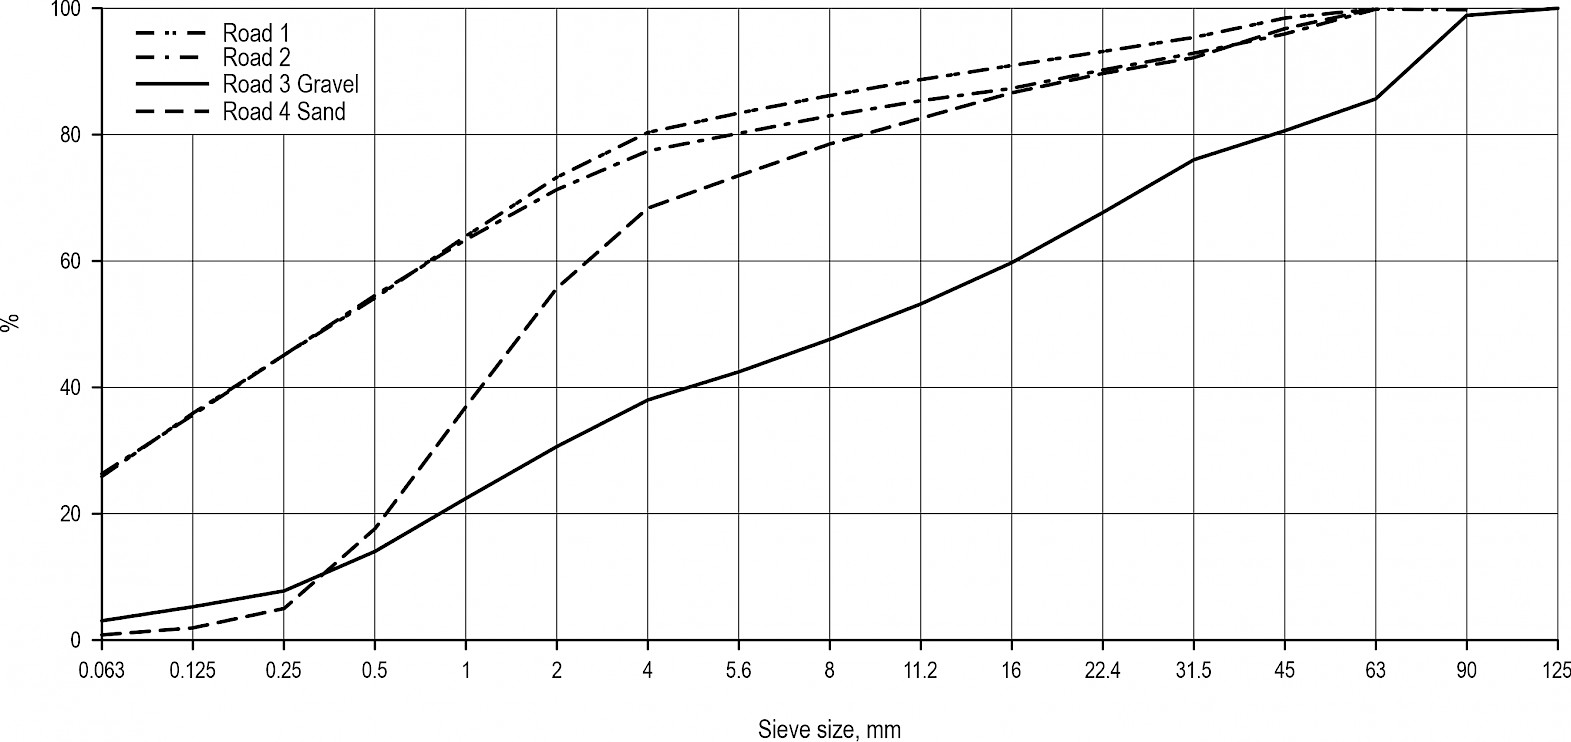
Fig. 3 Particle size distribution for in situ material (subgrade) used for terrace
Table 1 Description of test roads; soil classification of in situ soil, road building and test dates and CBR percentages of finished road immediately after construction
|
Road |
Soil classification |
Building period |
Test start date |
CBR terrace left |
CBR terrace right |
|
1 |
Silty sand |
June and August |
September 22 |
23 |
23 |
|
2 |
Silty sand |
July - August |
August 18 |
21 |
24 |
|
3 |
– |
September |
October 13 |
– |
– |
|
Section 1, 6 |
Poorly graded sand |
– |
– |
36 |
33 |
|
Section 2–5 |
Well graded gravel |
– |
– |
66 |
63 |
2.2 Test Vehicle
The same vehicle and driver were used on all three test roads. The test vehicle was a three-axle tandem-drive Mercedes Actros log truck pulling a 4-axle logging trailer. The test vehicle was fitted with a three channel Tireboss TPC system capable of independently controlling the inflation of the steering, drive, and trailer tyres. Tyre pressure was monitored and varied via the TPC operator control. Two settings for tyre pressure were used: normal tyre inflation pressures appropriate for fully loaded travel at highway speeds (883, 717, 841 kPa on steering axle, drive axle and trailer axle tyres, respectively); and reduced tyre pressures appropriate for fully loaded travel at the slower speeds used on forest roads (600, 338, 450 kPa on the steering axle, drive axle and trailer axle tyres, respectively). These existing settings were optimized for the test vehicle when the TPC system was fitted and not changed for the experiment.
The test vehicle log payload remained unchanged throughout the trafficking of each test road, after completing tests on each road, the truck was weighed at the SCA measuring station at Ortviken to determine axle loads. The truck was driven onto the vehicle scales one axle at a time and weighed. Due to variations in the load weight, gross vehicle weight was 64.3, 60.9 and 62.7 Mg after traffic on Road 1, 2 and 3, respectively. Average front axle load was 7.0 Mg, drive axles 10.4 Mg each, front trailer bogie 16.5 Mg, and rear trailer bogie load was 18.7 Mg. Measurements of tyre footprint were made at the same time. The contact area of each tyre was measured from a painted footprint that was created by parking the loaded truck on top of sheets of heavy gauge paper, and by spraying paint around the edges of all tyres. The area not reached by spray paint was assumed to equal the tyre gross contact area on a paved surface. The total vehicle contact area at normal tyre pressures was 1.36 m2 with an average ground pressure of 440–464 kPa. Low tyre pressures increased the total contact area to 1.66 m2 and reduced average ground pressure to 360–379 kPa.
2.3 Road Testing
During testing the loaded test vehicle was driven on the loop created by the test road and the existing logging road. The truck started in the junction before section 1 and drove the test road to section 6, then returned to the starting point using the existing forest road. To simplify testing, a number of passes were driven with one tyre pressure before ruts were measured. This procedure was then repeated with the other tyre pressure on the other side of the road.
Rut depth was measured periodically during the trafficking of the test roads - more frequently during the initial period of rapid rut formation and then less frequently as rut formation slowed. If the road surface at a sampling point was so deeply rutted (>250 mm) that truck accessibility or safety were jeopardized, the measurement was stopped at the affected point and the rut was filled in before the test continued for the remaining points in the section.
2.4 Measurements
Measurements were taken at 14 points in each road section, seven on each side of the road (Fig. 4). Points 1L and 1R were placed 5 m after the start of the section with subsequent points every fifth meter. Normal tyre pressure test points on the right side of the road and low tyre test points on the left side, seen in the direction of travel. No measurements were taken in the central wheel paths.
The gravel thickness of the surface layer was measured with a straight edge and a measuring stick. The gravel thickness was estimated by excavating down to the subgrade and measuring vertically upwards to the straight edge laid across the hole on the road surface. Rut depth was measured with a 1 m long straight edge and an aluminium ruler. Rutting was measured as the greatest vertical distance from the bottom of the wheel lane rut to a straight line drawn between the road surface on either side of the rut, following the instructions applying for the STP model (Bolander 1996). Rut depth was expressed as a negative value, indicating the difference between the deepest point of the rut and the highest point of the road surface.
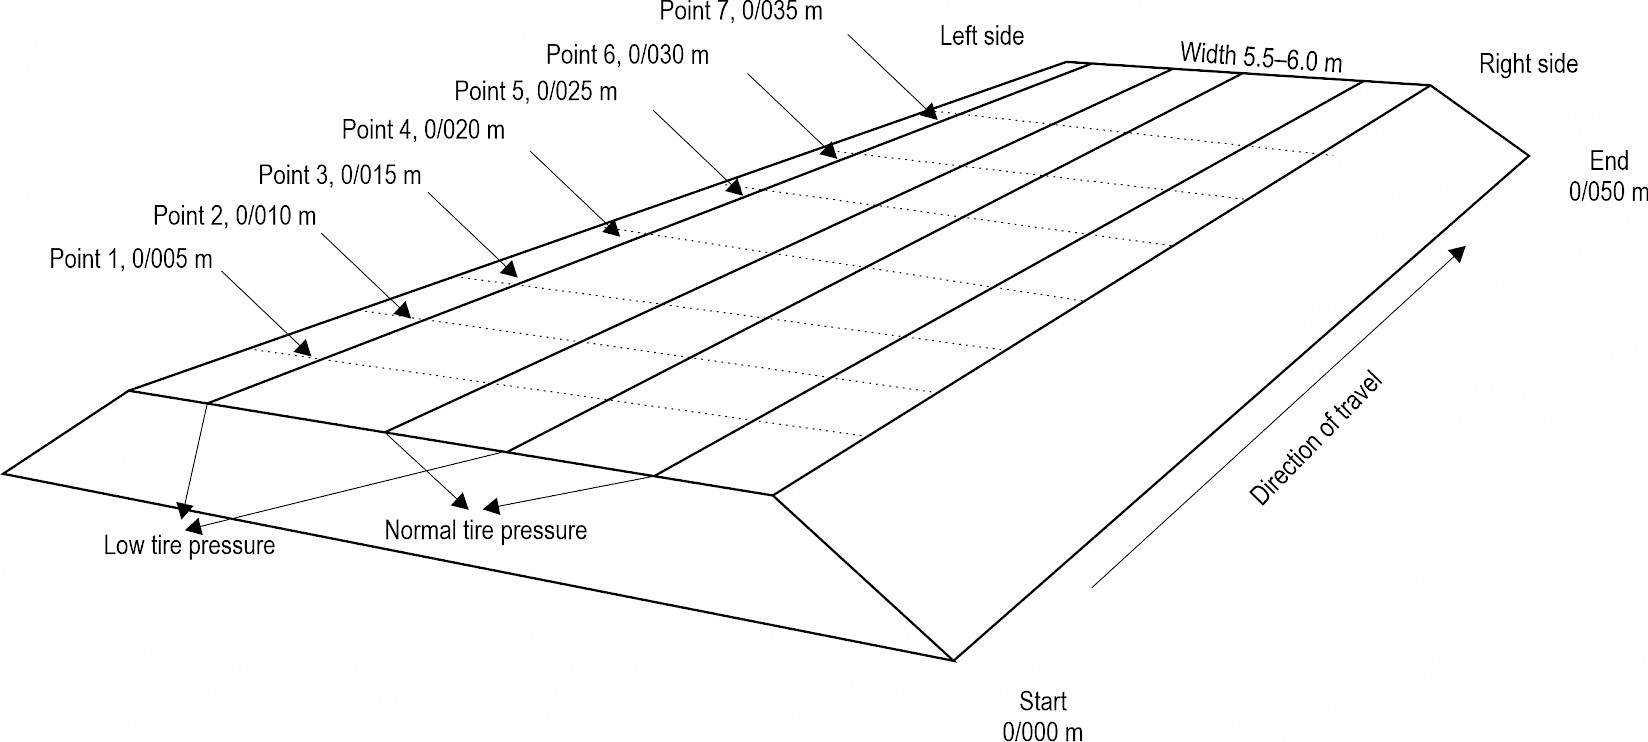
Fig. 4 Location of truck paths and measurement points in a road section. Measurement points are located at the same distances in the right wheel path for the normal tyre pressure treatment as for the low tyre pressure treatment in the left wheel path
2.5 Statistical Analyses
The three roads have been treated as three different experiments during the analyses, and thus analysed separately from each other. This has been necessitated by changes in road construction (adding compaction of the surface layer on three sections on Road 3 and the different characteristics of the roads.
At the onset of the experiment, it was intended to test the effect of two influencing factors, tyre pressure (Low, Normal) and gravel thickness (5, 10, 15 cm). However, the measurements of gravel thickness in the surface layer revealed that the contractors had not been able to create sections with consistent and different gravel thickness. For this reason, gravel thickness was excluded as a factor in the analyses.
For each road, rut depths were analysed with a mixed model containing section (α) as a random variable, tyre pressure (P) as factor and number of passes (N) as a covariate:
 (1)
(1)
The sections that had received surface compaction in Road 3 were excluded from this first analysis. As rut depths are not normally distributed, a log transformation was needed, and in all models the response variable (µ) used was ln (rut depth). All observations with refilled ruts or ruts deeper than 250 mm have been treated as missing values.
All sections in Road 3 were included in a second analysis with a mixed model containing section as a mixed variable, both tyre pressure and surface compaction (C) as factors and number of passes as a covariate:
 (2)
(2)
3. Results
On September 22, 2015, the rut formation test was carried out on Road 1. The terrace had not dried out, indicated by standing water in the ditches, which led to a weak road. Ruts developed quickly both at normal and low tyre pressures. In some places, deep ruts formed as a combination of deep subgrade failure and road shoulder shearing failure. After 28 passes at normal highway tyre pressures, deep ruts in a rupture on Section 5 caused the truck to nearly overturn, which led to an immediate stop of further testing for the sake of safety. No significant effect of CTI was found for Road 1, which was wet and constructed of silty sand (Table 2). In the range from 1 to 15 passes, the modelled difference in rut depth between low and standard highway pressures are smaller than 7 mm, which is practically negligible and not statistically significant (Fig. 5).
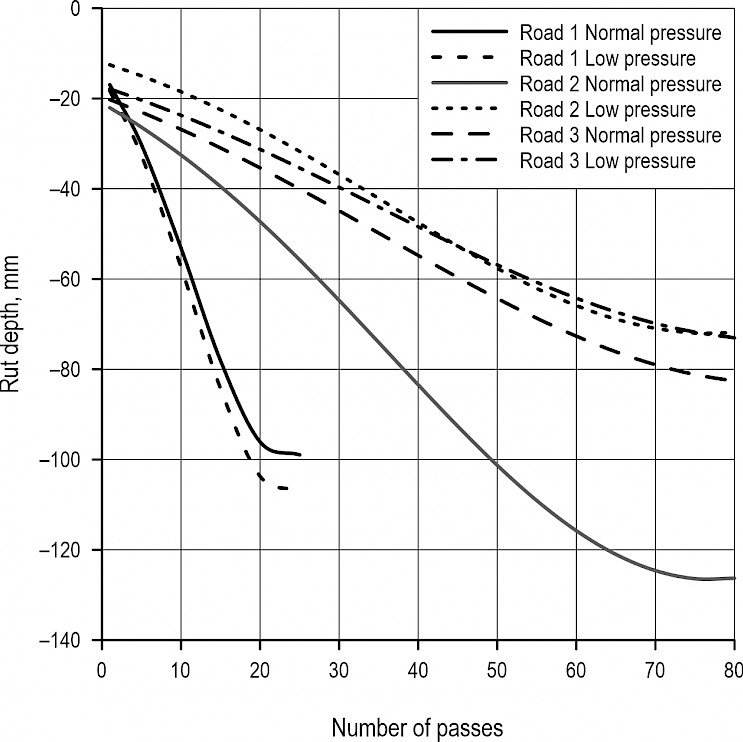
Fig. 5 Rut depth development by number of passes for roads with uncompacted surface layer
Table 2 Fixed effect ANCOVA tables from the factorial mixed model evaluating the effects of tyre pressure (P) and number of passes (N) on ln (rut depth) for Roads 1 to 3
|
Source |
Num DF |
Den DF |
F Value |
p |
|
Road 1 |
||||
|
P |
1 |
489 |
2.81 |
0.0944 |
|
N |
1 |
489 |
316.94 |
<.0001 |
|
N2 |
1 |
489 |
107.29 |
<.0001 |
|
Road 2 |
||||
|
P |
1 |
663 |
141.86 |
<.0001 |
|
N |
1 |
663 |
321.89 |
<.0001 |
|
N2 |
1 |
663 |
114.10 |
<.0001 |
|
Road 3 |
||||
|
P |
1 |
285 |
3.80 |
.0522 |
|
N |
1 |
285 |
194.24 |
<.0001 |
|
N2 |
1 |
285 |
66.25 |
<.0001 |
For Road 2 and the sections of Road 3 with uncompacted surface, the use of a low tyre pressure reduced rut development (Table 2), although only significantly so for Road 2. Here the difference in rut depths after 75 passes between low and standard highway pressures is 54 mm for Road 2 and 10 mm for Road 3. However, if considering the surface layer compaction made on three of the sections in Road 3, model 2 (Table 3) shows that there is a clear positive interaction effect between tyre pressure and surface compaction. Thus, the combination of low tyre pressure and surface compaction strongly reduced rut development. In this extended analysis, the difference in rut depth after 75 passes between the low and standard highway pressures is a negligible 7 mm on the uncompacted sections, while it is 50 mm on the compacted sections (Fig. 6).
Table 3 Fixed effect ANCOVA table from factorial mixed model evaluating the effects of tyre pressure (P), surface compaction (C) and number of passes (N) on ln (rut depth) for Road 3
|
Source |
Num DF |
Den DF |
F Value |
p |
|
P |
1 |
573 |
180.73 |
<.0001 |
|
C |
1 |
4 |
5.46 |
0.0797 |
|
C×P |
1 |
573 |
122.52 |
<.0001 |
|
N |
1 |
573 |
450.03 |
<.0001 |
|
N2 |
1 |
573 |
173.57 |
<.0001 |
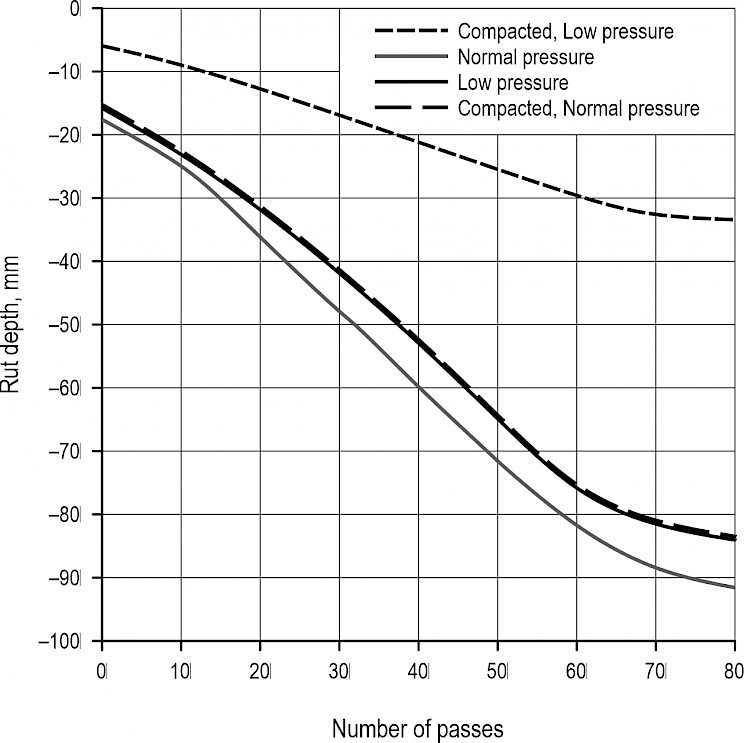
Fig. 6 Rut depth development by number of passes for Road 3
4. Discussion
The rut development trials were conducted shortly after the road construction was finished. Thus, the roads had only a short time to settle and dry before they were taken into use, a situation that is common in forestry practice. The effects of the absence of a settling-in period is obvious, especially Road 1 was too wet for traffic with heavy vehicles and, thus, only coped with 28 loads of a fully laden truck. Starting to use a road shortly after construction will increase the risk of rut development and of high early maintenance costs (Keller and Sherar 2003, Ryan et al. 2004). For a properly constructed road that has had time to settle, maintenance costs in the first years after completion should be low.
The importance of tyre pressure on rut formation is shown clearly when the results for Road 2 and 3 are compared, with and without the use of optimized tyre pressure (Fig. 4). This is in line with the results of previous studies (Grau 1993, Bradley 2001 and 2006, Brokmeier 2017). The same difference was not seen on Road 1 because the road structure was very wet and generally not suitable for trafficking. The vehicle sank very quickly through the surface, and the trial had to be discontinued after a limited number of passes (18 and 28, respectively). The bearing capacity of the road structure was so low that tyre pressure had little effect on rut formation.
On Road 3, rut depth development was significantly affected by an interaction between tyre pressure and compaction of the road surface. As shown in Fig. 6, the combination of low tyre pressure and compaction of the surface favour the reduction of rut development. However, this effect is influenced by the soil type as the surface layer compaction increased the CBR values in the terrace by 66% on the sandy sections and only by 10% on the gravel sections. Furthermore, some of the initial rut formation on the uncompacted sections is caused by the test vehicles compaction of the gravel layer.
The reduced rut formation on Road 2 and 3 was accomplished even though the test vehicles were not allowed to vary the wheel paths, and thus could not take full advantage of the reduced shearing forces at low tyre pressure. In practice, drivers do vary the wheel paths, dramatically decreasing rutting rates compared to predictions by models based on fixed wheel paths (Bradley 2006). Further studies of the effects of reduced tyre pressures need to be conducted under live conditions, where drivers reduce ruts by compressing the raised edges of ruts. Using this procedure, especially if traffic intensity is also limited, traffic is also possible on weak roads, without risk of sinking in and rupturing the roads. At high tyre pressure, the higher shearing forces tend to shear the decompacted materials in the raised edges of ruts and cause damage to the road (Bradley 2006).
In the study, measurements had to be stopped before road closure on nine out of 252 measurement points, as ruts had to be filled for safety reasons. For subsequent passes, these measurement points were treated as missing values, which may cause an underestimation on late rut development in the analysis. Five of these points were on Road 1, three for normal pressure and two for the low-pressure treatment, one on Road 2 and three on Road 3. On Road 2 and 3, only the normal pressure treatment was affected by lost measurement points.
For all tests, there was a tendency towards waviness in the surface and the material appeared to shear lengthways (in the direction of travel) at normal tyre pressure. However, these types of road wear were not captured by the rut depth measurements.
A second objective of the study was to evaluate the effects of the thicknesses of thin surface layers. However, even the thickest layers were thinner than recommended by the Swedish Forest Agency (Swedish Forest Agency 2011) for Road 1 and 2 or according to recommendations (Road 3), given the in situ material used for the terrace. The evaluation could not be made since the contractors were not able to produce consistently thick layers of gravel on uneven terraces with the necessary precision to get significant differences in gravel thickness between treatments. In retrospect, planned differences in gravel thickness should have been larger between treatments.
The very positive effects of a compacted gravel layer and reduced tyre pressures on Road 3 was surprising to some extent. It is well known that compaction of the surface layer has positive effects and is recommended (Keller and Sherar 2003, Ryan et al. 2004), but the positive interaction with low tyre pressures merits further studies.
5. Conclusions
In order to reduce road costs, it is necessary to find more efficient road building methods. The effect of thin aggregate layers on both construction and maintenance costs should be further studied. This study failed in that sense as an evaluation of target gravel thicknesses was not possible given the variability in gravel thickness in the sections. Although the need to access the road may be high, access should not be approved upon until the terrace has dried and settled. The study shows that road wear can be mitigated by using CTI equipped trucks, but the effect is small on roads of too low quality. The positive effect on rut development of the use of low tyre pressures is enhanced if the surface layer is compacted prior to traffic with heavy vehicles.
Acknowledgments
The authors thank Alan Bradley, FPInnovations, for his comments on the study design and analysis of the data. We also thank the host company SCA for providing test sites and building the test roads.
Conflicts of Interest
The authors declare no conflict of interest. At the time of the study M.B. was employed as road specialist by Skogforsk. As host company SCA did influence building of test roads (roads were built by their contractors) and the timing of the experiments (availability of the test truck).
6. References
Asmoarp, V., Davidsson, A., Gustafsson, O., 2020: Forestry road transports 2018 − Figures regarding the flow of unprocessed biomass from forest to industry in Sweden. Skogforsk, Arbetsrapport 1043, 30 p.
Bolander, P., 1996: Earth and aggregate surfacing design guide for low volume roads. Washington, DC, U.S. Dept. of Agriculture, Forest Service.
Bradley, A.H., 1993: Testing a central tire inflation system in western Canadian log-hauling conditions. Forest Engineering Research Institute of Canada. Pointe Claire, Quebec. Technical note TN-197, 11 p.
Bradley, A.H., 2001: Evaluation of forest access road design for use with CTI equipped logging trucks. Forest Engineering Research Institute of Canada (FERIC). Vancouver, Canada, Advantage Report 53 p.
Bradley, A.H., 2006: Hauling with Full Axle Weights and Reduced Tire Pressures on Weight-Restricted Roads in British Columbia. Transportation Research Record 1967(1): 20–26. https://doi.org/10.1177/0361198106196700103
Brokmeier, H., 2017: Central Tire Inflation System for timber transport in Germany. International Journal of Forest Engineering 28(3): 211–225. https://doi.org/10.1080/14942119.2017.1354529
Constantino, S., Eliasson, L., 2021: Cost in large scale forestry in 2020. Swedish Forestry Agency, Statistica Meddelanden JO 0307 SM 2001, 22 p.
Daniel, J.S., Jacobs, J.M., Miller, H., Stoner, A., Crowley, J., Khalkhali, M., Thomas, A., 2018: Climate change: potential impacts on frost–thaw conditions and seasonal load restriction timing for low-volume roadways. Road Materials and Pavement Design 19(5): 1126–1146. https://doi.org/10.1080/14680629.2017.1302355
Dodson, E.M., 2021: Challenges in Forest Road Maintenance in North America. Croatian Journal of Forest Engineering 42(1): 107–116. https://doi.org/10.5552/crojfe.2021.777
Eliasson, L., 2024: Skogsbrukets kostnader och intäkter 2023 (Costs and revenues in Swedish forestry 2023). Skogforsk, Webresultat 39: 5 p.
Granlund, P., 2006a: CTI on roundwood haulage vehicles. Skogforsk, Uppsala, Sweden. Redogörelse 3: 40 p.
Granlund, P., 2006b: Five million km covered in CTI trials. Skogforsk, Uppsala, Sweden. Resultat 10: 4 p.
Grau, R.W., 1993: Effects of variable tire pressure on road surfacings. volume I, Design, construction, behavior under traffic, and test results. U.S. Army Engineer Waterways Experiment Station, Vicksburg, Miss. Technical report, U.S. Army Engineer Waterways Experiment Station GL-93-20 v. 1.
Keller, G., Sherar, J., 2003: Low-Volume Roads Engineering, Best Management Practices. Field Guide. Conservation Management Institute (CMI), College of Natural Resources, Virginia Tech, 183 p.
Lehtonen, I., Venäläinen, A., Kämäräinen, M., Asikainen, A., Laitila, J., Anttila, P., Peltola, H., 2019: Projected decrease in wintertime bearing capacity on different forest and soil types in Finland under a warming climate. Hydrol. Earth Syst. Sci. 23(3): 1611–1631. https://doi.org/10.5194/hess-23-1611-2019
Paulsson, J., 2020: Gross felling in 2018 and preliminary statistics for 2019. Swedish Forest Agency, Statistica meddelanden JO0312 SM 2001, 38 p.
Ryan, T., Phillips, H., Ramsay, J., Dempsey, J., 2004: Forest Road Manual. Guidelines for the design, construction and management of forest roads. Dublin, COFORD, 170 p.
Swedish Forest Agency, 2011: Anvisningar för projektering och byggande av skogsbilväg klass 3 och 4. Svedish Forest Agency, Jönköping, 50 p.
Swift, L.W., Burns, R.G., 1999: The Three Rs of Roads: Redesign, Reconstruction, and Restoration. Journal of Forestry 97(8): 40–44. https://doi.org/10.1093/jof/97.8.40
The Swedish Transport Administration, 2020: Sveriges vägnät (The Swedish road network), The Swedish Transport Administration.
Väätäinen, K., Anttila, P., Eliasson, L., Enström, J., Laitila, J., Prinz, R., Routa, J., 2021: Roundwood and Biomass Logistics in Finland and Sweden. Croatian Journal of Forest Engineering 42(1): 39–61. https://doi.org/10.5552/crojfe.2021.803
© 2025 by the authors. Submitted for possible open access publication under the
terms and conditions of the Creative Commons Attribution (CC BY) license (http://creativecommons.org/licenses/by/4.0/).
Authors' addresses:
Mikael Bergqvist
e-mail: mikael.k-bergqvist@gmail.com
Bruksvägen 11
95691 Överkalix
Sweden
Prof. Rolf Björheden, PhD
e-mail: Rolf.Bjorheden@skogforsk.se
Assoc. prof. Lars Eliasson, PhD *
e-mail: Lars.Eliasson@skogforsk.se
Skogforsk
Uppsala Science Park
751 83 Uppsala
SWEDEN
* Corresponding author
Received: August 28, 2024
Accepted: January 27, 2025
Original scientific paper