
Forest Road Design Based on Different Methods of Field Data Survey
doi: https://doi.org/10.5552/crojfe.2026.4567
volume: issue, issue:
pp: 21
- Author(s):
-
- Lovrinčević Mihael
- Papa Ivica
- Popović Maja
- Hodak Luka
- Pentek Tibor
- Đuka Andreja
- Article category:
- Original scientific paper
- Keywords:
- photogrammetry, theodolite, total station, LiDAR, UAV, forest accuracy, forest road, design, earthworks
Abstract
HTML
In today's modern forestry, which is founded on sustainable management and development, it is essential to carry out the design phase of forest roads with quality, both for financial and environmental reasons. The basis for this is high-quality field data. This research tested available and potentially suitable methods for field surveys in the process of designing a forest road, including the classical survey method, GNSS and total station survey, as well as structure from motion and airbone lidar scanning survey. A total of 23 forest road designs were created through 3 design methods. Four important forest road parameters were tested: cut and fill volume, carriageway value and roadway width. No statistically significant difference was found for any of the tested parameters between the methods. Total station and ALS-based designs showed the lowest values of cut and fill volumes, 2.41 m3 and 2.54 m3 for the total station design, and 3.20 m3 and 2.47 m3 for the ALS design. Although some deviations were found between SfM designs based on different flight parameters, they were not significant. The results indicate the possibility of using all tested methods in forest areas with steep terrain, after a salvage logging has been performed. Also, by using three design methods and testing their results provides guidance how to test different measurement systems in the future when designing forest roads.
Forest Road Design Based on Different Methods of Field Data Survey
Mihael Lovrinčević, Ivica Papa, Maja Popović, Luka Hodak, Tibor Pentek, Andreja Đuka
https://doi.org/10.5552/crojfe.2026.4567
Abstract
In today's modern forestry, which is founded on sustainable management and development, it is essential to carry out the design phase of forest roads with quality, both for financial and environmental reasons. The basis for this is high-quality field data. This research tested available and potentially suitable methods for field surveys in the process of designing a forest road, including the classical survey method, GNSS and total station survey, as well as structure from motion and airbone lidar scanning survey. A total of 23 forest road designs were created through 3 design methods. Four important forest road parameters were tested: cut and fill volume, carriageway value and roadway width. No statistically significant difference was found for any of the tested parameters between the methods. Total station and ALS-based designs showed the lowest values of cut and fill volumes, 2.41 m3 and 2.54 m3 for the total station design, and 3.20 m3 and 2.47 m3 for the ALS design. Although some deviations were found between SfM designs based on different flight parameters, they were not significant. The results indicate the possibility of using all tested methods in forest areas with steep terrain, after a salvage logging has been performed. Also, by using three design methods and testing their results provides guidance how to test different measurement systems in the future when designing forest roads.
Keywords: photogrammetry, theodolite, total station, LiDAR, UAV, forest accuracy, forest road, design, earthworks
1. Introduction
A well-planned and designed road enables the fulfilment of all road tasks, such as: wood transportation (Sessions et al. 2015), access to forest for management and conservation (Sessions 2007), fire protection (Laschi et al. 2019) and recreation (Ryan et al. 2004). Forest roads, as a special ecosystem (Lugo and Gucinski 2000), influence and change the area in which they are located (Borga et al. 2005, Boston 2016, Kastridis 2020, Borowski et al. 2021). In addition, they directly affect the cost of forest operations (Akay and Sessions 2001, Chung et al. 2008). For these reasons, it is essential to carry out the planning and design phase of a forest road with high quality. The basis is to understand the morphometric parameters of the terrain (Dražić et al. 2023), forest management type (Lyons et al. 2022), climate zone (Motlagh 2024) and high-precision spatial data of the area of interest (Aricak 2015).
According to Papa et al. (2017), two main survey methods are used for field survey of planned forest roads: classical and modern. Depending on the country or the method of data collection, the classical survey method uses a combination of different survey equipment: meridian clinometer, compass, theodolite, level and a measuring tape (Keller and Sherar 2003, Enache 2009, Douglas 2016, Papa et al. 2017), while modern survey method uses total station or GNSS (Global Navigation Satellite System) device (Papa et al. 2017). Although computer-aided design based on DTM (Digital Terrain Model) (for example, created based on LiDAR data) has been known to the profession for a long time (Pereira and Janssen 1999, Coulter et al. 2001), it is only with the increased availability of photogrammetric and lidar technology (primarily due to Unmanned Aerial Vehicles (UAV)) that these systems are slowly entering the forest road design process. Kınalı and Çalışkan (2022) compared forest road designs based on total station and SfM (Structure from Motion) survey from different flight heights (50, 75 and 100 m). The SfM flight height of 50 m design resulted in the smallest difference compared to the total station, with 0.27% less cut volume and 1.08% more fill volume. Taş et al. (2023) compared designs based on SfM, GNSS-GPS and total station data and found greater differences between the quantities of earthwork compared to Kınalı and Çalışkan (2022). Compared to the total station device, the SfM method resulted in 14.8% less cut and 9.03% less fill. In comparison to the GNSS device, it achieved 29.1% more cut and 17% less fill. Based on the GNSS device, compared to the total station, the project achieved 34% less cut volume and 9% more fill volume. Matinnia et al. (2018) conclude that lidar systems can be used in forest road design after determining an average cut and fill difference of 2.39 and 3.18 m³ for road 1, and 2.98 and 5.60 m³ for road 2, compared to a total station design. The authors confirm the claims of Contreras et al. (2012), who emphasise canopy cover density and terrain ruggedness as factors that can influence the accuracy of earthwork quantity calculations. While SfM and lidar surveys are used and accepted as an accurate measurement method for specific forest parameters (Açıl et al. 2023, García-Cimarras et al. 2023, Manase et al. 2025, Spiers et al. 2025), their applicability has not been sufficiently investigated in the design of forest roads, based on available literature. For this reason, in this research, SfM and lidar survey will be called the experimental survey method.
This research tested different field survey methods required for forest road design on a large number of road-cross sections. The tested parameters of the designed forest road were selected based on economic and environmental considerations: earthwork volumes (fill and cut), carriageway value and roadway (right of way) width. Earthwork amount directly affects forest road construction costs (Stückelberger et al. 2006) and can have significant environmental impacts, especially on soil erosion (Hacisalihoğlu et al. 2019) and nearby trees (Caliskan 2013). The carriageway value, defined as the difference between the road surface (wearing course) height and the ground height, is directly related to the cut and fill amount (Sokolović et al. 2015, Papa et al. 2023), and thus can have a significant economic and environmental impact. Although the width of the road, or the right of way, does not necessarily have much effect on the cost price, Zou et al. (2020) found that the width and shape of the road can lead to significant ecological changes, such as affecting the amount of biomass and soil pH.
2. Materials and Methods
2.1 Study Area and Data Collection
The study area is located in the Republic of Croatia in a forest area managed by the company Croatian Forests Ltd. (management unit Miletka, section 44c and section 44d). Due to a bark-beetle outbreak (Ips typographus)in 2016 and 2017, salvage logging was performed. After the salvage logging, the surface was partially covered with biomass (branches and plant parts) stacked in piles (Fig. 1A). The average terrain slope for the research area is 32.00%, placing it in the category of moderately steep terrain (Mellgren 1980). This terrain slope presents a challenge during road design and construction, as confirmed by Jeličić's (1975) terrain classification, which states that it is necessary to design and construct embankment benches for slopes between 20% and 50%. In addition to the slope, the terrain where the research was conducted is characterised by pronounced microrelief and terrain obstacles in the form of rocks (Fig. 1B).
For the research purposes, two (out of four) phases of the forest road optimal network establishment were carried out: the road planning and design (Ryan et al. 2004, Pentek et al. 2014). Several versions of the zero line were placed on a 1:25,000 scale map, and the best one was selected and transferred to the field. The maximum longitudinal slope used was 12%. Based on the selected zero line, the horizontal alignment of the forest road was defined in the field by 30 horizontal intersection points (IPH) (Fig. 1C).
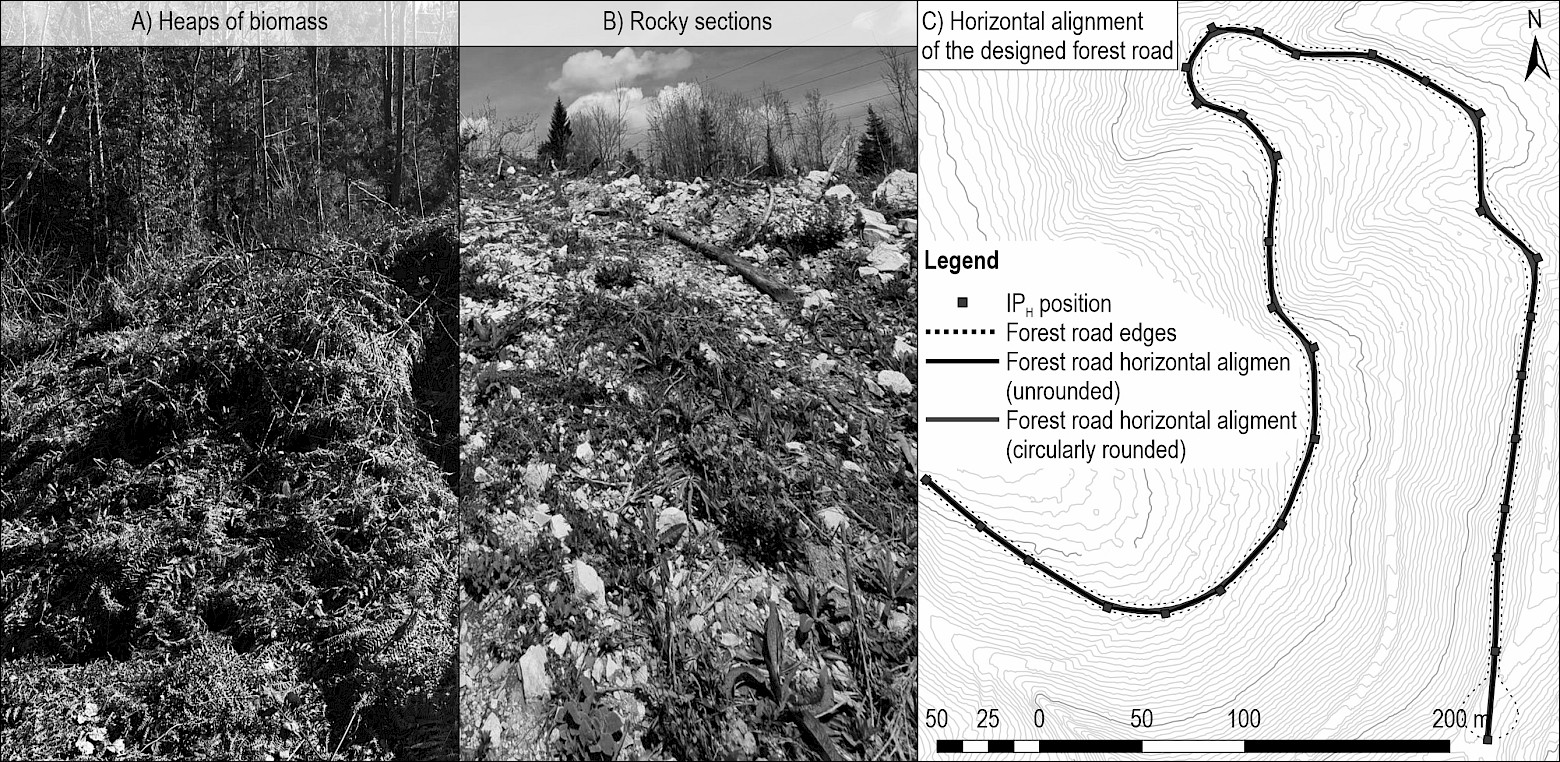
Fig. 1 A and B show field conditions during the research. Contour interval of 1 m
3 different survey methods were used for the field survey (Table 1):
- classical survey method (using theodolite, level, and geodetic rod)
- modern survey method (total station and GNSS device)
- experimental survey method (UAV equipped with RGB camera, Lidar data).
Classical (traditional) survey method, although in most cases replaced by modern survey method, is still in use in specific forest conditions (dense canopies of selected forests and regular forests under leaf-on condition or developed forest understory), where the use of a GNSS device or a total station is limited (Lee et al. 2023). As previous research has shown (Lovrinčević et al. 2025), a total station, which is an almost perfectly accurate instrument under optimal conditions, loses accuracy with frequent device movements. For that reason, a total station was not the reference method in this research. Field conditions for this research (salvage logging before data collection) allowed the GNSS device in RTK mode to be used as the reference method. The UAV survey (UAV SfM) was carried out at different flight altitudes and with the terrain follow option turned on or off. For the UAV SfM survey mission, conducted from a height of 70 meters with the terrain follow option enabled, automatic and manual classification of the point cloud, used for the creation of the digital terrain model (DTM), was carried out. Manual classification was done to remove (correct) parts of the terrain (DTM), which, due to the omission (caused by piles of biomass on the ground), were wrongly classified and included/excluded during the creation of the DTM. Lidar data tested in this research is the result of airborne lidar scanning (ALS) of the Republic of Croatia. Product specification (Anon. 2022) required a minimum of 4 points per m² for forest areas.
Table 1 Design cases based on survey method and selected parameters
|
Survey method |
Used equipment |
Important survey parameters |
Abbreviation * |
Additional explanation |
||
|
Classical |
Theodolite (Geomax ZIPP 02) Level (Sokkia C330) |
Number of device relocations: 28 (theodolite) 28 (level) |
FRC |
– |
||
|
Modern |
GNSS device (Stonex S900A) |
The device used in RTK mode the Croatian Positioning System (CROPOS) correction base |
FRGNSS |
– |
||
|
Total station (Stonex R35) |
Number of device relocations: 28 |
FRT |
– |
|||
|
Experimental |
UAV SfM (DJI Mavic 3 Enterprise with RTK correction) |
Flight height |
Terrain follow option |
– |
– |
|
|
60 |
No (UAV60NF) |
FR60NF |
– |
|||
|
70 |
No (UAV70NF) |
FR70NF |
– |
|||
|
70 |
Yes (UAV70F) |
FR70F |
– |
|||
|
70 |
Yes (UAV70MC) |
FR70MC |
Manual classification of the point cloud performed. UAV70F point cloud used |
|||
|
90 |
Yes (UAV90F) |
FR90F |
– |
|||
|
Lidar data (airborne lidar scanning (ALS) data from the Croatian Geodetic Administration) |
minimum horizontal accuracy ±0.2 m |
minimum height accuracy ±0.1 m |
FRALS |
The entire territory of the Republic of Croatia was recorded by ALS. Recording requirements are described in the product specification (Anon. 2022). Minimum of 4 points per m2 |
||
|
* For a design project based on different survey methods |
||||||
A detailed description of the data collection (survey) methodology and its spatial accuracy analysis is described in Lovrinčević et al. (2025).
2.2 Data Processing
Based on the collected data, a forest road engineering design project (In the following text, the term design was used) was created for each survey method using RoadEng software (v.10.0.664.0) (Fig. 2A). Horizontal and vertical alignment were identical for every survey method except for the classical survey method, due to a certain horizontal deviation (error), where the radii used for rounding of horizontal curves were adjusted so that the tangent length was the same as for other survey methods. Horizontal alignment consisted of straight sections and 28 circular curves. The value of the used radii (R) ranged between 16 m and 2400 m. The total road length was 860.9 m (8+60.90 hm). At the end of the road, a circular turning point was designed (10 m radius), as it is a road element that requires a large amount of earthwork. Vertical alignment was defined with 12 vertical intersection points (IPV), that is, 10 vertical curves, rounded by parabolas whose parabolic rate (K) ranged from 4.47 to 637.05. Road grade ranged from 3% to 12%. Average road grade was 7.91%. The typical cross-section, with all its elements, is shown in Fig. 3. The whole project was in accordance with the current technical requirements (specifications) for forest roads in the Republic of Croatia (Šikić et al. 1989, Anon. 2024).
As UAV SfM and lidar survey can result in larger amount of data (higher spatial resolution) (Dong and Chen 2017, Carrera-Hernández et al. 2020) than a total station or a GNSS survey, and distance between cross-sections affects the accuracy of earthwork volume calculations (Aruga et al. 2005), design projects were also made based on the extracted points of the UAV SfM and lidar data DTMs (Fig. 2B). Points were extracted at the locations of the GNSS survey. The Z values of the points were derived using the update feature Z function in ArcMap (v.10.8). The third method of testing the data involved extracted points, similar to the second method, but with corrected vertical alignment (Fig. 2C). Based on the positions of the vertical IPs from the GNSS design, the horizontal and vertical offset of the IPV from the nearest cross-section of interest was determined. For each method, corrected vertical IPVs were then set based on the established offsets. Cross sections of interest were placed on horizontal positions of the beginning of the curve (BC), end of the curve (EC), middle of the curve (MC) and sections where the distance between the EC of the previous curve and the BC of the next curve was greater than 15 m.
In total, 23 forest road designs were created based on 3 different design methods:
- Case A: forest road designs based on full data set, same horizontal and vertical alignment for all designs
- Case B: forest road designs based on extracted points, same horizontal and vertical alignment for all designs
- Case C: forest road designs based on extracted points, same horizontal alignment and corrected vertical alignment for each survey method.
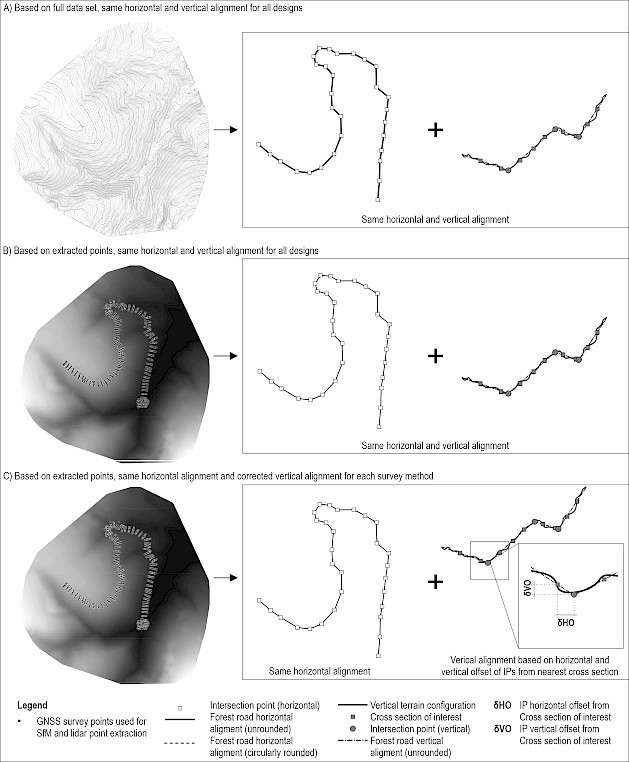
Fig. 2 Forest road design methods
After completing the design phase for each survey method, the following values were read, necessary for cost calculation, and the construction of the forest road (Swift 1988, Sokolović et al. 2015, Jaafari et al. 2021, Papa et al. 2023) (Fig. 3):
- Earthwork volumes (fill and cut), m 3
- Carriageway value, m
- Roadway (right of way) width, m
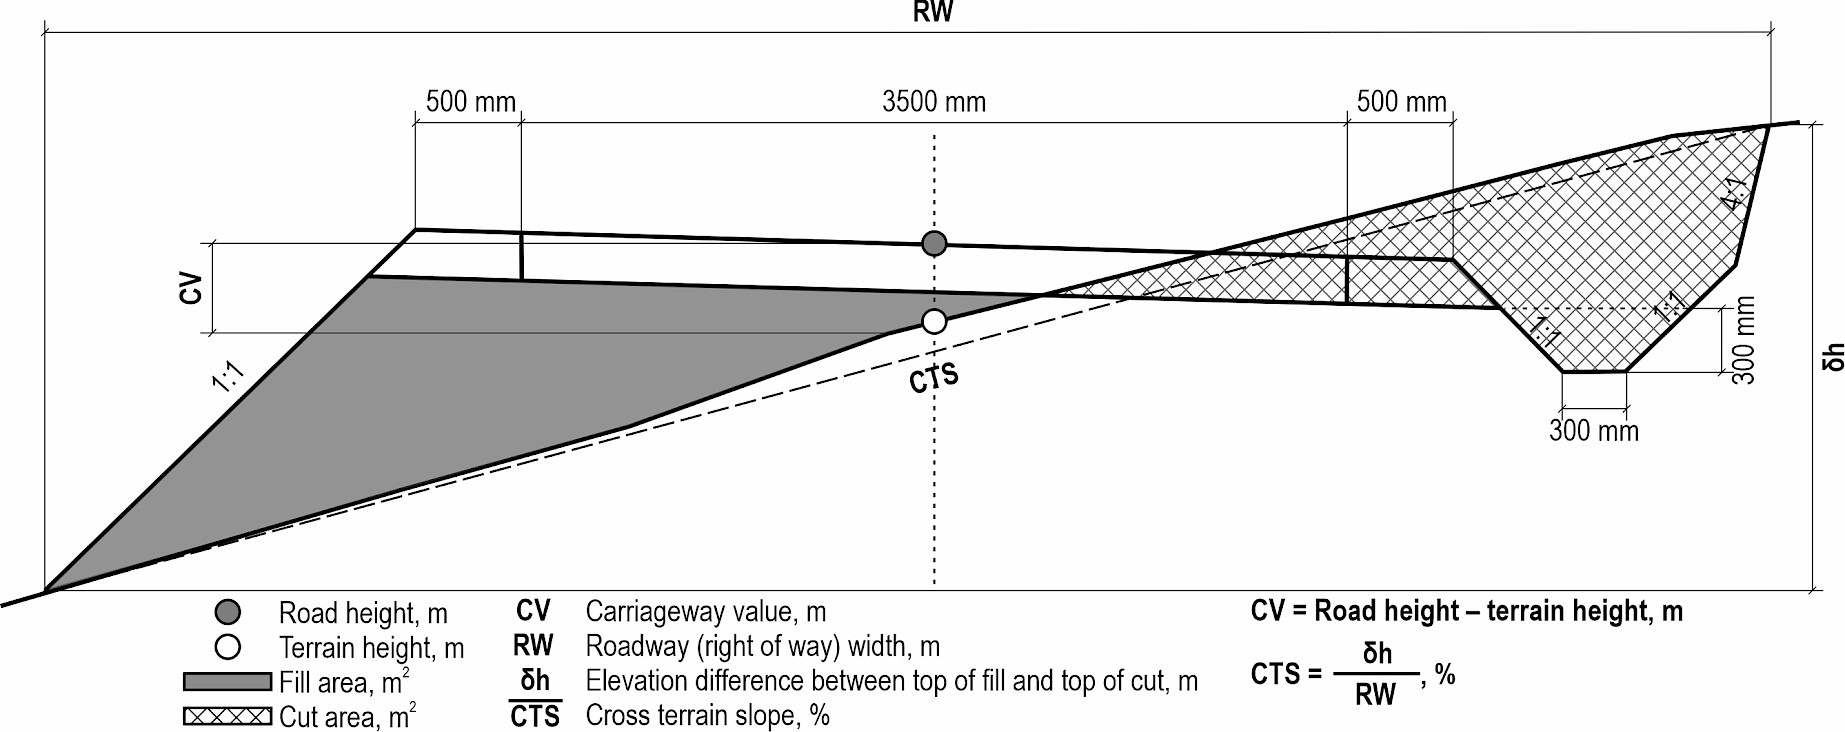
Fig. 3 Forest road cross-section with highlighted road parameters tested
In MS Excel, a database was created. Based on differences between the GNSS device (reference method) and other survey methods, root-mean-square error (RMSE) was calculated for the tested road parameters using the formula:

Where:
vd represents value difference
n represents number of observations.
Further statistical analysis was conducted using Statistica (v.14.0.0.15.) software. The Kolmogorov-Smirnov test was used to test data normality. Analysis of variance (ANOVA) was used to compare means between the survey methods, followed by a post hoc Tukey honest significant difference (HSD) test to identify which pairs of groups are statistically different.
3. Results
The results are presented based on the amount of field data used during the project design and on whether vertical alignment correction was performed.
3.1 Case A: Forest Road Designs Based on Full Data Set; Same Horizontal and Vertical Alignment
For this method of comparing survey methods, nine forest road designs were created, one for each survey method (Table 2). FRGNSS, based on GNSS survey, resulted in 3789.34 m3 and 2380.09 m3 of calculated cut and fill volumes. FR60NF achieved the most significant cut difference compared to FRGNSS, +832.30 m3, while FRT, FRC and FRALS achieved the lowest differences, –317.52 m3, –280.49 m3 and –300.77 m3, respectively. Cut volume RMSE for the mentioned designs was 8.99 m3, 7.08 m3 and 6.90 m3, with underestimated cut volumes. Designs based on SfM survey overcalculated cut volumes, resulting in cut volume RMSE from 12.13 m3 (FR60NF) to 9.13 m3 (FR70MC). Considering only one cross-section, the most significant difference was recorded between cross-sections 13 and 14, in the FR60NF design, in the amount of +34.39 m3. On the aforementioned cross-section, other SfM-based designs have made similar (large) errors, while the other methods recorded smaller errors: +12.31 m3 (FRT), –1.11 m3 (FRC), and +14.23 m3 (FRALS). The places where such larger errors were read are not related to the cut amount, since they were read at places of average cut amounts between cross sections (38.67 m3). In contrast to cut volumes, calculated fill volumes differed the least from the reference method for projects based on SfM survey, with a range from –378.69 m3 (FR60NF) to –195.80 m3 (FR70MC), with fill volume RMSE values ranging from 6.26 m3 to 5.00 m3, exceptFRC, which recorded the lowest fill volume RMSE (4.55 m3). All SfM survey-based designs underestimated fill volumes. FRALS achieved the most significant differences in calculated fill volumes and RMSE value, 629.26 m3 and 11.87 m3, respectively. FRALS also achieved the highest fill volume error between 2 cross sections in the amount of +51.27 m3 (between cross sections 30 and 31). In addition to FRALS, FRT and FRC also calculated more fill volume than FRGNSS. FRC achieved the closest accumulated volume value to the reference design (FRGNSS), with a surplus of 1026.23 m3, which is 383.02 less than the FRGNSS calculation. FR60NF recorded +85.93% more accumulated volume than FRGNSS.
Forest road designs based on survey methods that resulted in an underestimation of cut volume all had higher CV values than FRGNSS (where a positive value indicates that the road surface is above ground level). In comparison, SfM-based designs had smaller values than FRGNSS. FRALS, design with the most calculated fill volume, had an average CV of 0.37 m, while FRT had the highest CV RMSE value of 0.19 m. The highest error of this value was found in FRALS (+0.43 m), on cross-section 90.
The greatest average RW was observed in FRT, and consequently, the clearing area too. FRC had the highest RW RMSE (0.59 m), and FR70MC had the lowest (0.26 m). SfM-based designs calculated a smaller clearing area compared to FRGNSS.
Table 2 Descriptive statistics of parameters tested
|
|
FRGNSS (reference method) |
FRT |
FRC |
FR60NF |
FR70NF |
FR70F |
FR70MC |
FR90F |
FRALS |
|
Cut volume, m³ |
3789.34 |
3471.82 |
3508.85 |
4621.64 |
4572.90 |
4422.73 |
4366.87 |
4424.03 |
3488.57 |
|
Cut difference to FRGNSS, m³ |
/ |
–317.52 |
–280.49 |
832.30 |
783.56 |
633.39 |
577.52 |
634.69 |
–300.77 |
|
Cut volume RMSE, m³ |
/ |
8.99 |
7.08 |
12.13 |
11.67 |
9.86 |
9.13 |
10.07 |
6.90 |
|
Fill volume, m³ |
2380.09 |
2878.74 |
2482.62 |
2001.40 |
2066.52 |
2160.16 |
2184.28 |
2145.40 |
3009.34 |
|
Fill difference to FRGNSS, m³ |
/ |
498.66 |
102.54 |
–378.69 |
–313.56 |
–219.93 |
–195.80 |
–234.69 |
629.26 |
|
Fill volume RMSE, m³ |
/ |
9.83 |
4.55 |
6.26 |
5.90 |
5.24 |
5.00 |
5.29 |
11.87 |
|
Accumulated volume, m³ |
1409.26 |
593.08 |
1026.23 |
2620.24 |
2506.37 |
2262.58 |
2182.58 |
2278.63 |
479.23 |
|
Accumulated volume difference to FRGNSS, m³ |
/ |
–816.18 |
–383.02 |
1210.99 |
1097.12 |
853.32 |
773.33 |
869.38 |
–930.03 |
|
Average carriageway value, m |
0.24 |
0.34 |
0.30 |
0.12 |
0.13 |
0.17 |
0.18 |
0.17 |
0.37 |
|
Carriageway value RMSE, m |
/ |
0.19 |
0.11 |
0.15 |
0.15 |
0.11 |
0.10 |
0.12 |
0.17 |
|
Average roadway width, m |
9.46 |
9.58 |
9.38 |
9.38 |
9.40 |
9.40 |
9.41 |
9.37 |
9.57 |
|
Roadway width RMSE, m |
/ |
0.33 |
0.59 |
0.33 |
0.32 |
0.29 |
0.26 |
0.34 |
0.33 |
|
Clearing area, m² |
7733.06 |
7860.54 |
7697.93 |
7659.68 |
7677.52 |
7681.17 |
7689.02 |
7664.84 |
7855.27 |
|
Clearing area difference to FRGNSS, m² |
/ |
127.48 |
–35.14 |
–73.38 |
–55.54 |
–51.89 |
–44.04 |
–68.22 |
122.21 |
As previous research using this data (Lovrinčević et al. 2025) indicated an increase in spatial data error, recorded by the classical survey method and total station, with moving away from the forest road route start (with station increase), cut and fill RMSE values were calculated for every section (every 100 m), and with station increase (Fig. 4). The smallest cut RMSE values (Fig. 4A) were achieved for the forest road section from 4+00.00 hm to 4+99.99 hm, regardless of the survey method. In this section of the designed forest road, the embankment-shaped cross-section dominated. For all designs, except for FRC and FRALS, the highest cut RMSE was between station 1+00.00 hm and 1+99.99 hm. According to FRGNSS, the total amount of cut volume for this section was 293.018 m3, while the designs with high cut RMSE in this section were calculated to be around 400 m3. Cut and fill RMSE values calculated for slope classes indicated an increase in RMSE values with increasing cross slope for FRALS (Fig. A1). The number of cross-sections in each cross-terrain slope class is shown in Table A1. FRALS recorded maximum fill volume RMSE for section 7 (16.48 m3). SfM-based designs fill RMSE fluctuated between 1.87 m3 and 8.78 m3. Cut volume RMSE, after the initial increase, was stable for all survey methods (Fig. 4B). Analogous case is with fill volume RMSE, except for FRT, FRC and FRALS, which had a growing trend with station increase.
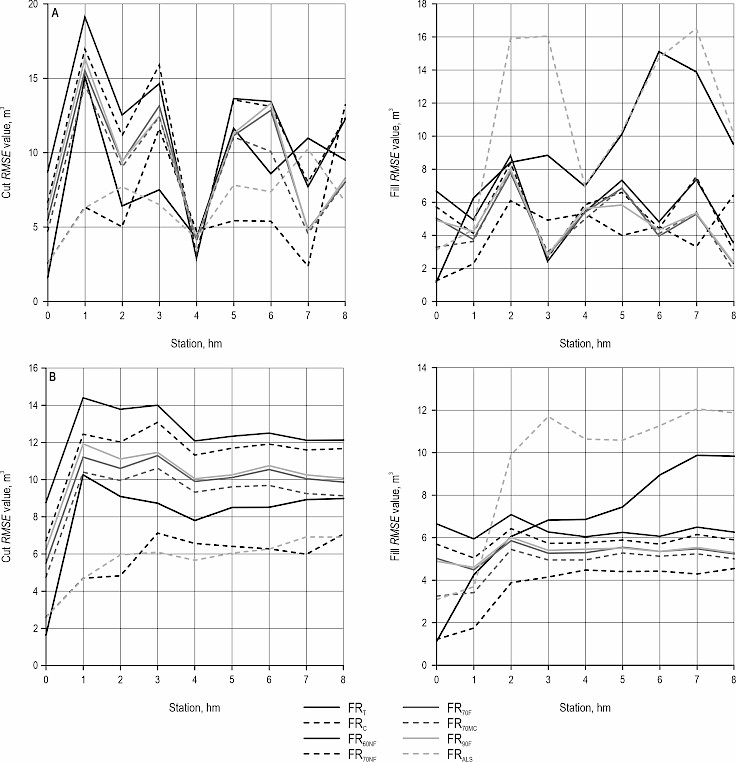
Fig. 4 RMSE values of cut and fill volumes based on full data sets designs of each method by station. A) represents the RMSE values for only one section of the designed forest road, for example, the station marked with 5 represents the section from station 5+00.00 hm to 5+99.99 hm. B) represents the RMSE values up to a certain station, for example, the station marked with 3 represents the RMSE values from 0+00.00 hm to 3+99.99 hm
ANOVA followed by Post hocTukey HSD (honestly significant difference) test found no statistically significant differences for tested parameters (Cut volume, Fill volume, CV and RW) between measuring methods (Fig. A2). Large data scatter was observed for cut, fill and CV values.
3.2 Case B: Forest Road Designs Based on Extracted Points; Same Horizontal and Vertical Alignment
Six forest road designs were created for this method of comparing survey methods, as FRGNSS, FRT, and FRC were already based on point data (Table 3). Using this data format, the calculated cut volumes decreased for forest road designs based on SfM data, while for FRALS, the cut volume increased (now 6% more cut volume than FRGNSS). For all methods for which a new design was created in this way, the RMSE value of the cut volume decreased. The most significant decrease in cut volume RMSE value was recorded for FRALS (now 3.97 m3), while the highest cut volume RMSE was recorded for FRT (8.99 m3). The most significant cut volume error for a single cross-section was recorded in FRC between cross-sections 97 and 98 (end of designed forest road) in the amount of –28.58 m3. The highest cut error recorded for the full data set design (FR60NF, cross section 13–14, +34.39 m3) decreased to +11.31 m3 with this design method. Total fill volume decreased for SfM and ALS-based designs, –10.42% (FR70F) and –6.40% (FRALS) compared to FRGNSS. All mentioned designs underestimated the fil volume. FRALS recorded the most significant decrease in fill volume compared to its full data set design (–780.78 m3) and the lowest fill volume RMSE compared to FRGNSS (2.30 m3). The highest error of fill volume was recorded between cross sections 76 and 77 in FRT (+32.99 m3). FR60NF resulted in the highest accumulated volume difference to GNSS (+73.98% more), while FRC and FRALS recorded the lowest, –27.12% and +29.01% respectively.
Minimal changes were determined for the average CV of designs based on the survey methods for which the new project was created, except for FRALS, whose RMSE decreased to 0.08 m, the lowest RMSE of the tested methods. The most significant CV error on a single cross-section was determined for FR70NF (cross-section 45, –0.33 m). In the mentioned cross-section, the fill error was –6.25 m3, and the cut volume was 0 m3 (as in other designs). FRT had the highest CV RMSE (0.19 m) and the most significant average RW (9.58 m). The average RW of FRT resulted in the largest clearing area, 1.65 % larger than calculated in FRGNSS.
Table 3 Descriptive statistics of parameters tested
|
|
FRGNSS |
FRT |
FRC |
FR60NF |
FR70NF |
FR70F |
FR70MC |
FR90F |
FRALS |
|
Cut volume, m³ |
3789.34 |
3471.82 |
3508.85 |
4398.357 |
4348.25 |
4191.96 |
4160.83 |
4218.47 |
4047.82 |
|
Cut difference to GNSS, m³ |
/ |
–317.52 |
–280.49 |
609.02 |
558.91 |
402.62 |
371.49 |
429.13 |
258.48 |
|
Cut volume RMSE, m³ |
/ |
8.99 |
7.08 |
8.21 |
7.64 |
5.79 |
5.27 |
6.19 |
3.97 |
|
Fill volume, m³ |
2380.09 |
2878.74 |
2482.62 |
1946.56 |
2006.74 |
2132.78 |
2130.65 |
2100.31 |
2228.56 |
|
Fill difference to GNSS, m³ |
/ |
498.66 |
102.54 |
–433.53 |
–373.34 |
–247.31 |
–249.43 |
–279.78 |
–151.53 |
|
Fill volume RMSE, m³ |
/ |
9.83 |
4.55 |
5.85 |
5.29 |
3.86 |
3.80 |
4.11 |
2.30 |
|
Accumulated volume, m³ |
1409.26 |
593.08 |
1027.05 |
2451.80 |
2341.51 |
2059.18 |
2030.18 |
2118.16 |
1819.26 |
|
Accumulated volume difference to GNSS, m³ |
/ |
–816.18 |
–382.20 |
1042.55 |
932.25 |
649.92 |
620.92 |
708.90 |
410.00 |
|
Average carriageway value, m |
0.24 |
0.34 |
0.30 |
0.12 |
0.14 |
0.17 |
0.18 |
0.17 |
0.20 |
|
Carriageway value RMSE, m |
/ |
0.19 |
0.11 |
0.15 |
0.14 |
0.10 |
0.10 |
0.12 |
0.08 |
|
Average roadway width, m |
9.46 |
9.58 |
9.38 |
9.36 |
9.39 |
9.41 |
9.41 |
9.37 |
9.43 |
|
Roadway width RMSE, m |
/ |
0.33 |
0.59 |
0.33 |
0.29 |
0.19 |
0.18 |
0.28 |
0.12 |
|
Clearing area, m² |
7733.06 |
7860.54 |
7697.93 |
7631.42 |
7650.50 |
7681.58 |
7678.53 |
7660.11 |
7698.41 |
|
Clearing area difference to GNSS, m² |
/ |
127.48 |
–35.14 |
–101.64 |
–82.56 |
–51.48 |
–54.53 |
–72.95 |
–34.65 |
The cut value RMSE for road segments of all designs showed the lowest values on the section from 4+00.00 to 4+99.99 hm (Fig. 5A). SfM and ALS-based designs recorded smaller RMSE values across all sections compared to SfM and ALS designs based on full data sets. The highest cut RMSE values for the mentioned designs were recorded on the section from 1+00.00 hm to 1+99.99 hm. Fill volume RMSE of FRT, except stations 4, 7 and 8, increased with moving away from the road start (Fig. 5B). Except for FRT, after the initial sharp increase in RMSE (cut and fill) values, no design showed a larger change (Fig. 5B). All designs showed lower RMSE cut values with cross-section slope increase, except FRT, which did not show any trend or correlation (Fig. A3A). On the other hand, only FRT showed an increasing fill volume RMSE value with cross-section increase, while other designs did not show any trend (Fig. A3B).
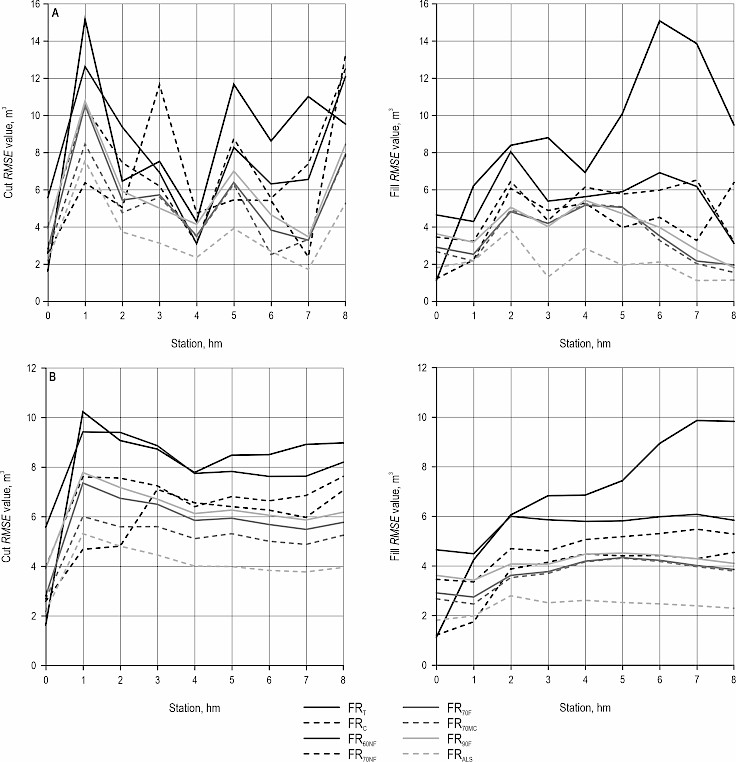
Fig. 5 RMSE values of cut and fill volumes based on extracted points designs of each method by station. A) represents the RMSE values for only one section of the designed forest road, for example, the station marked with 6 represents the section from station 6+00.00 hm to 6+99.99 hm. B) represents the RMSE values up to a certain station, for example, the station marked with 4 represents the RMSE values from 0+00.00 hm to 4+99.99 hm
As with designs based on the full dataset, ANOVA showed no statistically significant difference between the calculated parameters of designs based on the used survey methods (Fig. A4). Observed trends were the same as for designs based on full data sets.
3.3 Case C: Forest Road Designs Based on Extracted Points; Same Horizontal Alignment, Corrected Vertical Alignment
In total, eight new designs were created for this design method. As can be seen from Table 4, a reduction in cut difference to FRGNSS was recorded for all created designs. Except for FRC, all designs overestimated cut volume. The total amount of cut volume of FR60NF differed the least from FRGNSS (+0.02%). FR70MC recorded the highest cut RMSE compared to other designs based on the SfM survey. Compared to FR70F, cut volume of FR70MC was 135.36 m3 higher. The lowest cut volume RMSE was recorded for FRT (2.41 m3), and the highest for FRC (5.68 m3), which also recorded the highest cut error between cross sections (21.51 m3, cross sections 37–38). FRALS recorded the lowest difference in total fill volumes (+0.04%) and fill volume RMSE (2.47 m3) of all designs based on experimental survey methods. Between cross sections 86 and 87 in FRC, the highest fill error was recorded (–17.26 m3). After this additional vertical alignment correction, all designs recorded lower accumulated volume differences compared to FRGNSS; FR60NF recorded the lowest (–0.05%) and FR70MC the highest (+18.58%).
FRT recorded the lowest CV RMSE, and also the most significant change in its value compared to previous design methods. The highest error of CV was recorded in FR70NF (cross section 73, CV error = +0.43 m). In the mentioned cross-section, the cut error was –1.81 m3, and the fill error was +1.83 m3. Except for FR70MC, designs based on experimental survey methods resulted in higher average CV values.
FRC designed by this method recorded the highest RW RMSE of all designs, regardless of the design or survey method (0.60 m).
Table 4 Descriptive statistics of parameters tested
|
FRGNSS |
FRT |
FRC |
FR60NF |
FR70NF |
FR70F |
FR70MC |
FR90F |
FRALS |
|
|
Cut volume, m³ |
3789.34 |
3886.12 |
3626.91 |
3798.24 |
3815.58 |
3815.29 |
3950.65 |
3881.37 |
3842.20 |
|
Cut difference to GNSS, m³ |
/ |
96.78 |
–162.43 |
8.90 |
26.24 |
25.95 |
161.31 |
92.03 |
52.86 |
|
Cut volume RMSE, m³ |
/ |
2.41 |
5.68 |
3.90 |
3.72 |
4.31 |
4.07 |
4.41 |
3.20 |
|
Fill volume, m³ |
2380.09 |
2378.06 |
2372.57 |
2395.32 |
2418.03 |
2425.84 |
2279.55 |
2355.12 |
2391.46 |
|
Fill difference to GNSS, m³ |
/ |
–2.02 |
–7.51 |
15.23 |
37.94 |
45.75 |
–100.53 |
–24.97 |
11.38 |
|
Fill volume RMSE, m³ |
/ |
2.54 |
9.00 |
4.06 |
4.56 |
3.41 |
2.73 |
3.87 |
2.47 |
|
Accumulated volume, m³ |
1409.26 |
1508.06 |
1254.34 |
1402.92 |
1397.56 |
1389.45 |
1671.10 |
1526.25 |
1450.74 |
|
Accumulated volume difference to GNSS, m³ |
/ |
98.80 |
–154.92 |
–6.33 |
–11.70 |
–19.81 |
261.85 |
117.00 |
41.48 |
|
Average carriageway value, m |
0.24 |
0.23 |
0.28 |
0.26 |
0.26 |
0.26 |
0.23 |
0.25 |
0.25 |
|
Carriageway value RMSE, m |
/ |
0.03 |
0.09 |
0.10 |
0.11 |
0.09 |
0.08 |
0.10 |
0.08 |
|
Average roadway width, m |
9.46 |
9.48 |
9.36 |
9.47 |
9.47 |
9.47 |
9.42 |
9.44 |
9.47 |
|
Roadway width RMSE, m |
/ |
0.11 |
0.60 |
0.26 |
0.27 |
0.18 |
0.20 |
0.19 |
0.12 |
|
Clearing area, m² |
7733.06 |
7750.09 |
7676.39 |
7744.00 |
7749.53 |
7745.90 |
7695.92 |
7722.55 |
7735.38 |
|
Clearing area difference to GNSS, m² |
/ |
17.03 |
–56.67 |
10.94 |
16.47 |
12.84 |
–37.14 |
–10.51 |
2.32 |
Designs based on SfM and ALS achieved larger jumps in cut volume RMSE values at the same station (section), while this is not the case for those based on the classical and total station survey method (Fig. 6A). Of all designs, FRC achieved the highest cut RMSE for section 3 (10.38 m3). Section 1 (from 1+00.00 hm to 1+99.99 hm), section 6 and section 8 were sections where most designs recorded high cut RMSE values. Only in section 8, a higher amount of cut volume was recorded (718.39 m3). Most designs recorded the highest fill volume RMSE in section 7. In section 7, a higher amount of cut and fill volume was calculated: 605.83 m3 for cut and 462.92 m3 for fill, respectively. Like in designs made with previously used design methods, cut volume RMSE was stable after an initial jump in section 1 (Figure 6B).
In contrast to the cut volume RMSE, the fill volume RMSE showed an increasing trend with moving away from the beginning of the forest road. This trend was most pronounced for FRC. Analysing RMSE values based on cross-section slope classes, no clear trend can be seen for either cut or fill RMSE for any design (Fig. A5).
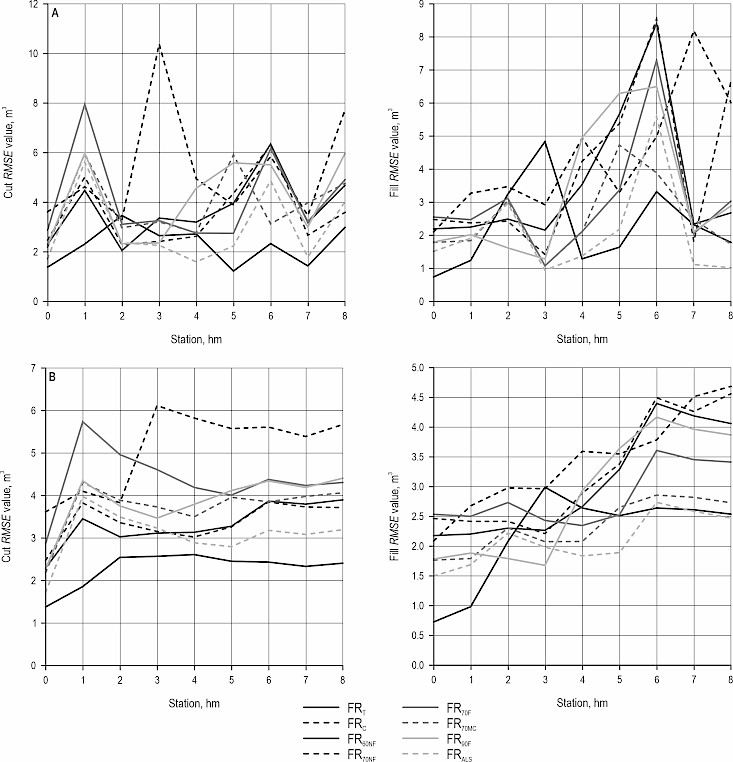
Fig. 6 RMSE values of cut and fill volumes based on extracted points and corrected vertical alignment designs of each method by station. A) represents the RMSE values for only one section of the designed forest road, for example, the station marked with 1 represents the section from station 1+00.00 hm to 1+99.99 hm. B) represents the RMSE values up to a certain station, for example, the station marked with 7 represents the RMSE values from 0+00.00 hm to 7+99.99 hm
Finally, like with other design methods, ANOVA showed no statistically significant difference between the calculated parameters of designs based on the used survey methods (Fig. A6).
4. Discussion
As many countries still have low forest road density (Hodić and Jurušić 2011, Bilici and Akay 2021, Grajewski 2022, Lyons et al. 2023), and since the classical and modern method of field survey in forest road design is time and human-intensive, it is necessary to find an accurate and fast field survey method. In this article, all available and potentially suitable survey methods for field survey in the process of designing a forest road were tested. Nine different field surveys by five survey methods/devices were conducted. Collected field data were tested with three different design methods as experimental methods (SfM and ALS) were much bigger data sets (with higher spatial resolution (Dong and Chen 2017, Carrera-Hernández et al. 2020,)) and because, due to minor differences in the overall horizontal length of the designs, an error could have been caused by misaligned vertical alignment. In total, 23 forest road designs were created.
Case A – Forest road designs based on full data set; same horizontal and vertical alignment
Even though ANOVA showed no statistically significant difference for cut and fill volumes of forest road designs based on the full data set with the same horizontal and vertical alignment, between FRGNSS and other methods (Fig. A2), high cut and fill volume RMSEs were recorded (Table 2). This can be explained by a large scatter of data. SfM designs overestimated cut volumes and underestimated fill volumes compared to FRGNSS. The reason for this can be the fact that Z coordinate values of terrain obtained from SfM survey are constantly higher (with few exceptions), as shown in Lovrinčević et al. (2025). On the contrary, FRALS design underestimated cut volumes and overestimated fill volumes. In the mentioned research, ALS data had constantly lower Z coordinate values. SfM and ALS design results obtained from this design method are not in accordance with similar results of other authors (Matinnia et al. 2018, Kınalı and Çalışkan 2022, Taş et al. 2023), where differences in earthwork volumes were smaller when compared to designs based on total station or GNSS survey. It must be noted that the mentioned research used different design methodologies (horizontal and vertical alignment of the designed forest roads were not exactly the same between the survey methods), and that more field survey points were collected with GNSS and a total station. Analysis of the cut and fill volumes RMSE in relation to slope class revealed an increase in the RMSE of cut and fill values with increasing slope for FRALS, and RMSE of fill values for FRT (Fig. A1). Although this finding may be significant, there is an insufficient amount of data to draw firm conclusions (Table A1), and this trend was lost with designs created with other design methods. It would be essential to explore this in future research, as previous studies (Su and Bork 2006, Tinkham et al. 2012) have shown an increase in spatial inaccuracy of lidar scanning with increasing terrain slope. No clear relations between the total cut or fill amount between cross sections and the cut or fill error between them were found.
Case B – Forest road designs based on extracted points; same horizontal and vertical alignment
Error reduction of the parameters tested after creating new designs based on extracted points, with same horizontal and vertical alignment, points out that part of the error of the designs created with first design method is caused by the higher spatial resolution of field data (DTMs based on the SfM and ALS survey), and not only by the error of the mentioned measurement equipment/methods. The fact that SfM designs, again, overestimated cut volumes and underestimated fill volumes compared to FRGNSS, confirms that higher Z values of SfM terrain points are the reason for a part of recorded errors, while lower Z values are the reason for fill volume overestimation and cut volume underestimation in FRALS. SfM recorded higher Z coordinate RMSE values in section 4 (Lovrinčević et al. 2025), but that did not affect the results of tested designs. Even though the previously mentioned research showed that the spatial error of the classical survey method and the total station is increasing with station increase, it did not affect the cut or fill RMSE of the mentioned survey methods, with the exception of fill values from FRT.
Case C – Forest road designs based on extracted points; same horizontal alignment, corrected vertical alignment
Although the CV values were not statistically significantly different between the survey methods, for all design methods, only after creating projects with vertical alignment correction, the average CV values were approximately equal to the average CV value of FRGNSS. This can explain the reduction in cut and fill volume error. Higher SfM design cut volume RMSE values on section 1 (Fig. 6A) can be explained by biomass recorded on the ground. As can be seen from Fig. 6B, the fill volume RMSE had an increasing tendency with station increase. The seemingly increasing trend in the fill volume RMSE of the SfM design is due to high values in section 6. A higher amount of fill volume was the reason for the high RMSE value. Errors were caused by Z coordinate error of SfM surveys (except for DTM based on manual classification) that was up to –0.50 m. The FRT increase in fill volume RMSE with station increase was eliminated using this design method. As in other design methods, no clear connection was found between the earthwork error and the slope or the amount of cut/fill. Recorded horizontal offset of classical survey method and total station (Lovrincevic et al. 2025), did not affect the results of designs based on their field data.
The research confirmed the claim by Pereira and Janssen (1999) that a DTM created from lidar data with an average density of 4 points per m2 is sufficient for the design of forest roads. Even though the earthwork errors recorded in SfM were greater than those in the research by Kınalı and Çalışkan (2022) and Taş et al. (2023), we agree that SfM can be used in forest road design in areas like the one tested.
No significant differences were found for RW between the survey methods used, regardless of the design method.
5. Conclusions
Based on the research conducted, the following conclusions can be drawn:
- testing of different measurement systems used for forest road design should be conducted at multiple levels, considering both spatial resolution and the design of the forest road
- survey methods used so far (a classical survey method (theodolite, level) and a total station) are accurate enough for designing 1 km long forest roads, although they lose spatial accuracy with an increased number of device movements (Lovrinčević et al. 2025). Horizontal offset does not affect the design phase, but can potentially affect construction
- in field conditions like those encountered during this research, the SfM survey provides sufficiently accurate field data for forest road design. Flight altitude and terrain follow function, which affected spatial accuracy (Table A2), did not have a significant impact on the results obtained. Also, the manual classification of the point cloud that was carried out for creating the DTM for the FR70MC did not significantly affect the accuracy of the design
- ALS provides accurate field data for designing forest roads in tested terrain conditions
- future research on the application of SfM survey should be conducted in different relief areas and outside the vegetation period (leaf-off condition), as a closed canopy prevents obtaining a realistic representation of the terrain
- future research on lidar systems needs to be conducted in different relief areas and both during and outside the vegetation season
- it is necessary to encourage the use of systems such as SfM and lidar scanning as they provide higher spatial resolution data and allow larger area survey, which ultimately enables and empowers additional analyses that can be useful in forest road designs, such as watershed analysis. The result of such a design can be a combination of environmental protection and human needs.
Acknowledgments
The authors thank the University of Zagreb, Faculty of Forestry and Wood Technology for their support during this research.
6. References
Açıl, A., Aydın, A., Eker, R., Duyar, A., 2023: Use of UAV data and HEC-RAS model for dimensioning of hydraulic structures on forest roads. Croat. J. For. Eng. 44(1): 171–188. https://doi.org/10.5552/crojfe.2023.1701
Akay, A., Sessions, J., 2001: Minimizing road construction plus forwarding costs under a maximum soil disturbance constraint. Proceedings of the The International Mountain Logging and 11th Pacific Northwest Skyline Symposium, Seattle, Washington, United States of America, December 10–12, 268–279 p.
Anon., 2022: Specifikacija Proizvoda, LiDAR Snimanje iz Zraka; Republika Hrvatska, State Geodetic Administration Republic of Croatia: Zagreb, Croatia, 1–50 p.
Anon., 2024: Pravilnik o provedbi intervencije 73.08. »Izgradnja šumske infrastrukture« iz Strateškog plana Zajedničke poljoprivredne politike Republike Hrvatske 2023.–2027.; NN 90/2024; Government of Croatia: Zagreb, Croatia.
Aricak, B., 2015: Using remote sensing data to predict road fill areas and areas affected by fill erosion with planned forest road construction: A case study in Kastamonu Regional Forest Directorate (Turkey). Environ. Monit. Assess. 187(7): 417. https://doi.org/10.1007/s10661-015-4663-7
Aruga, K., Sessions, J., Akay, A.E., 2005: Application of an airborne laser scanner to forest road design with accurate earthwork volumes. J. For. Res. 10(2): 113–123. https://doi.org/10.1007/s10310-004-0116-9
Bilici, E., Akay, A.E., 2021: Forestry and forest operations in Turkey: challenges and developments. Rev. Padurilor. 136(1): 1–16.
Borga, M., Tonelli, F., Dalla Fontana, G., Cazorzi, F., 2005: Evaluating the influence of forest roads on shallow landsliding. Ecol. Model. 187(1): 85–98. https://doi.org/10.1016/j.ecolmodel.2005.01.055
Borowski, Z., Bartoń, K., Gil, W., Wójcicki, A., Pawlak, B., 2021: Factors affecting deer pressure on forest regeneration: The roles of forest roads, visibility and forage availability. Pest Manag. Sci. 77(2): 628–634. https://doi.org/10.1002/ps.6207
Boston, K., 2016: The Potential Effects of Forest Roads on the Environment and Mitigating their Impacts. Curr. For. Rep. 2(4): 215–222. https://doi.org/10.1007/s40725-016-0044-x
Caliskan, E., 2013: Environmental impacts of forest road construction on mountainous terrain. Iran. J. Environ. Health Sci. Eng. 10(1): 23. https://doi.org/10.1186/1735-2746-10-23
Carrera-Hernández, J.J., Levresse, G., Lacan, P., 2020: Is UAV-SfM surveying ready to replace traditional surveying techniques?. Int. J. Remote Sens 41(12): 4820–4837. http://doi.org/10.1080/01431161.2020.1727049
Chung, W., Stückelberger, J., Aruga, K., Cundy, T.W., 2008: Forest road network design using a trade-off analysis between skidding and road construction costs. Can. J. For. Res. 38(3): 439–448. https://doi.org/10.1139/X07-170
Contreras, M.A., Aracena, P., Chung, W., 2012: Improving accuracy in earthwork volume estimation for proposed forest roads using a high-resolution digital elevation model. Croat. J. For. Eng. 33(1): 125–134.
Coulter, E., Chung, W., Akay, A., Sessions, J., 2001: Forest road earthwork calculations for linear road segments using a height resolution digital terrain model generated from LiDAR data. Proceedings of the First International Precision Forestry Symposium, Seattle, Washington, United States of America, June 17–20, 125–129 p.
Dong, P., Chen, Q., 2017: LiDAR remote sensing and applications. 1st ed.; CRC Press: Boca Raton, United States of America; 1–10 p. https://doi.org/10.4324/9781351233354
Douglas, R.A., 2016: Low-Volume Road Engineering: Design, Construction, and Maintenance. 1st ed.; CRC Press: Boca Raton, United States of America, 14 p. https://doi.org/10.1201/b19036
Dražić, S., Danilović, M., Ristić, R., Stojnić, D., Antonić, S., 2023: Evaluation of morphometric terrain parameters and their influence on determining optimal density of primary forest road network. Croat. J. For. Eng. 44(2): 301–312. https://doi.org/10.5552/crojfe.2023.2097
Enache, A., 2009: Elaboration of a forest road network in Trauch forest district, Wittgenstein forest administration, Hohenberg, Austria. Master Thesis, The University of Natural Resources and Life Sciences, Vienna, Austria.
García-Cimarras, A., Manzanera, J.A., Valbuena, R., 2023: LiDAR scan density and spatial resolution effects on vegetation fuel type mapping. Croat. J. For. Eng. 44(1): 189–201. https://doi.org/10.5552/crojfe.2023.1689
Grajewski, S.M., 2022: Forest road engineering in Poland: current status and development perspectives. SYLWAN 166(2): 123–140. https://doi.org/10.26202/sylwan.2022006
Hacisalihoğlu, S., Gümüş, S., Kezik, U., Karadag, H., 2019: Impact of forest road construction on topsoil erosion and hydro-physical soil properties in a semi-arid mountainous ecosystem in Turkey. Polish Int. J. Environ. Stud. 28(1): 113–121. https://doi.org/10.15244/pjoes/81615
Hodić, I., Jurušić, Z., 2011: Analysis of Primary Opennes of Forest Managed by Hrvatske Šume Ltd. as Basis for Disigning of Future Policy Forest Roads Construction. Šumar. list. 135(9–10): 487–499.
Jaafari, A., Pazhouhan, I., Bettinger, P., 2021: Machine learning modeling of forest road construction costs. Forests 12(9): 1169. https://doi.org/10.3390/f12091169
Jeličić, V., 1975: Korištenje dozera na izgradnji šumskih puteva. Doctoral thesis, Šumarski fakultet Univerziteta u Sarajevu, Sarajevo, Yugoslavia.
Kastridis, A., 2020: Impact of forest roads on hydrological processes. Forests 11(11): 1201. https://doi.org/10.3390/f11111201
Keller, G., Sherar, J., 2003: Low-volume roads engineering: Best management practices field guide, 1st ed; Conservation Management Institute, Virginia Polytechnic Institute and State University: Blacksburg, United States of America, 23 p.
Kınalı, M., Çalışkan, E., 2022: Use of unmanned aerial vehicles in forest road projects. BAROFD 24(3): 530–541. https://doi.org/10.24011/barofd.1073229
Laschi, A., Foderi, C., Fabiano, F., Neri, F., Cambi, M., Mariotti, B., Marchi, E., 2019: Forest road planning, construction and maintenance to improve forest fire fighting: a review. Croat. J. For. Eng. 40(1): 207–219.
Lee, T., Bettinger, P., Merry, K., Cieszewski, C., 2023: The effects of nearby trees on the positional accuracy of GNSS receivers in a forest environment. PLoS One 18(3): e0283090. https://doi.org/10.1371/journal.pone.0283090
Lovrinčević, M., Papa, I., Janeš, D., Hodak, L., Pentek, T., Đuka, A., 2025: New Possibilities of Field Data Survey in Forest Road Design. Sensors 25(13): 4192. https://doi.org/10.3390/s25134192
Lugo, A.E., Gucinski, H., 2000: Function, effects, and management of forest roads. For. Ecol. Manag. 133(3): 249–262. https://doi.org/10.1016/S0378-1127(99)00237-6
Lyons, C.K., Borz, S.A., Harvey, C., Ramantswana, M., Sakai, H., Visser, R., 2022: Forest roads: regional perspectives from around the world. Int. J. For. Eng. 34(2): 190–203. https://doi.org/10.1080/14942119.2022.2160916
Manase, A., Manyevere, A., Abd Elbasit, M.A., Mashamaite, C., 2025: The use of UAV-based systems in monitoring forest health: Potentials and challenges. Sci. Afr. 28: e02724. https://doi.org/10.1016/j.sciaf.2025.e02724
Matinnia, B., Parsakhoo, A., Mohamadi, J., Jouibary, S.S., 2018: Study of the LiDAR accuracy in mapping forest road alignments and estimating the earthwork volume. Sci. Afr. 64(11): 469–477. https://doi.org/10.17221/87/2018-JFS
Mellgren, P.G., 1980: Terrain Classification for Canadian Forestry, 1st ed.; FERIC, Canadian Pulp and Paper Association: Montreal, QC, Canada, 1–13 p.
Motlagh, A.R., Parsakhoo, A., Najafi, A., Mohammadi, J., 2024: Development of a Sustainable Maintenance Strategy for Forest Road Wearing Courses in Different Climate Zones. Croat. J. For. Eng. 45(1): 139–156. http://doi.org/10.5552/crojfe.2024.2216
Papa, I., Pentek, T., Janeš, D., Šerić, T., Vusić, D., Đuka, A., 2017: Usporedba podataka prikupljenih različitim metodama terenske izmjere pri rekonstrukciji šumske ceste. Nova meh. šumar. 38(1): 1–14.
Papa, I., Picchio, R., Lovrinčević, M., Janeš, D., Pentek, T., Validžić, D., Venanzi, R., Đuka, A., 2023: Factors Affecting Earthwork Volume in Forest Road Construction on Steep Terrain. Land 12(2): 400. https://doi.org/10.3390/land12020400
Pereira, L.G., Janssen, L.L.F., 1999: Suitability of laser data for DTM generation: a case study in the context of road planning and design. ISPRS J. Photogramm. Remote Sens. 54(4): 244–253. https://doi.org/10.1016/S0924-2716(99)00018-0
Ryan, T., Phillips, H., Ramsay, J., Dempsey, J., 2004: Forest Road Manual: Guidelines for the Design, Construction and Management of Forest Roads, 1st ed.; COFORD: Dublin, Ireland.
Sessions, J., Heinrich, R., Castaneda-Langlois, H., 2016: Forest road engineering. In Tropical Forestry Handbook, 2nd ed.; Pancel, L., Köhl, M., Eds; Springer: Berlin, Heidelberg, Germany; 1635–1685 p. https://doi.org/10.1007/978-3-642-41554-8_162-1
Sokolović, D., Bajrić, M., 2015: Volumen zemljanih radova pri izgradnji šumskih cesta na strmim terenima. Nova meh. šumar. 36(1): 33–42.
Spiers, A.I., Scholl, V.M., McGlinchy, J., Balch, J., Cattau, M.E., 2025: A review of UAS-based estimation of forest traits and characteristics in landscape ecology. Landsc. Ecol. 40(2): 29. https://doi.org/10.1007/s10980-024-01991-0
Stückelberger, J.A., Heinimann, H.R., Burlet, E.C., 2006: Modeling spatial variability in the life-cycle costs of low-volume forest roads. Eur. J. For. Res. 125(4): 377–390. https://doi.org/10.1007/s10342-006-0123-9
Su, J., Bork, E., 2006: Influence of vegetation, slope, and lidar sampling angle on DEM accuracy. Photogramm. Eng. Remote Sensing 72(11): 1265–1274. https://doi.org/10.14358/PERS.72.11.1265
Swift, L.W., 1988: Forest Access Roads: Design, Maintenance, and Soil Loss. In: Swank, W.T., Crossley, D.A. (eds) Forest Hydrology and Ecology at Coweeta. Ecol. Stud. 66(1): 313–324. https://doi.org/10.1007/978-1-4612-3732-7_23
Šikić, D., Babić, B., Topolnik, D., Knežević, I., Božičević, D., Švabe, Ž., Piria, I., Sever, S., 1989: Tehnički uvjeti za gospodarske ceste, 1st ed.; Znanstveni savjet za promet Jugoslavenske akademije znanosti i umjetnosti: Zagreb, Yugoslavia, 1–78 p.
Taş, İ., Kaska, M.S., Akay, A.E., 2023: Assessment of using UAV photogrammetry based DEM and ground-measurement based DEM in computer-assisted forest road design. Eur. J. For. Eng. 9(1): 1–9. https://doi.org/10.33904/ejfe.1312514
Tinkham, W.T., Smith, A.M., Hoffman, C., Hudak, A.T., Falkowski, M.J., Swanson, M.E., Gessler, P.E., 2012: Investigating the influence of LiDAR ground surface errors on the utility of derived forest inventories. Can. J. For. Res. 42(3): 413–422. https://doi.org/10.1139/x11-193
Zhou, T., Luo, X., Hou, Y., Xiang, Y., Peng, S., 2020: Quantifying the effects of road width on roadside vegetation and soil conditions in forests. Landsc. Ecol. 35(1): 69–81. https://doi.org/10.1007/s10980-019-00930-8
Appendix A
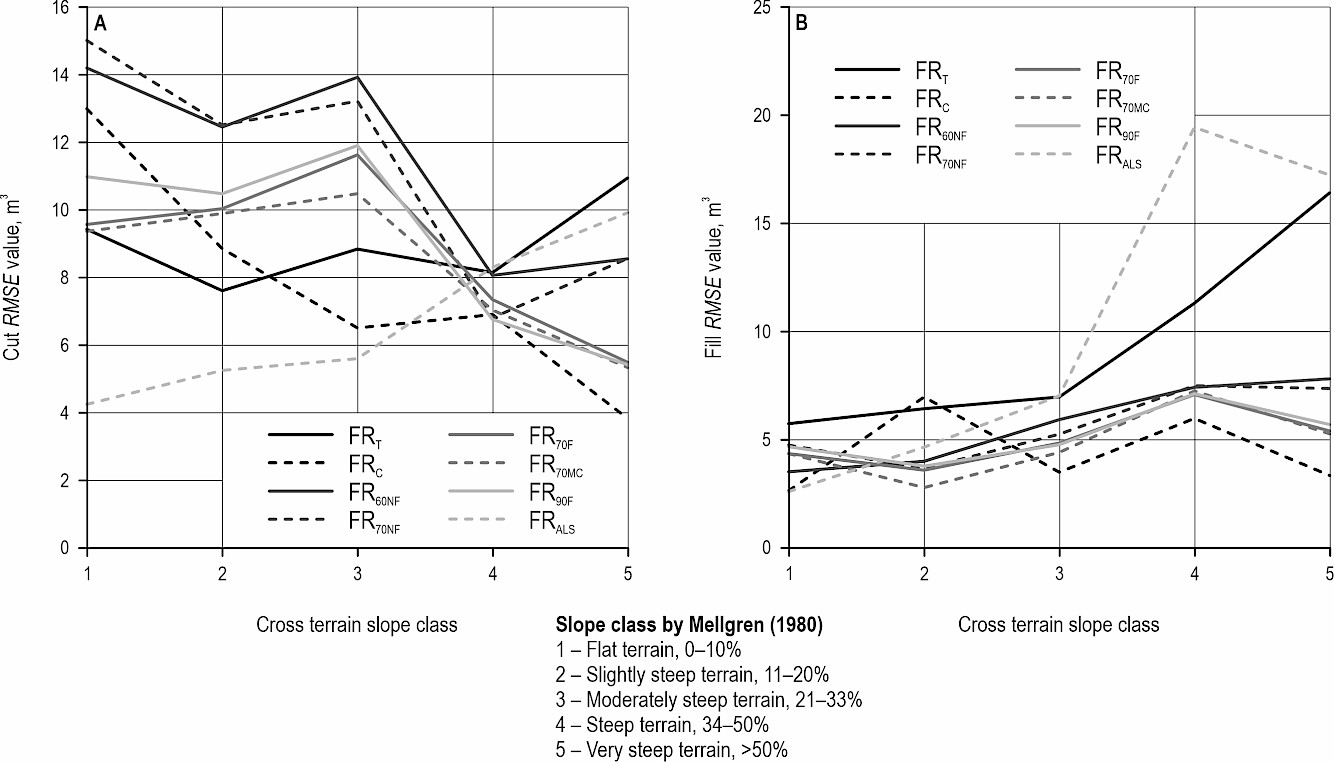
Fig. A1 Cut (A) and Fill (B) RMSE values by cross terrain slope classes. Forest road designs based on full data set; same horizontal and vertical alignment
Table A1 Number of cross sections by cross terrainslope classes
|
Slope class |
Mellgren (1980) |
Number of cross sections in class |
|
1 |
Flat terrain, 0–10% |
5 |
|
2 |
Slightly steep terrain, 11–20% |
13 |
|
3 |
Moderately steep terrain, 21–33% |
47 |
|
4 |
Steep terrain, 34–50% |
17 |
|
5 |
Very steep terrain, >50% |
16 |
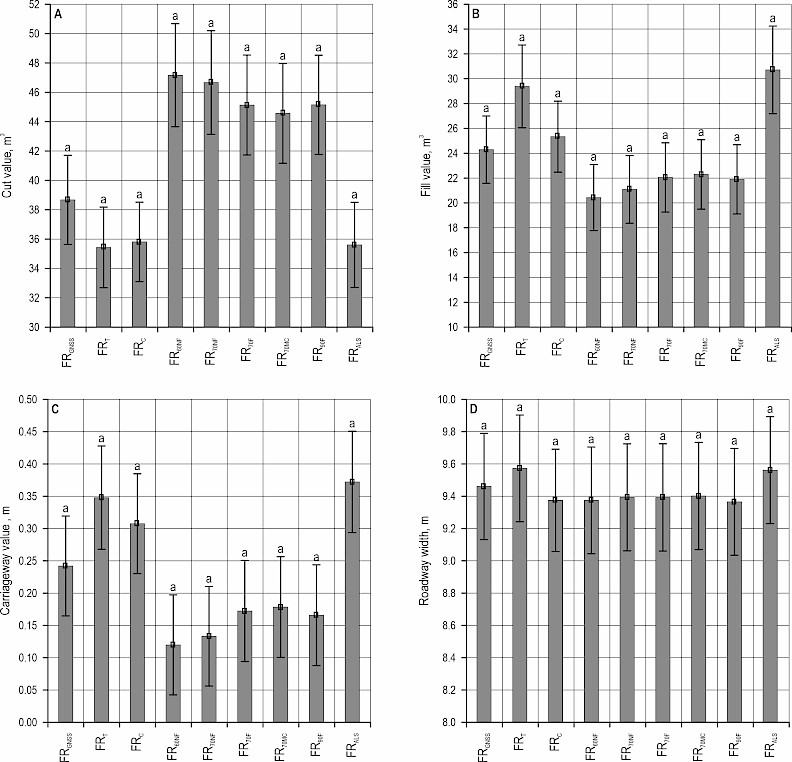
Fig. A2 Difference in tested parameters by measuring methods projects based on full data sets. Data are presented as mean ± SE (standard error). A) Cut volume, B) Fill volume, C) Carriageway value and D) Roadway width. Letters denote statistical differences between measuring methods (Tukey HSD), respectively, at p<0.05
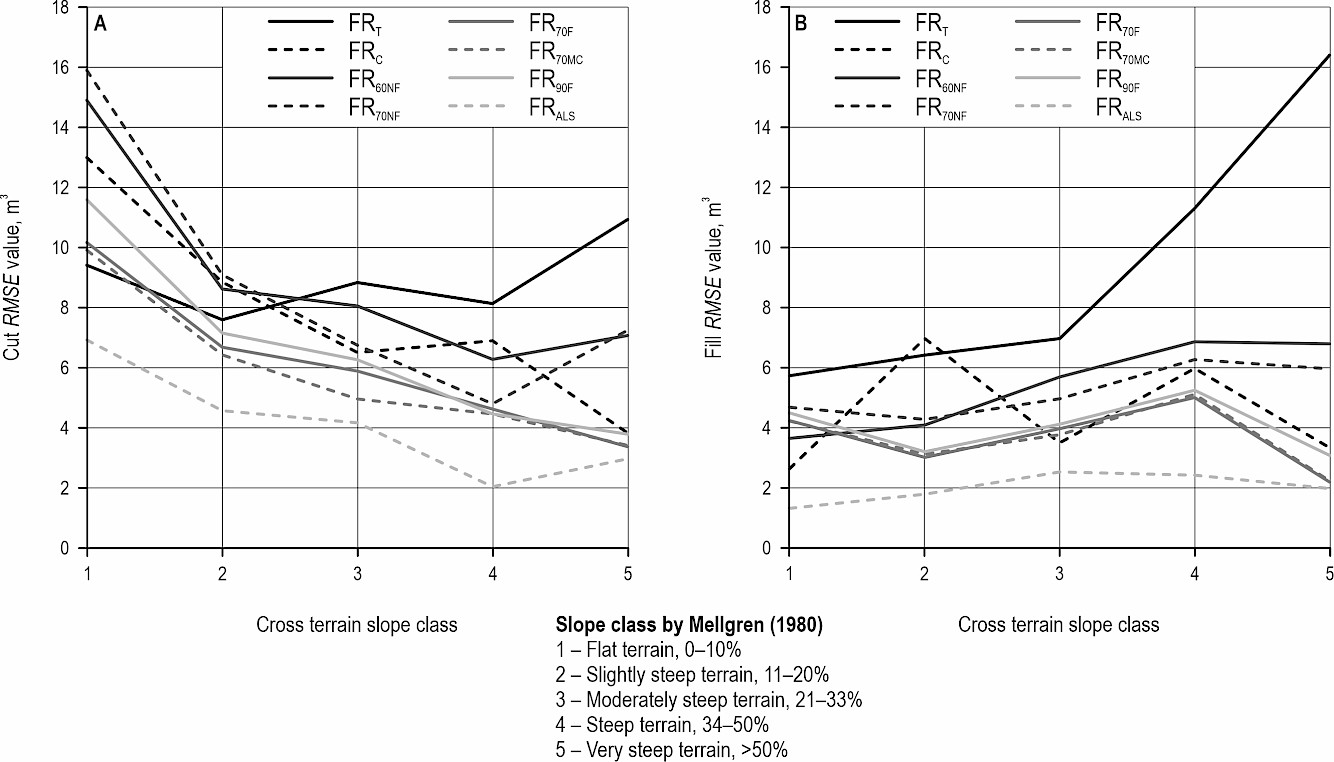
Fig. A3 Cut (A) and Fill (B) RMSE values by cross terrain slope classes. Forest road designs based on extracted points; same horizontal and vertical alignment
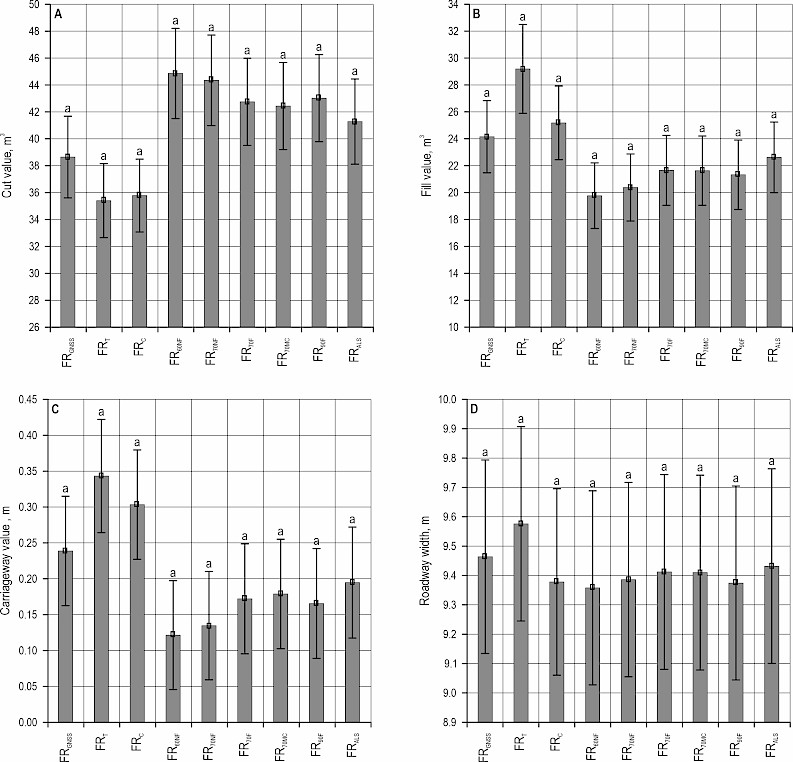
Fig. A4 Difference in tested parameters by measuring methods designs based on extracted points. Data are presented as mean ± SE (standard error). A) Cut volume, B) Fill volume, C) Carriageway value and D) Roadway width. Letters denote statistical differences between measuring methods (Tukey HSD), respectively, at p<0.05
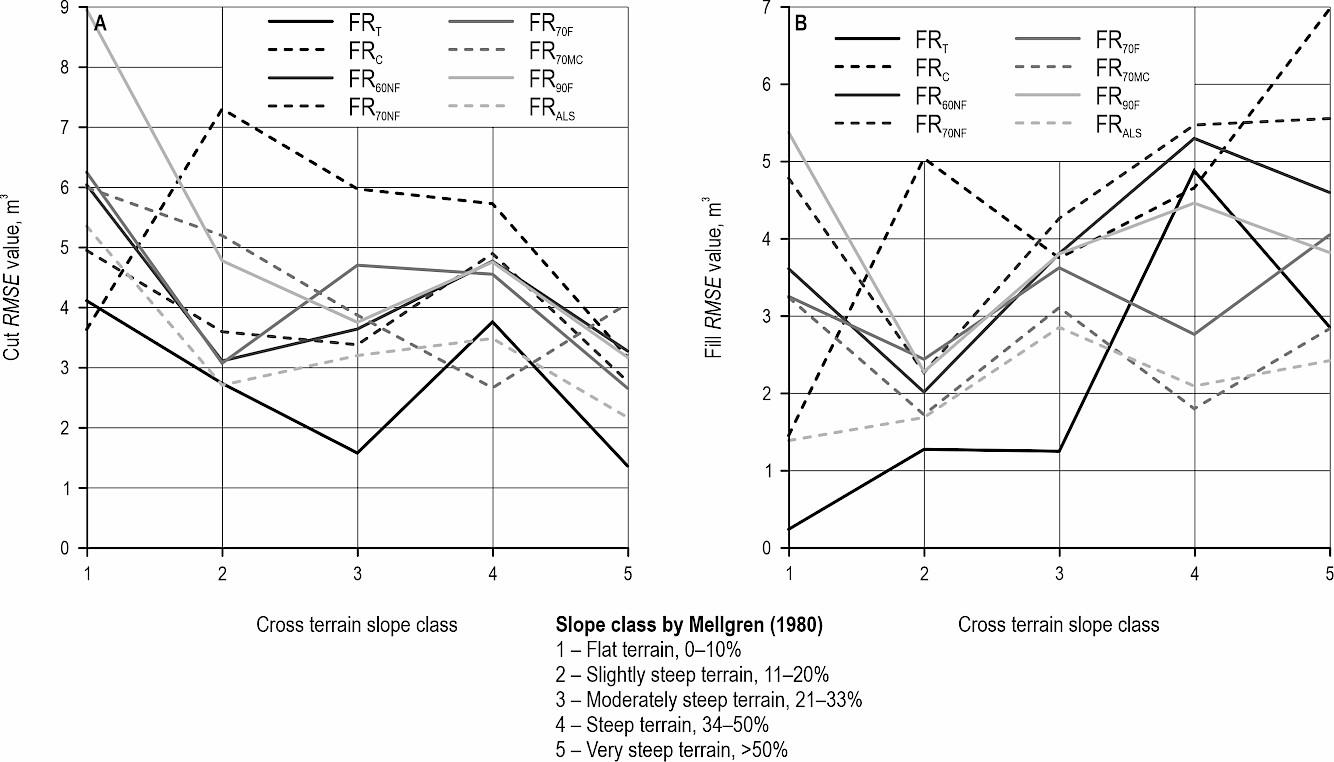
Fig. A5 Cut (A) and Fill (B) RMSE values by cross terrain slope classes. Forest road designs based on extracted points; same horizontal alignment, corrected vertical alignment
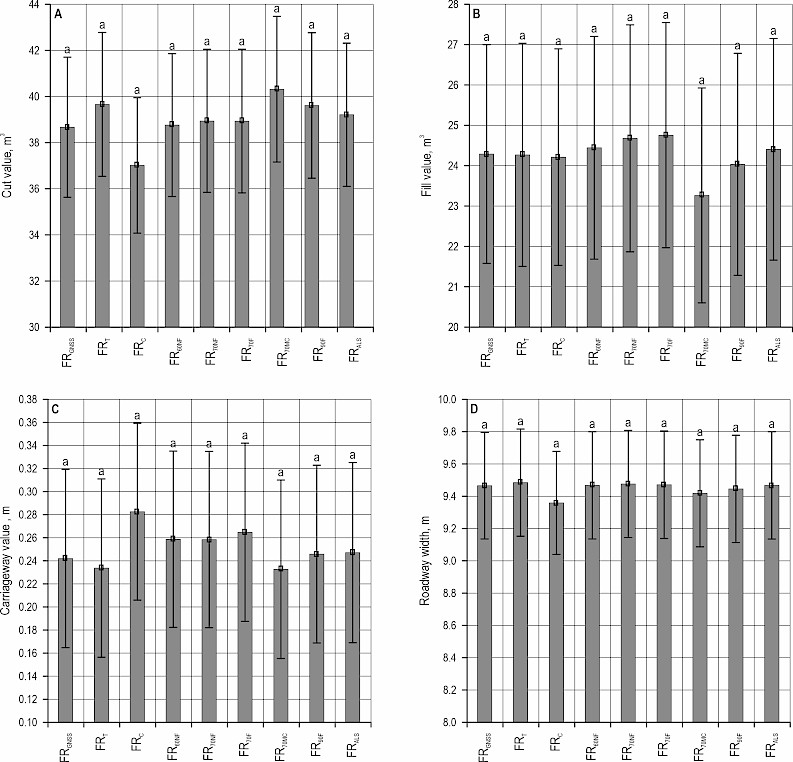
Fig. A6 Difference in tested parameters by measuring methods designs based on extracted points, same horizontal alignment, corrected vertical alignment. Data are presented as mean ± SE (standard error). A) Cut volume, B) Fill volume, C) Carriageway value and D) Roadway width. Letters denote statistical differences between measuring methods (Tukey HSD), respectively, at p<0.05
Table A2 Spatial accuracy (coordinates RMSE) of tested field data by survey methods (Lovrinčević et al. 2025)
|
Coordinate |
DTMC, m |
DTMT, m |
DTM60NF, m |
DTM70F, m |
DTM70MC, m |
DTM70NF, m |
DTM90F, m |
DTMALS, m |
|
X |
1.26 |
0.46 |
0.04 |
0.06 |
0.06 |
0.05 |
0.05 |
/ |
|
Y |
0.89 |
0.29 |
0.04 |
0.04 |
0.04 |
0.04 |
0.04 |
/ |
|
XY |
1.09 |
0.38 |
0.04 |
0.05 |
0.05 |
0.05 |
0.04 |
/ |
|
Z |
0.14 |
0.16 |
0.14 |
0.10 |
0.09 |
0.13 |
0.11 |
0.18 |
|
XYZ |
0.89 |
0.33 |
0.09 |
0.07 |
0.07 |
0.09 |
0.07 |
/ |
© 2026 by the authors. Submitted for possible open access publication under the
terms and conditions of the Creative Commons Attribution (CC BY) license (http://creativecommons.org/licenses/by/4.0/).
Authors’ addresses:
Mihael Lovrinčević, MSc
e-mail: mlovrin@sumfak.unizg.hr
Assoc. prof. Ivica Papa, PhD *
e-mail: ipapa@sumfak.unizg.hr
Maja Popović, PhD
e-mail: mpopovic@sumfak.unizg.hr
Luka Hodak, MSc
e-mail: lhodak@sumfak.unizg.hr
Prof. Tibor Pentek, PhD
e-mail: tpentek@sumfak.unizg.hr
Assoc. prof. Andreja Đuka, PhD
e-mail: aduka@sumfak.unizg.hr
University of Zagreb
Faculty of forestry and wood technology
Institute of Forest Engineering
Svetošimunska cesta 23
10000, Zagreb
CROATIA
* Corresponding author
Received: October 20, 2025
Accepted: January 14, 2026
Original scientific paper