
Skyline Tensile Forces in Cable Logging: Field Observations vs. Software Calculations
doi: 10.5552/crojfe.2021.722
volume: 42, issue:
pp: 19
- Author(s):
-
- Mologni Omar
- Luca Marchi
- Lyons Kevin C.
- Grigolato Stefano
- Cavalli Raffaele
- Röser Dominik
- Article category:
- Original scientific paper
- Keywords:
- cable yarding, skyline layout, tension, SkylineXL, finite element model
Abstract
HTML
Skyline tensile forces have been shown to frequently exceed the recommended safety limits during ordinary cable logging operations. Several models for skyline engineering analyses have been proposed. Although skyline tensile forces assume a dynamic behaviour, practical solutions are based on a static approach without consideration of the dynamic nature of the cable systems.
The aim of this study was to compare field data of skyline tensile forces with the static calculations derived by dedicated available software such as SkylineXL. To overcome the limitation of static calculation, this work also aimed to simulate the actual response of the tensile fluctuations measured in the real environment by mean of a finite element model (FEM).
Field observations of skyline tensile forces included 103 work cycles, recorded over four different cable lines in standing skyline configuration. Payload estimations, carriages positions, and time study of the logging operations were also collected in the field. The ground profiles and the cable line geometries were analysed using digital elevation models. The field data were then used to simulate the work cycles in SkylineXL. The dynamic response of six fully-suspended loads in a single-span cable line was also simulated by a dedicated FEM built through ANSYS®. The observed data and the software calculations were then compared.
SkylineXL resulted particularly reliable in the prediction of the actual tensile forces, with RMSE ranging between 7.5 and 13.5 KN, linked to an average CV(RMSE) of 7.24%. The reliability in predicting the peak tensile forces was lower, reporting CV(RMSE) of 10.12%, but still not likely resulting in a safety or performance problem. If properly set-up and used, thus, SkylineXL could be considered appropriate for operational and practical purposes. This work, however, showed that finite element models could be successfully used for detailed analysis and simulation of the skyline tensile forces, including the dynamic oscillations due to the motion of the carriage and payload along the cable line. Further developments of this technique could also lead to the physical simulation and analysis of the log-to-ground interaction and the investigation of the breakout force during lateral skidding.
Skyline Tensile Forces in Cable Logging: Field Observations vs. Software Calculations
Omar Mologni, Luca Marchi, Kevin C. Lyons, Stefano Grigolato, Raffaele Cavalli, Dominik Röser
Abstract
Skyline tensile forces have been shown to frequently exceed the recommended safety limits during ordinary cable logging operations. Several models for skyline engineering analyses have been proposed. Although skyline tensile forces assume a dynamic behaviour, practical solutions are based on a static approach without consideration of the dynamic nature of the cable systems.
The aim of this study was to compare field data of skyline tensile forces with the static calculations derived by dedicated available software such as SkylineXL. To overcome the limitation of static calculation, this work also aimed to simulate the actual response of the tensile fluctuations measured in the real environment by mean of a finite element model (FEM).
Field observations of skyline tensile forces included 103 work cycles, recorded over four different cable lines in standing skyline configuration. Payload estimations, carriages positions, and time study of the logging operations were also collected in the field. The ground profiles and the cable line geometries were analysed using digital elevation models. The field data were then used to simulate the work cycles in SkylineXL. The dynamic response of six fully-suspended loads in a single-span cable line was also simulated by a dedicated FEM built through ANSYS®. The observed data and the software calculations were then compared.
SkylineXL resulted particularly reliable in the prediction of the actual tensile forces, with RMSE ranging between 7.5 and 13.5 KN, linked to an average CV(RMSE) of 7.24%. The reliability in predicting the peak tensile forces was lower, reporting CV(RMSE) of 10.12%, but still not likely resulting in a safety or performance problem. If properly set-up and used, thus, SkylineXL could be considered appropriate for operational and practical purposes. This work, however, showed that finite element models could be successfully used for detailed analysis and simulation of the skyline tensile forces, including the dynamic oscillations due to the motion of the carriage and payload along the cable line. Further developments of this technique could also lead to the physical simulation and analysis of the log-to-ground interaction and the investigation of the breakout force during lateral skidding.
Keywords: cable yarding, skyline layout, tension, SkylineXL, finite element model
1. Introduction
Cable logging represents one of the most common harvesting solutions for steep slope forest operations, especially where steepness, roughness, soil bearing capacity, site sensitivity or stem size limit alternative ground-based solutions (Amishev et al. 2009, Koszman and Evans 2018). Site-specific forestry conditions led to the technological development of different cable yarding systems and configurations around the world (Studier and Binkley 1974, Larson 1978, Liley 1983, Samset 1985, FITEC 2005, WorkSafe BC 2006, OR-OSHA 2010, Safe Work Australia 2013, Ackerman et al. 2017). Highlead, live skyline, and running skyline systems are particularly common in North America, New Zealand, and Japan (Yoshimura and Noba 2013, Visser and Harrill 2017). In Central Europe, where forestry operations are mainly based on partial retention cuts and thinning operations, standing skyline cable yarders, in single and multi-span configurations, represent the primary cable logging system (Heinimann et al. 2001).
The safety risks for the operators represent one of the main limits of cable yarding operations (Tsioras et al. 2011, Allman et al. 2018). Excessive skyline tensile forces, in particular, is a primary safety concern in the risk assessment, being the main reason for broken supports, anchor tree and cables (Tsioras et al. 2011). Field trials have shown frequent exceeding of the recommended safety limits in skyline tensile forces during ordinary cable logging operations (Hartsough 1993, Harrill and Visser 2016, Spinelli et al. 2017, Mologni et al. 2019). In standing skyline configurations, improper installation of the cable structure or poor operational practices are the predominant elements in the non-compliance with the safety regulations, but dynamic loads can lead to tensile force increase up to critical values (Spinelli et al. 2017, Mologni et al. 2019).
Several models for skyline engineering analyses have been proposed. Those models are the results of improvements and adaptions of pioneering works developed between the 1960s and 1980s (Zweifel 1960, Pestal 1961, Carson and Mann 1970, Carson and Mann 1971, Irvine 1981), based on different type and level of approximation of non-linear catenary equations. Further studies and the progression of computer technologies improved the base algorithms and led to the development of updated procedures and tools for skyline layout, payload analysis, and tensile force calculations (Carson 1975, Tobey 1980, Falk 1981, Bodenhausen 1982, Chung 1987, Twito et al. 1988, Jarmer and Sessions 1992, Charland et al. 1994, Chung and Sessions 2003, Bont and Heinimann 2012, Dupire et al. 2015). Among others, SkylineXL (Rheinberger 2018) is one of the most common software currently available worldwide for skyline layout calculation. This software was developed by a joint effort of Oregon State University and USDA Forest Service in 2008, adapting the Windows-based LOGGER PC (Jarmer and Sessions 1992, Session 2002) to a Microsoft Excel Visual Basic code to avoid any Windows-compatibility related issues. SkylineXL allows to analyse the inhaul tensile forces of live skylines, running skylines, and standing skylines (single and multi-span configurations), including partial suspension calculations. The formulations implemented in SkylineXL are based on the rigid-link algorithms pioneered by Carson and Mann (1970) and later improved and articulated by many other different Authors over more than 40 years (Rheinberger 2019). The detailed formulas driving SkylineXL calculations, however, are protected and not freely accessible.
Although skyline tensile forces assume a dynamic behaviour, most of the methods available for skyline layout calculations, including SkylineXL, are based on a static approach without consideration of the dynamic nature of real cable systems. Inclusion of dynamic effects in modelling cable structures for forestry applications is minimal (Carson 1973, Womack 1989, Womack et al. 1994, Knobloch and Bont 2018) and still without any effective application. The dynamic response of a standing skyline system is quite different from a simple free vibration of a fully restrained cable (Pyles et al. 1994), and describing the effects of a moving mass (namely carriage and payload) much greater than the mass of the oscillating cable can be a challenging, complex task.
The aim of this study is to compare field data of skyline tensile forces, recorded during ordinary standing skyline cable yarding operations, with the static calculations derived by a dedicated software such as SkylineXL. Static calculations can define the general trend of skyline tensile forces but are not able to capture their dynamic component. Therefore, this work also aims to develop a preliminary finite element model (FEM) to simulate the loaded hauling phase (hereafter named inhaul) of fully-suspended loads with non-linear time-history analyses and reproduce the actual response of the tensile fluctuations measured in the real environment.
2. Materials and Methods
2.1 Field Data and Cable Systems
The field data collection was carried out during April 2017 in three different harvesting sites located in the north-eastern Italian Alps. Two experienced logging contractors participated in the study with their own logging crews, using three different mobile tower yarders. The cable yarders were manufactured by the same company, but they were installed on different base vehicles (e.g., trailer, truck, and self-propelled with track undercarriage). All the machines were comparable in terms of power and size and used the same automatic clamped carriagemodel. The carriage had a mass of 650 kg and a rated maximum payload of 40 kN. The three machines were also equipped with similar 22 mm skylines, 12 mm mainlines and 11 mm haul-back lines. The cable yarder used on cable line CL01 used a swaged skyline cable with a mass of 2.28 kg m-1 and a minimum breaking load (MBL) of 448 kN; the two cable yarders used on the other three cable lines used swaged skyline cables with a mass of 2.32 kg m-1 and a MBL of 435 kN.
The field monitoring included a total of 103 work cycles, over four different cable lines distributed between the three harvesting sites (Table 1). On the only multi-span cable line CL01, observations were collected only for the first span (i.e. between the tower yarder and the intermediate support). The average yarding distance was 216 m for the multi-span cable line CL01 and averaged between 113 and 137 m for the other three cable lines. The majority of the cycles included yarding of logs longer than 10 m, resulting in a prevalence of the partially-suspended extraction method. Cut-to-length logs were limited to less than 8% of the cycles. In addition, almost 78% of the work cycles included whole trees or semi-processed logs (i.e., logs with branches), which were processed at the landing.
Table 1 Cable line geometries and configuration
|
Cable line |
Site |
Yarder base vehicle |
Line configuration |
HL1, m |
VL2, m |
Span 1 |
Span 2 |
|||
|
IL3, m |
slp4, % |
IL3, m |
slp4, % |
|||||||
|
CL01 |
A |
self-prop.5 |
multi-span; down |
438 |
120 |
311 |
35 |
97 |
13 |
|
|
CL02 |
B |
truck |
single span; up |
172 |
39 |
160 |
25 |
– |
– |
|
|
CL03 |
C |
truck |
single span; down |
213 |
56 |
217 |
20 |
– |
– |
|
|
CL04 |
C |
trailer |
single span; down |
175 |
46 |
178 |
18 |
– |
– |
|
|
Notes: 1 HL – horizontal length, measured from the tower yarder to the tail anchor 2 VL – vertical length, measured from the tower yarder basement to the tail anchor 3IL – chord length 4 slp – chord slope 5 self-prop. – self-propelled with track undercarriage |
||||||||||
2.2 Skyline Tensile Force Monitoring and Field Data Collection
The skyline tensile forces were recorded at a frequency of 100 Hz through a tensiometer clamped on the skyline cable in the proximity of the tail anchor of the four cable lines. Coordinates and geometric data of the tower yarders, tailspars, intermediate supports and anchors were noted using a hand-held GNSS device and a laser rangefinder. An Arduino®-based GNSS sensor and an action camera, equipped with an external power source and a large memory card, were mounted on the carriages to record the carriage movements and the logging operations. Diameters and lengths of the logs yarded during each work cycle were measured to get an estimation of the volume. Also, each log was visually classified in terms of species and branches density in order to estimate the payload. This approximation was included because of the need to record ordinary cable yarding operations without interfering with the logging crews. The total estimated payload yarded for each cycle, including the logs and branches weight, ranged between 3 to 35 kN, averaging from 15.5 to 21.5 kN in the four cable lines.
The video recordings were used to carry out the time and motion study of the logging operations during the skyline tensile force monitoring. The work cycles were subdivided into different work elements, following the standard procedures described by Björheden (1991), identifying the productive machine hours excluding delays longer than 15 minutes (PMH15). Inhaul, used for the comparison of field data with SkylineXL calculations, includes the skyline tensile forces recorded from the moment when the load was completely pulled up to the carriage at the end of the lateral skid until the load reached the unloading position at the landing. Outhaul, used to define the system damping during the calibration of the FEM, includes the tensile forces recorded from the moment when the carriage was ready to move from the landing out to the choker setter and ended when the carriage stopped at the hooking area.
The skyline tensile force field data were processed through R-scripts, analysing both actual values and peak tensile forces, expressed as the maximum tensile force recorded per work cycle during inhaul. Also, cyclic load amplitude (CLA), expression of momentary excursion in the skyline tensile force during inhaul, and its maximum value (maximum cyclic load amplification – MCLA), were analysed. The MCLA represents the highest differences between consecutive pits and peaks and is the result of a combination of vibrations of the system and changes of the load applied to the cable structure due to carriage movements and, in case of semi-suspension, log-ground interaction (Pyles et al. 1994).
2.3 SkylineXL Elaborations
The skyline tensile forces of each work cycle were also calculated through SkylineXL 18.0. The use of SkylineXL requires several input data, including the ground profile; the technical features of the tower yarder, carriage and skyline; the height and position of the tower yarder and supports; as well as the selected cable system configuration. The ground profiles underlying each cable line were extrapolated from Lidar-based digital elevation models (1 m grid resolution) using QGIS software. Considering the limited availability of 50 points for the profile description in SkylineXL 18.0, the profiles were initially sampled in 45 equidistant points between the tower yarder and the tail anchor. Subsequently, further points were sampled at a 1 m distance from the tower yarder and in the proximity of the tailspar and intermediate support positions.
The technical features of the mobile tower yarders and carriages used in this study were added to the SkylineXL database. The technical features of the wire ropes used by those machines, however, cannot be exactly specified in the software. Only diameter, line type, and line length can be specified, while the mass (kg m-1) and the designed tensile force (expressed in kg) are directly applied by the software reflecting the other features. The skyline mass was considered the most relevant parameter for the analysis. Thus, diameters and line types were adjusted to generate rope masses close to the real data. A 22.3 mm skyline diameter and an extra improved plow steel (EIPS) line type allowed to get a rope mass of 2.11 kg m-1, which differ between 0.17 and 0.21 kg m-1 from the real data.
To reproduce field conditions, a proper pretension value has to be considered in the calculation. Pretension is defined as the skyline tensile force when the carriage is unloaded and hanging from the skyline near the tower yarder. SkylineXL does not allow to define a pretension value; however, it allows to modify the un-stretched skyline length, which is an indirect expression of pretension. The un-stretched skyline length is not measurable in the field with the required precision. Small variations (<1 m) in the skyline length of a 200 m long cable line can lead to a variation of over 50 kN in the output data of the skyline tensile forces. In addition, different un-stretched skyline lengths lead to different line shapes of the skyline tensile force due to a reduced tensile force increment index (increment per unit of payload) at shorter skyline length (higher pretension). Thus, it is not possible to simply correct the values by the difference between real pretension and tensile force value calculated close to the cable yarder. Similarly, any method to calculate skyline length could result in a small error in the skyline length; however, this could result in a large error in the tensile force. For these reasons, similarly to what was mentioned by Visser (1998) for LOGGERPC, starting from the preliminary calculation of SkylineXL, an iterative procedure based on consecutive approximations was applied for each cable line in order to identify the un-stretched skyline length able to provide, at a distance of 1 m from the tower yarder, an unloaded tensile force (no-load situation) equal to the pretension measured in the field. To properly create a no-load situation, the tag length was reduced to 1 m, the log length to 2 m, and the minimum log clearance was increased up to the maximum feasible level. This combination of input data reduced the minimum allowed payload to a value close to zero, replicating the field conditions of pretensioning in which the unloaded carriage is located very close to the tower yarder.
The »Phase 1« of the SkylineXL calculation procedure allows to define the net payload that can be extracted along the whole cable line (between the »outer« and »inner« terrain point, as named by the software) without exceeding the designed tensile force (as defined by skyline features). This phase requires the definition of load size, minimum log clearance, transportation system, and loading and unloading position. The logs measures were derived from the field data, assuming the logs as pure cylinders. The tag length was assumed to be constant at 2 m. The minimum log clearance was set to 0.3 m. The log length and the video analysis were used to identify the transportation system (full or partial suspension) of each work cycle. The GNSS sensor mounted on the carriage was used to localise the carriage and continuously measure the relative position from the tower yarder, which allowed to calculate the yarding distance (maximum relative distance measured per work cycle). The yarding distance was then used to select the »outer distance terrain point« (i.e., the loading position as defined in SkylineXL).
The »Phase 2« of the SkylineXL calculations allows to modify the payload and the un-stretched skyline length, and assess the skyline tensile force analysis for a specific work cycle. The payload was estimated from the field log measurements and the associated description of species and crown density. The un-stretched skyline length was derived from the preliminary calculation at each pretension setting (Table 2).
Table 2 Un-stretched skyline length related to pretension settings as detected through iterative procedure in SkylineXL
|
Cable line |
Work cycles, n. |
Pretension, kN |
Skyline length, m |
|
CL01 |
36 |
105 |
406.0 |
|
CL02 |
17 |
100 |
158.9 |
|
CL02 |
13 |
110 |
158.8 |
|
CL03 |
9 |
80 |
178.4 |
|
CL04 |
16 |
135 |
214.6 |
|
CL04 |
12 |
120 |
214.8 |
2.4 Comparison between Observed Data and Skylinexl Calculations
The comparison between the field data of skyline tensile forces during inhaul and the values calculated through the use of SkylineXL were carried out using R-scripts. The field data, measured as time series, were related to the carriage position recorded through the GNSS sensor and plotted according to the distance from the tower yarder. Both the observed field data and the calculated tensile forces were then sampled at each consecutive meter, starting from the unloading point up to the total yarding distance recorded for each work cycle.
The differences in the skyline tensile forces between the field observations and the software prediction were analysed at each sampled point for each work cycle. Those differences were then described for each cable line through the mean absolute error (MAE), the root mean square error (RMSE) and its coefficient of variation – CV(RMSE) – calculated as RMSE divided by the mean skyline tensile force recorded per cable line. The same kind of analysis was then carried out for the differences between the observed field data and SkylineXL calculations in terms of peak tensile force and MCLA during inhaul.
The significance of differences between the field observations and software calculations was tested through paired and unpaired t-test, as appropriate, using the work cycle as the observational unit. In case of a non-normal distribution of the data, logarithm and square root transformations were carried out to normalise the distribution. If the normalisation process was not successful, the Wilcoxon signed-rank or the Kruskal-Wallis non-parametric tests were used instead of the paired and unpaired t-test, respectively. The same non-parametric tests were also used if the Leven’s test showed heterogeneity of variance.
The peak tensile forces represent the main critical aspect in the operational skyline layout. To identify the explanatory variables of differences between the observed and predicted peak tensile forces, a linear mixed-effect regression analysis was used, assuming the cable lines as a random factor. The significance of the individual variables was evaluated through the Likelihood ratio test, testing the difference in two nested models using the Chi-square distribution. Statistical assumptions were tested by analysing the residual distributions. The goodness-of-fit of the linear mixed-effect model was tested through the coefficient of determination (R2LR) suggested by Magee (1990) and based on the Likelihood ratio joint significance test. The significance level of the statistical analysis was set to 0.05.
2.5 Finite Element Model Development
The dynamic behaviour of a standing skyline system can be explained as the combination of the free vibration of a suspended cable with both ends partially/fully restrained – subjected to its own weight and a defined pretension – and the dynamic effects of an external mass hung to the cable and moving along it. According to these assumptions, a bi-dimensional FEM was developed through ANSYS® software to reproduce the skyline tensile force fluctuations for the single-span cable line CL02. Six fully-suspended work cycles, with payloads ranging from 6.7 to 25.7 kN, were simulated.
The cable line CL02 was reproduced in the FEM according to geometry and configuration reported in Table 1. The skyline was modelled with 2-node ANSYS® LINK180 elements, which are capable to simulate the actual tension-only behaviour of a cable and support linear stress-strain relationships necessary to include cable stretch. The line chord was divided into 200 elements of equal length; each node connecting two subsequent elements represents a potential position of the carriage along the skyline. Metallic cross-section, linear mass and material properties matched the skyline properties. Skyline stretch was included adopting a linear elastic material constitutive law. Missing mechanical parameters of the 22 mm skylines were taken from Feyrer (2015): the metallic cross-section was set equal to 217 mm2 and the modulus of elasticity was assumed equal to 100 GPa. As a simplification, the guyed tailspar and the guyed tower yarder were substituted by linear elastic springs (ANSYS® COMBIN14 elements) placed at both cable ends, allowing to impose the measured pretension load and the skyline stretch. Out-of-plane restraint conditions were applied to let the cable oscillate in the vertical component of the in-plane motion only.
The calibration of the FEM was made of two parts:
Þ definition of the initial pretension and stiffness to be given at both springs in the absence of gravity loads, in order to match the actual measured pretension
Þ definition of the system damping by running the simulation of outhaul and by analysing the cable response at the conclusion of this element (when carriage stops at the desired position, and tensile force fluctuations are progressively damped).
At the end of the calibration, pretension matched the measured values and the cable path corresponding to the beginning of the outhaul phase was defined. Damping was set equal to 0.5%, which is in line with the range given by Irvine (1981). Finally, the calibrated model was used to simulate the working cycles through time-history analyses (i.e., time-dependent analyses). This type of analyses requires knowledge about the evolution of forces (or displacements, accelerations, etc.) over time. Therefore, the timing of working elements is an essential additional input with respect to static or quasi-static models. Both outhaul and inhaul were simulated, neglecting lateral skidding.
While the skyline mass was evenly distributed, the estimated total load during inhaul – computed as the sum of carriage weight and payload – was simulated by equivalent lumped masses positioned at each node (i.e., a given position along the cable). The length of the chokers and log oscillations were not considered in the model. Each possible position of the mass was linked to a specific time step of the analysis. ANSYS® birth-and-death function was then exploited allowing to realistically move the mass over the total yarding distance by activating and deactivating it at the desired time and position; this feature avoided any possible duplication of masses during each time-step of the analysis. The location of the carriage during outhaul and inhaul, registered with the GNSS sensor, allowed to compute the speed of the carriage (i.e., the rate of change of position of the suspended mass and possible acceleration or deceleration within a certain time frame).
The estimated payload was set to each of the six simulated cycles and the carriage speed was defined by just adapting the timing of each step in the analysis according to the values measured in the field. A preliminary parametric analysis was run to verify the suitability of the chosen distance between nodes and to define the minimum and maximum time substeps that could be reached in each iteration (ranging between 0.001 up to 0.1 s).
2.6 Comparison between FEM and Observed Cyclic Loads
The dynamic component of the tensile forces during inhaul, as observed in the field, and the values calculated through the FEM were compared analysing both the cyclic load amplitude (CLA) and fundamental period of vibration (T1). It must be emphasised that the potential offset of the cyclic amplitude between FEM and field data, generated for example by a not perfect position acquired by the GNSS system or an accidental initial acceleration of the carriage, could erroneously affect the mean error estimation. As a result, the obtained pit and peak points were interpolated with two high-order polynomials. Consequently, it was possible to resample CLA over the yarding distance, obtaining a sufficiently precise estimation of its value within each consecutive meter.
Comparison between the observed field data and numerical results of skyline tensile forces derived by the FEM was then carried out with the same approach and statistical indicators (RMSE, CV(RMSE), MAE) used for the SkylineXL outputs. The CV(RMSE) in this case was calculated both over the mean skyline tensile force (as done for the SkylineXL output) and over the mean CLA. Moreover, both CLA and T1 were correlated with the total mass excited by the system (carriage, payload and skyline mass) and the mean inhaul speed.
3. Results
3.1 Comparison of Skyline Tensile Forces
Comparison of the actual values of skyline tensile forces between field observation and SkylineXL calculations resulted in a total of 13 589 sample points (every 1 m of yarding distance per cycle). An example of inhaul skyline tensile force during a semi-suspended work cycle is reported in Fig. 1a. As shown in the plot, the field data highlights the dynamic cyclic behaviour of the tensile force, described in its maximum magnitude by the MCLA. In the whole dataset, this parameter recorded values ranging from 7.3 up to 37.7 kN; however, almost 78% of the work cycles recorded values lower than 25 kN. SkylineXL does not include dynamic loading and the output data of the software shows a smoothed line, function of the cable line geometry, un-stretched skyline length, load applied and log-ground interaction. The normalised differences between the two tensile force curves, calculated setting the difference at each sample point as ratio with the maximum difference recorded per work cycle (Fig. 1b), did not show any significant trend. This showed the effect of cyclic loads on the differences between the observed and predicted data, but it also suggested a general good performance of SkylineXL in the analysis of the log-ground interaction (i.e., the skyline tensile forces predicted by SkylineXL follow the trend of the observed data).

Fig. 1 a) Skyline tensile force vs. yarding distance during inhaul of a work cycle; b) Evidence of the normalised difference (norm. dif.), defined as the ratio between local difference and maximum difference recorded in the work cycle, between the observed and predicted values (Cable line CL01, pretension 105 kN, estimated payload 20.5 kN)
At the sampled points (at each meter of yarding distance), the field measures showed inhaul tensile forces ranging between a minimum of 89 up to 223 kN, with the highest values normally recorded at the mid-span. Similarly, the tensile forces calculated through SkylineXL showed values ranging from 92 up to 194 kN, with a distribution comparable to the observed field data (Fig. 2).

Fig. 2 Skyline tensile force distribution of observed data and SkylineXL predictions; vertical lines show mean tensile forces
The differences between field measurements and calculated tensile forces were mostly limited to ±15 kN (84% of the sampled points), with almost 37% of the sampled points showing a difference lower than ±5 kN (Fig. 3). Differences higher than ±25 kN were limited only to 2.3% of the sampled points. In relative terms, this means primarily differences limited to ± 10% of the observed tensile forces. Note that most of the sampled points (68.5%) showed predicted values lower than field observations.

Fig. 3 Comparison between observed skyline tensile force data and predicted data through SkylineXL
Differences in terms of average skyline tensile forces between the observed data and SkylineXL predictions were statistically significant (p-value <0.001) but mostly limited to about 10 kN (Table 3). The RMSE of the whole dataset was 10.8 kN and ranged from 7.5 up to 13.5 kN between the four cable lines. The CV(RMSE) ranged from 6.45 to 8.10% and averaged to 7.24%. Similarly, the MAE ranged from 5.9 to 10.9 kN, with an average value of 8.5 kN for the whole dataset.
Table 3 Comparison between SkylineXL calculations and observed skyline tensile forces at each meter of yarding distance
|
Cable line |
Sample points, n. |
Observed data, kN |
Calculated data, kN |
p-value |
RMSE, kN |
CV(RMSE), % |
MAE, kN |
|
CL01 |
6745 |
146.9a |
143.0b |
<0.001 |
9.5 |
6.45 |
7.5 |
|
CL02 |
3426 |
148.6a |
144.8b |
<0.001 |
11.6 |
7.81 |
9.4 |
|
CL03 |
838 |
121.5a |
122.6b |
<0.001 |
7.9 |
6.47 |
5.9 |
|
CL04 |
2580 |
167.0a |
157.7b |
<0.001 |
13.5 |
8.10 |
10.9 |
|
Notes: the letters in apices of peak data show the significance of differences between observed and predicted values, tested through the Wilcoxon signed-rank test (non-parametric test) |
|||||||
To analyse the effect of the dynamic amplification in the performances of SkylineXL, a mean tensile force curve of the observed data, based on averaging pits and peaks values, was also used for the comparison with the prediction of the software. This curve represents an approximation of the static skyline tensile force, as derived by field observations. The results showed just a brief improvement in the prediction performances of SkylineXL. The RMSE averaged to 10.2 kN, the CV(RMSE) to 6.81%, and the MAE to 8.2 kN. This analysis aimed to highlight the effect of the dynamic components, but it showed that the differences between the observed and predicted data are mainly linked to a limited offset between the two curves.
3.2 Skyline Peak Tensile Forces Comparison
Skyline peak tensile forces represent a primary aspect in the payload analysis and tensile force calculations. Field data showed inhaul peaks exceeding the recommended safe working load (SWL), defined as one-third of the MBL, in more than 88% of the work cycles, reaching maximum values higher than 160 kN in all of the four cable lines. Only cable line CL03 showed an average peak tensile force lower than the SWL. In this cable line, however, 22% of the work cycle still exceeded the SWL. SkylineXL calculations showed lower average peak tensile forces (Table 4), but 12 work cycles, distributed in cable line CL01, CL02 and CL03, showed calculated peak tensile force higher than field observations. The highest differences between the calculated peaks and field data exceed 25 kN in all the four cable lines, with a maximum of more than 45 kN recorded in cable line CL04.
Table 4 Comparison between SkylineXL calculations and observed peak skyline tensile forces
|
Cable line |
Work cycles, n. |
Observed peak, kN |
Calculated peak, kN |
p-value |
RMSE, kN |
CV(RMSE), % |
MAE, kN |
|
CL01 |
36 |
161.2a |
151.2b |
<0.001 |
13.5 |
8.41 |
10.8 |
|
CL02 |
30 |
168.7a |
159.4b |
0.023 |
14.3 |
8.55 |
12.5 |
|
CL03 |
9 |
138.4a |
131.4a |
0.225 |
11.6 |
8.44 |
6.7 |
|
CL04 |
28 |
188.1a |
164.3b |
<0.001 |
25.4 |
13.60 |
22.7 |
|
Notes: the letters in apices of peak values show the significance of differences between observed and predicted mean tensile forces, tested through unpaired t-test |
|||||||
SkylineXL, indeed, showed lower performances in predicting inhaul peak tensile forces (Table 4) compared to actual values of tensile force, with RMSE averaging at 17.0 kN and ranging from 11.6 up to 25.4 kN. The CV(RMSE) exceeded 8.4% in all the cable lines, with a peak of 13.6% in cable line CL04 and a mean value of 10.12%. The MAE showed values ranging from 6.6 up to 22.7 kN, with an average of 14.2 kN.
A mixed-effect linear regression analysis of the absolute difference between the peak tensile forces observed in the field and the predictions of SkylineXL showed the total estimated payload, the estimated branches load (a component of the total estimated load), and the MCLA as explanatory variables (Table 5). These variables, however, were able to explain only less than one-third of the data variability (R2LR=0.29). Estimated branches load and MCLA showed positive estimators, while the estimated payload a negative one.
Table 5 Explanatory variables of differences between observed peak skyline tensile forces and SkylineXL calculation, detected through a linear mixed-effect model setting the cable lines as random factor
|
Variable |
Estimator |
SE |
t-value |
c2 |
p-value |
|
Estimated payload, kN |
–0.848 |
0.139 |
–6.100 |
32.319 |
<0.001 |
|
Estimated branches load, kN |
2.921 |
0.963 |
3.034 |
9.224 |
0.002 |
|
MCLA, kN |
0.723 |
0.161 |
4.497 |
18.359 |
<0.001 |
3.3 Skyline Cyclic Load Comparison
An example of the tensile force behaviour during a complete fully-suspended work cycle is shown in Fig. 4. Time-history analyses involved the simulation of each complete working cycle. However, detailed investigation of CLA and period of vibration were limited to inhaul. A total of 357 seconds of time-history analyses was computed for the simulated inhaul elements only. Each inhaul element was sampled with an average of ~8000 substeps. Cable tensile forces plotted over yarding distance (Fig. 5 and Fig. 6) were defined up to 10 m from the loading and unloading positions. Namely, the first 10 m from the cable yarder and the hooking location were excluded from the statistical analysis of tensile force trends. This was done to eliminate potential errors in the carriage position due to the GNSS sensor accuracy.
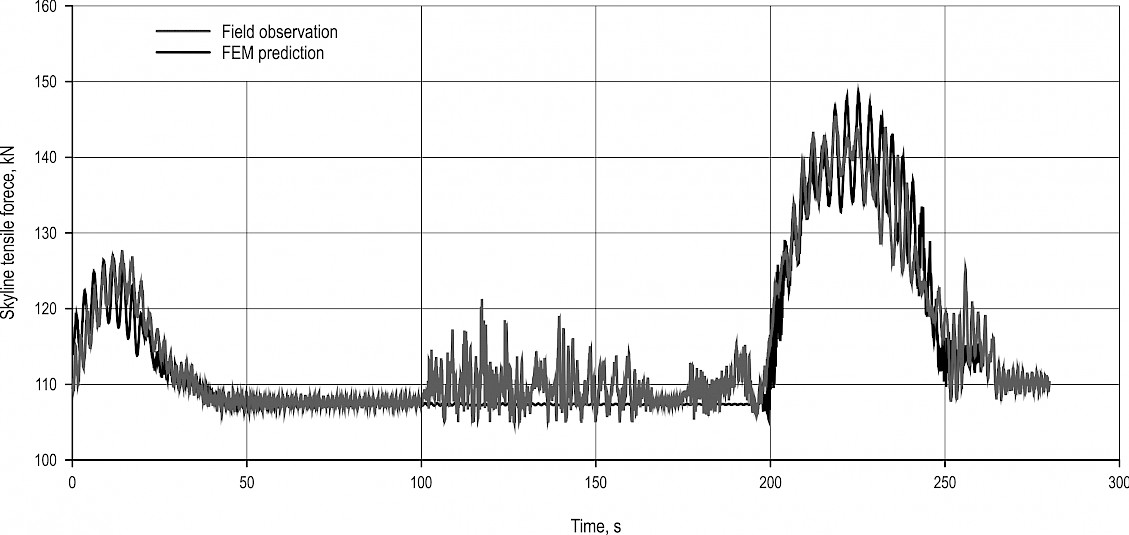
Fig. 4 Time-history of observed data of skyline tensile forces for a complete work cycle (including outhaul, hook up, lateral skid, inhaul, and unload) and related FEM prediction (Cable line CL02, work cycle #1, pretension 100 kN, estimated payload 6.7 kN)
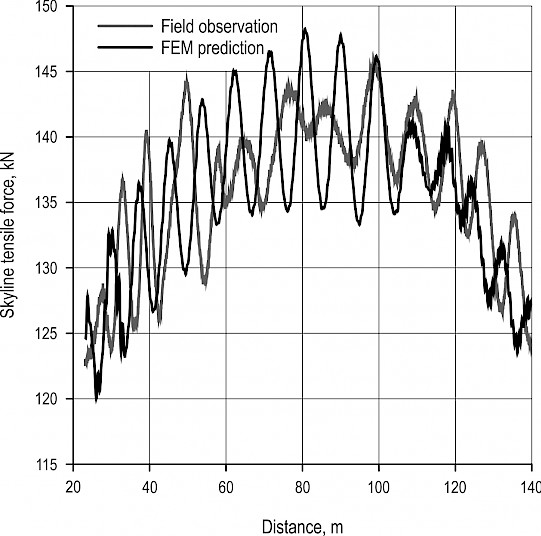
Fig. 5 Tensile force vs. distance during inhaul for both field observation and FEM prediction (Cable line CL02, work cycle #1, pretension 100 kN, estimated payload 6.7 kN)
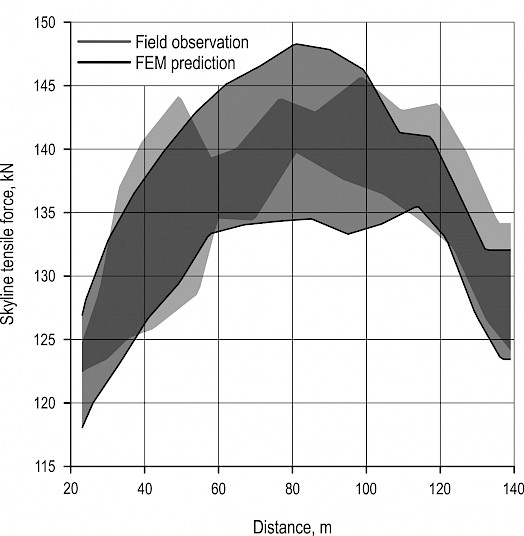
Fig. 6 Envelopes of pits and peaks in skyline tensile force for both field observation and FEM prediction (Cable line CL02, work cycle #1, pretension 100 kN, estimated payload 6.7 kN)
The prediction of the model in terms of CLA (Table 6) returned a RMSE of 5.7 kN, with values between 3.5 and 6.9 kN. The CV(RMSE)1, calculated over the mean skyline tensile force, was contained under 4.37% in all six cycles. The CV(RMSE)2, calculated over the mean CLA, ranged between 36.52 and 56.17%. MAE showed values ranging from 3.2 up to 5.7 kN, averaging at 6.6 kN.
Table 6 Comparison between FEM calculations and observed skyline cyclic load amplitude
|
Turn |
Sample points, n. |
Observed mean CLA, kN |
Calculated mean CLA, kN |
p-value |
RMSE, kN |
CV(RMSE)1, % |
CV(RMSE)2, % |
MAE, kN |
|
1 |
119 |
8.7a |
10.6b |
<0.001 |
5.1 |
3.87 |
48.04 |
4.2 |
|
2 |
101 |
16.3a |
14.0b |
0.002 |
5.1 |
3.32 |
36.52 |
4.1 |
|
3 |
109 |
11.7a |
8.7b |
<0.001 |
3.5 |
2.37 |
40.81 |
3.2 |
|
4 |
114 |
15.2a |
15.2a |
0.950 |
6.6 |
4.18 |
43.11 |
5.7 |
|
5 |
117 |
9.9a |
11.5a |
0.126 |
6.4 |
4.19 |
56.17 |
5.1 |
|
6 |
117 |
17.2a |
18.8b |
0.011 |
6.9 |
4.37 |
36.96 |
5.5 |
|
Notes: CV(RMSE)1 – CV(RMSE) calculated as RMSE divided by observed mean skyline tensile force CV(RMSE)2 – CV(RMSE) calculated as RMSE divided by observed mean CLA the letters in apices of mean values show the significance of differences between observed and predicted mean CLA, tested through the Kruskal Wallis non-parametric test |
||||||||
The observed data showed a positive correlation of the mean CLA (R2=0.94) and MCLA (R2=0.97) to the total excited mass (i.e., total load inclusive of estimated payload, carriage weight, and cable weight) of the system (Fig. 7). Regression on FEM calculations confirmed the same trend for both mean CLA (R2=0.92) and MCLA (R2=0.95). The intercept was not significantly different from zero in all cases (p<0.001). MCLA was positively correlated to the inhaul speed by both field observations (R2=0.63) and FEM outputs (R2=0.95). Lower correlation values were obtained with reference to the mean CLA for field data (R2=0.49) and FEM calculations (R2=0.67).

Fig. 7 CLA vs. estimated total load (total excited mass) for both field observation and FEM prediction
The theoretical fundamental period of the cable-only configuration (T1,cable), calculated according to Pyles et al. (1994), was equal to 1.48 seconds, while the FEM showed a T1,cable equal to 1.75 seconds. The increase of total load due to the carriage (75.6%) produced an increase in the period of first vibration of 58.8% (T1,outhaul=2.78 seconds). While T1,cable could not be verified with field data due to the lack of specific tests (e.g., swaying tests on the cable-only), T1,outhaul was validated by analysing the tensile force fluctuations derived during outhaul and after the carriage was stopped at the loading area (Fig. 4). The mean value obtained from field data was T1,outhaul equal to 2.53 seconds (–9.0%).
Concerning inhaul, an increase of the mean fundamental period of oscillation T1,inhaul proportional to the total load was supported by the FEM simulations (Fig. 8). Maximum and minimum values of 3.20 and 3.69 seconds were obtained for a total oscillating mass equal to 16.84 and 35.81 kN, respectively. The corresponding observed mean T1,inhaul were equal to 2.88 and 2.93 seconds. The mean relative difference of period calculated for the whole sampled points was equal to 19.91%.
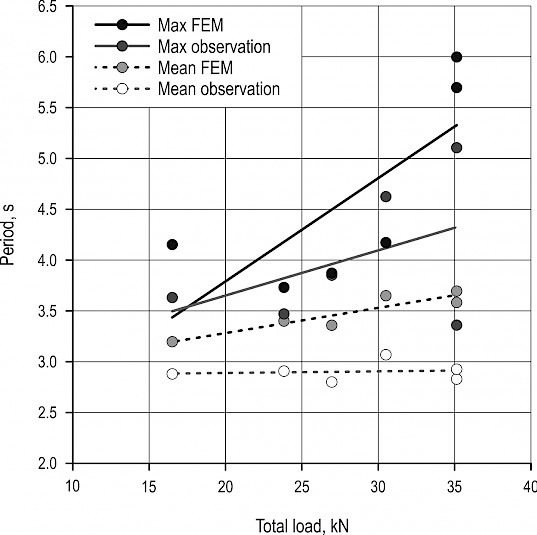
Fig. 8 Mean period of oscillation vs. estimated total load (total excited mass) for both field observation and FEM prediction
4. Discussion
Software for payload analysis and skyline tensile force calculations is available since the onset of computer technologies. However, comparisons of software outputs with actual operational field data are extremely limited. One of the main reasons is probably related to the limited availability of field operational data due to the costs and challenging conditions to record skyline tensile forces (Dupire et al. 2015, Mologni et al. 2019).
This study analyses the performance of SkylineXL 18.0 in the calculation of inhaul skyline tensile forces of four cable lines in a standing skyline configuration. The software predictions were based on real data collected in the field in terms of anchor and support positions, cable line geometries, log volumes and features, yarding distances, pretension, and cable systems set-up. A similar approach was proposed by Spinelli et al. (2017). In this case, the paper reported the results of calculations made through SkylineXL 15.0 in comparison with the field data of 83 work cycles in a single span cable line. The results highlighted low mean payload efficiency (36–44%), defined as the ratio of the actual payload to the potential payload, associated with a frequent exceeding of the SWL, suggesting the need for further detailed studies.
The present work highlights that the field data collection inevitably introduces errors due to the challenging conditions of monitoring ordinary operation without interruption of the logging activity. The main potential errors are probably linked to the pretension detection and to the payload estimation. Also, the position of anchors and supports were recorded through GNSS devices with a potential error of up to 10 m. The reliability of the data collected in the field, however, was considered appropriate by the authors of the study for this kind of analysis.
SkylineXL, based on a static approach and rigid-link approximations, does not consider the dynamic nature of the skyline behaviour. Field observations, recorded at a frequency of 100 Hz, shows MCLA mostly up to 25 kN. Thus, differences up to 10–15 kN (half of the mean MCLA recorded per work cycle) between a static calculation and real data are expected just because of the effect of the dynamic amplification during inhaul. This was confirmed by the fact that most of the sampled points (84%) showed differences between the observed and predicted values up to 15 kN. However, the comparison of approximated field static tensile forces, derived averaging the observed dynamic oscillations with the SkylineXL predictions, showed just a brief general improvement of the results. This aspect suggested that limited errors in the pretension detection and/or in the payload estimation could be more relevant than the dynamic components in the differences between the predicted and observed tensile forces.
SkylineXL was particularly efficient in the prediction of the actual tensile forces. The analysis of 22 mm skylines with average tensile forces ranging between 122 to 167 kN showed RMSE between 7.5 and 13.5 KN, linked to a CV(RMSE) lower than 8.1%. Also, the absence of any trend in the normalised differences at different yarding distances highlighted the reliability of the algorithms in the analysis of the log-ground interactions. As a comparison, Dupire et al. (2015), testing their suggested model in the prediction of 30 static field measurements of fully-suspended loads in a single span cable line (16 mm skyline diameter), showed RMSE ranging from 1.1 to 2.7 kN and a CV(RMSE) ranging from 1.4 to 3.4% between the different options presented.
While the SkylineXL calculations showed satisfying results in the analysis of the actual tensile forces, the performances in the prediction of the peak tensile forces were lower. The MAE, in this case, reached a peak of 22.7 kN in cable line CL04, and the CV(RMSE) was higher than 8.4% in all the cable lines. MCLA was an explanatory variable of differences between the peak tensile forces recorded in the field and the SkylineXL predictions, reporting a positive estimator. Thus, the dynamic amplification, even if with limited effect on the performances in predicting the actual values, has a more significant role in the differences between the observed and predicted peak tensile forces. The effect of the dynamic components, however, is still relatively limited and is not likely to result in a safety or performance problem. The estimated payload and branches load (a component of the estimated payload) were explanatory variables as well, with a positive and negative estimator, respectively. Again, these two variables confirmed that error in the payload estimations was a reason for the differences between the predicted and observed skyline tensile forces. Low payloads and logs with relevant branches density were more subject to estimation errors.
SkylineXL showed satisfying results in predicting the skyline tensile forces, even when comparing real data inclusive of the dynamic components and using pretension settings and estimated payloads subject to unavoidable errors as input data. The analysis in a controlled environment with the possibility to carefully weight each load could produce even better results than those obtained in this study. SkylineXL still has room for improvements in regard to the analysis of standing skyline cable yarders, particularly in terms of modifying the input data. However, if properly used, it could provide reliable results. In particular, the analyst using SkylineXL should consider the common practices in cable yarding in the area of interest. The base approach of the program is to maximise the payload of the system by increasing deflection. This does not correspond for example to the common practice in Europe, where the practice to set the pretension to two-thirds of the safe working load regardless of the deflection that might still be available (Visser 1998) is still common.
The algorithms included in SkylineXL proved to correctly evaluate the general trend of skyline tensile forces but were not able to capture their dynamic components. This work also attempted to predict this time-dependent component by means of FEM. In general, this technique has the advantage to physically reproduce complex mechanical systems without the need for particular mechanical manipulation (Zienkiewicz and Taylor 2000) but require higher computational resources than solving traditional iterative algorithms. Conversely, the ongoing progress of computer technology allows to obtain sufficient geometry discretisation and reliable solutions without the need for excessive computing capability. It took about 600 seconds to solve the simulation of a complete 300-second long work cycle (run using a laptop equipped with a 2.8 GHz quad-core CPU, a 16 GB RAM, and a SSD with a sequential write speed of 1500 MB/s). Considering inhaul only, the simulation took about 150 seconds.
With reference to the FEM results, the limited number of simulated work cycles and the modelling assumptions described in Section 2.5 (e.g., fully-suspended loads) do not allow to provide exhaustive results and comparisons. Despite that, interesting outcomes can still be drawn from this initial study. The lumped mass modelling technique and the birth-and-death implementation allowed to obtain a realistic behaviour of the skyline tensile force oscillations observed in the field. Therefore, coupled second-order oscillations given by the swaying payload (not included in the presented model) may not necessarily be included to obtain close-to-reality results in terms of force fluctuations. The regressions of mean CLA and MCLA over total load were forced through the origin as external tensile force tends to zero when mass is zeroed. The obtained regression coefficients from FEM aligned well with the field data. It has also been found that carriage speed has some inverse correlation with the MCLA.
This study confirms conclusions drawn by Pyles et al. (1994), where the skyline fundamental period of vibration (T1) is different from the theory of an oscillating taut cable. The total load is shown to strongly affect the fundamental period as confirmed by the fact that T1,cable<T1,outhaul<T1,inhaul. This reflects a general postulation where T1 is directly proportional to the root of the load. This is confirmed by the FEM outcomes but not by the observed values, and this might be the consequence of having included a relatively low number of observed cycles in the analysis. The difference of mean T1,inhaul could be associated to an oversimplification in the definition of the role played by the tailspar and tower yarder in the whole system. However, the aim of this work was to develop a relatively simple FEM able to reproduce, via time-dependent analyses, the skyline dynamics related to a suspended load moving along the cable, without excessive computational resources. Nevertheless, the results suggest that a parallel study to include the actual stiffness of supports and anchors (Saravi and Lyons 2004, Marchi et al. 2019) could enhance the global response of the model and further improve the calculation of CLA values.
Comparison of the FEM outputs to actual data showed a strong correlation. This is due to the fact that the six simulated cycles were actually characterised by no log-to-ground interaction. Therefore, dynamic amplification can be directly related to the actual motion of the hanging mass. However, no information can yet be given regarding the case of partial suspension, where bumpiness of the ground produces sudden acceleration/decelerations to the inhaul that might affect the dynamic behaviour of the skyline tensile forces. This fact has been partially confirmed in two of the six simulated work cycles, where sudden changes of the carriage speed produced significant CLA alterations. This outcome suggests another potential use of these types of models in future analyses.
5. Conclusions
The skyline tensile forces of 103 work cycles, observed on four different standing skyline cable lines, were compared with the calculations made for the same cycles through SkylineXL 18.0. The reliability of the software was particularly satisfying for the analysis of the actual skyline tensile forces. Although the dynamic loading was a significant aspect of the general performance of the software, the study showed that its limited effect is not likely to result in an unexpected safety issue. However, the study also highlighted the fact that reliable results in the tensile force calculations are linked to the proper consideration of the common practices of the set-up of cable lines (e.g., pretensioning procedures).
While SkylineXL could be considered appropriate for operational and practical purposes, this work showed how the evolution of computer technologies and modelling techniques allow to properly simulate the skyline tensile forces, including the dynamic oscillations due to the motion of the payload along the cable line. Further developments of finite element models should be focused on the integration of the log-to-ground interaction and on the investigation of the breakout force during lateral skidding. The use of finite element models, in particular, might be considered a valid solution for individuals interested in carrying out an in-depth analysis of the dynamic behaviour of tensile forces. These include equipment manufacturers and engineers involved in the design of standing skyline mobile tower yarders.
Acknowledgments
This research was partially funded by the Department of Land, Environment, Agriculture and Forestry, Università degli Studi di Padova under the Grant BIRD 2017 »SLOPE: tree Stability in cable Logging and safety of OPErators – Development of an alert system based on wireless and low-cost sensors« and partially by MITACS through the founding of a postdoctoral research fellow under the Elevate Program. The authors would also like to thank Lisa Ball (USDA Forest Service) and Steve Rheinberger (SkylineXL developer) for their support and collaboration in this study.
6. References
Ackerman, S., Immelman, A., McEwan, A., Naidoo, S., Upfold, S., 2017: South African cable yarding safety and operating handbook. Forest Engineering Southern Africa and Institute for Commercial Forestry Research.
Allman, M., Allmanová, Z., Jankovský, M., 2018: Is cable yarding a dangerous occupation? A Survey from the public and private sector. Central European Forestry Journal 64(2): 127–132. https://doi.org/10.1515/forj-2017-0038
Amishev, D., Evanson, T., Raymond, K., 2009: Felling and bunching on steep terrain–a review of the literature. FFR Technical Note 1(7): 1–10.
Björheden, R., 1991: Basic time concepts for international comparisons of time study reports. Journal of Forest Engineering 2(2): 33–39. https://doi.org/10.1080/08435243.1991.10702626
Bodenhausen, C., 1982: Skyline analysis program for use with extended memory programmable calculators. Master thesis, Oregon State University, Corvallis, 59 p.
Bont, L.G., Heinimann, H.R., 2012: Optimum geometric layout of a single cable road. European Journal of Forest Research 131(5): 1439–1448. https://doi.org/10.1007/s10342-012-0612-y
Carson, W.W., 1973: Dynamic characteristics of skyline logging cable systems. Ph.D. dissertation, University of Washington, Seattle, 236 p.
Carson, W.W., 1975: Programs for skyline planning. USDA forest service, Pacific northwest forest and range experiment station, Technical report PNW-31.
Carson, W.W., Mann, C.N., 1970: A technique for the solution of skyline catenary equations. USDA forest service, Pacific northwest forest and range experiment station, Research paper PNW-110.
Carson, W.W., Mann, C.N., 1971: An analysis of running skyline load path. USDA forest service, Pacific northwest forest and range experiment station, Research paper PNW-193.
Charland, J.W., Hernried, A.G., Pyles, M.R., 1994: Cable systems with elastic supporting elements. Journal of Structural Engineering 120(12): 3649–3665. https://doi.org/10.1061/(ASCE)0733-9445(1994)120:12(3649)
Chung, J., 1987: Development of a cable logging system analysis package for micro-computer. Master thesis, Oregon State University, Corvallis, 117 p.
Chung, W., Sessions, J., 2003: A computerized method for determining cable logging feasibility using a dem. In: Council on forest engineering (COFE) conference proceedings: »Forest operations among competing forest uses«, Bar Harbor.
Dupire, S., Bourrier, F., Berger, F., 2015: Predicting load path and tensile forces during cable yarding operations on steep terrain. Journal of Forest Research 21(1): 1–14. https://doi.org/10.1007/s10310-015-0503-4
Falk, G.D., 1981: Predicting the payload capability of cable logging systems including the effect of partial suspension. USDA forest service, Northeastern Forest Experlment Station, Research paper NE-479.
Feyrer, K., 2015: Wire ropes: Tension, endurance, reliability, Second Edi. Springer Berlin Heidelberg.
FITEC, 2005: Best practice guidelines for cable logging. Forest Industry Training and Education Council, Auckland, 130 p.
Harrill, H., Visser, R., 2016: Skyline tension behavior of rigging configurations used in New Zealand cable logging. In proceedings of the 2016 Council on Forest Engineering Annual Meeting, Vancouver.
Hartsough, B.R., 1993: Benefits of remote tension monitoring. LIRO Report, 18(23) Rotorua.
Heinimann, H.R., Stampfer, K., Loschek, J., Caminada, L., 2001: Perspectives on Central European cable yarding systems. In: The International Mountain Logging and 11th Pacific Northwest Skyline Symposium, Seattle.
Irvine, H.M., 1981: Cable Structures. The Massachusetts Institute of Technology.
Jarmer, C.B., Sessions, J., 1992: Logger-PC for improved logging planning. In: Schiess P, Sessions J (Eds) Proceedings of planning and omplementing future forest operations, international mountain logging and 8th Pacific Northwest skyline symposium, Bellevue.
Knobloch, C., Bont, L.G., 2018: A new method to compute mechanical properties of a cable road skyline. In: FORMEC 2018. Proceedings of the 51st international symposium on forest mechanization, Madrid.
Koszman, C., Evans, C., 2018: Harvestline yarder operations in British Columbias Kootenay Region. Info Note No. 1, FPInnovations, Vancouver.
Larson, R.S., 1978: Compendium of major cable logging systems. Published by Interforest AB, Lidingo, Stockholm, 112 p.
Liley, W.B., 1983: Cable logging handbook. New Zealand Logging Industry Research Association, Rotorua, 103 p.
Magee, L., 1990: R2 measures based on Wald and Likelihood Ratio Joint significance tests. The American Statistician 44(3): 250–253. https://doi.org/10.1080/00031305.1990.10475731
Marchi, L., Mologni, O., Trutalli, D., Scotta, R., Cavalli, R., Montecchio, L., Grigolato, S., 2019: Safety assessment of trees used as anchors in cable-supported tree harvesting based on experimental observations. Biosystems Engineering 186: 71–82. https://doi.org/10.1016/j.biosystemseng.2019.06.022
Mologni, O., Lyons, C.K., Zambon, G., Proto, A.R., Zimbalatti, G., Cavalli, R., Grigolato, S., 2019: Skyline tensile force monitoring of mobile tower yarders operating in the Italian Alps. European Journal of Forest Research 138(5): 847–862. https://doi.org/10.1007/s10342-019-01207-0
OR-OSHA, 2010: Yarding and loading handbook. Oregon Occupational Safety and Health Division, Salem, 184 p.
Pestal, E., 1961: Seilbahnen und seilkrane für holz un materialtransport. Verlag Georg Fromme & Co., Horn.
Pyles, M.R., Womack, K.C., Laursen, H.I., 1994: Dynamic characteristics of a small skyline logging system with a guyed tailspar. International Journal of Forest Engineering 6(1): 35–49. https://doi.org/10.1080/08435243.1994.10702664
Rheinberger, S., 2018: SkylineXL 18.0. Skyline profile and payload analysis. Downloaded on April 3, 2019. USFS PNW Forest Products Programs and Software.
Rheinberger, S., 2019: Personal communication, June 2019.
Safe Work Australia, 2013: Guide to managing risks in cable logging. Safe Work Australia, Canberra, 62 p.
Samset, I., 1985: Winch and cable systems. Construction work and forest operations. Nijhof and Junk Publishers, Springer Netherlands, Dordrecht, 533 p.
Saravi, A., Lyons, C.K., 2004: Finite element modeling of guyed back spars in cable logging. Canadian Journal of Forest Research 34(4): 817–828. https://doi.org/10.1139/x03-250
Session, J., 2002: LOGGERPC V. 4.0. Department of Forest Engineering, Oregon State University, Corvallis, OR, USA.
Spinelli, R., Marchi, E., Visser, R., Harrill, H., Gallo, R., Cambi, M., Neri, F., Lombardini, C., Magagnotti, N., 2017: Skyline tension, shock loading, payload and performance for a European cable yarder using two different carriage types. European Journal of Forest Research 136(1): 161–170. https://doi.org/10.1007/s10342-016-1016-1
Studier, D.D., Binkley, V.W., 1974: Cable logging systems. USDA Forest Service, Pacific Northwest Region, Division of Timber Management, Portland.
Tobey, A.C., 1980: Skyline analysis with log drag. Masters Project. Oregon State University, Corvallis, 117 p.
Tsioras, P.A., Rottensteiner, C., Stampfer, K., 2011: Analysis of accidents during cable yarding operations in Austria 1998–2008. Croatian Journal of Forest Engineering 32(2): 549–560.
Twito, R.H., McGaughey, R.J., Reutebuch, S.E., 1988: The SKYTOWER and SKYMOBILE Programs for locating and designing skyline harvest units. USDA Forest Service, Pacific Northwest Research Station, General technical report PNW- GTR-215, 35 p.
Visser, R., 1998: Tensions monitoring of forestry cable systems. Ph.D. dissertation, Bodenkultur University (BOKU), Wien, 188 p.
Visser, R., Harrill, H., 2017: Cable yarding in North America and New Zealand: a review of developments and practices. Croatian Journal of Forest Engineering 38(2): 209–217.
Womack, K.C., 1989: The dynamic behavior of a cable logging skyline and its effect on the tailspar. Ph.D. dissertation, Oregon State University, Corvallis, 106 p.
Womack, K.C., Pyles, M.R., Laursen, H.I., 1994: Computer model for dynamic skyline behaviour. International Journal of Forest Engineering 5(2): 55–62. https://doi.org/10.1080/08435243.1994.10702660
WorkSafe BC, 2006: Cable yarding systems handbook, 2nd edn. Workers’ Compensation Board of British Columbia, Vancouver, 204 p.
Yoshimura, T., Noba, T., 2013: Productivity analysis of thinning operations using a swing yarder on steep slopes in Western Japan. In: IUFRO 3.06 conference on forest operations in mountainous conditions. Honne, 35–36 p.
Zienkiewicz, O.C., Taylor, R.L., 2000: The Finite Element Method. Fifth edition Volume 1: The basis.
Zweifel, O., 1960: Seilbahnberechnung bei beidseitig verankerten Tragseilen. Schweizerische Bauzeitung
78(1/2): 11.
© 2020 by the authors. Submitted for possible open access publication under the
terms and conditions of the Creative Commons Attribution (CC BY) license (http://creativecommons.org/licenses/by/4.0/).
Authors’ addresses:
Omar Mologni, PhD *
e-mail: omar.mologni@ubc.ca
Assoc. prof. Dominik Röser, PhD
e-mail: dominik.roeser@ubc.ca
The University of British Columbia
Faculty of Forestry – Department of Forest Resources Management
2424 Main Mall
V6T 1Z4 – Vancouver, BC
CANADA
Luca Marchi, PhD
e-mail: luca.marchi@unipd.it
Assoc. prof. Stefano Grigolato, PhD
e-mail: Stefano.grigolato@unipd.it
Prof. Raffaele Cavalli, MSc
e-mail: raffaele.cavalli@unipd.it
Università degli Studi di Padova
Department of Land Environment Agriculture and Forestry
Viale dell’Università 16
35020 – Legnaro
ITALY
Assoc. prof. Kevin C. Lyons, PhD
e-mail: kevin.lyons@oregonstate.edu
Oregon State University
College of Forestry – Department of Forest Engineering, Resources and Management
311 Snell Hall
97331 – Corvallis, OR
USA
* Corresponding author
Received: July 15, 2019
Accepted: June 19, 2020
Original scientific paper