Tree Crown Defoliation Degree as a Predictor of Silver Fir (Abies alba Mill) and Norway Spruce (Picea abies (L.) Karst.) Timber Value
doi: https://doi.org/10.5552/crojfe.2026.4497
volume: 47, issue: 1
pp: 23
- Author(s):
-
- Ursić Branko
- Vusić Dinko
- Article category:
- Original scientific paper
- Keywords:
- tree decline, assortment structure, average tree value, wood defects
Abstract
HTML
Norway spruce (Picea abies (L.) Karst.) and silver fir (Abies alba Mill.) are both economically and ecologically important coniferous tree species in Europe. Due to climate change, both of them are affected by dieback. This paper examines the quantity, quality, and value of roundwood produced from healthy, severely defoliated (61–99%) and dead Norway spruce and silver fir trees. The study was conducted in four subcompartments located in the Forest Administration Delnice, Management Unit »Milanov vrh«. In total, 81 trees of silver fir (208.77 m3 of gross volume) and 83 trees of Norway spruce (208.43 m3 of gross volume) were measured. Study results showed that the measured gross volume of silver fir was by 8.29% higher than predicted by the harvesting plan, while the measured gross volume of Norway spruce was slightly higher by 0.90%. The determined assortment structure showed a negative correlation between tree crown defoliation degree and the share of highly valuable assortments for both researched species. Healthy trees of silver fir had the highest share of veneer logs, while dead silver fir trees had the highest share of pulpwood. Silver fir dead trees also had the highest share of waste (22.19%), while healthy and severely defoliated trees had 18.69% and 18.47%, respectively. In the case of Norway spruce, healthy trees had the highest share of veneer logs, while dead trees had the highest share of pulp wood. At the same time, the share of waste remains almost the same regardless of the tree crown defoliation degree (from 17.97% for dead trees to 18.17% for healthy trees). Results of the determined assortment structure reflected on the average tree value, which was also negatively impacted by the tree crown defoliation degree. In the case of silver fir, the value of dead trees along DBH classes was 25.6% to 41.6% lower than for healthy trees, while in the case of Norway spruce, the value of dead trees was 22.4% to 36.3% lower than that of healthy trees. The initial hypothesis that average tree value decreases in the order: healthy trees > severely defoliated trees > dead trees was confirmed. To improve harvesting plans, the inclusion of a tree crown defoliation degree as an additional predictor of assortment structure is strongly supported by the results of this study.
Tree Crown Defoliation Degree as a Predictor of Silver Fir (Abies alba Mill) and Norway Spruce (Picea abies (L.) Karst.) Timber Value
Branko Ursić, Dinko Vusić
https://doi.org/10.5552/crojfe.2026.4497
Abstract
Norway spruce (Picea abies (L.) Karst.) and silver fir (Abies alba Mill.) are both economically and ecologically important coniferous tree species in Europe. Due to climate change, both of them are affected by dieback. This paper examines the quantity, quality, and value of roundwood produced from healthy, severely defoliated (61–99%) and dead Norway spruce and silver fir trees. The study was conducted in four subcompartments located in the Forest Administration Delnice, Management Unit »Milanov vrh«. In total, 81 trees of silver fir (208.77 m3 of gross volume) and 83 trees of Norway spruce (208.43 m3 of gross volume) were measured. Study results showed that the measured gross volume of silver fir was by 8.29% higher than predicted by the harvesting plan, while the measured gross volume of Norway spruce was slightly higher by 0.90%. The determined assortment structure showed a negative correlation between tree crown defoliation degree and the share of highly valuable assortments for both researched species. Healthy trees of silver fir had the highest share of veneer logs, while dead silver fir trees had the highest share of pulpwood. Silver fir dead trees also had the highest share of waste (22.19%), while healthy and severely defoliated trees had 18.69% and 18.47%, respectively. In the case of Norway spruce, healthy trees had the highest share of veneer logs, while dead trees had the highest share of pulp wood. At the same time, the share of waste remains almost the same regardless of the tree crown defoliation degree (from 17.97% for dead trees to 18.17% for healthy trees). Results of the determined assortment structure reflected on the average tree value, which was also negatively impacted by the tree crown defoliation degree. In the case of silver fir, the value of dead trees along DBH classes was 25.6% to 41.6% lower than for healthy trees, while in the case of Norway spruce, the value of dead trees was 22.4% to 36.3% lower than that of healthy trees. The initial hypothesis that average tree value decreases in the order: healthy trees > severely defoliated trees > dead trees was confirmed. To improve harvesting plans, the inclusion of a tree crown defoliation degree as an additional predictor of assortment structure is strongly supported by the results of this study.
Keywords: tree decline, assortment structure, average tree value, wood defects
1. Introduction
Forests have always played an important role in providing many essential services such as biodiversity conservation and climate regulation (UNECE 2024), as well as the development of the economy and society, creating jobs and providing food, medicines, materials, clean water, and more (European Commission 2021). The trends in consumer preferences, as well as the price of the wood products and substitute products, population, and income levels, dictate demand for the forest products (Whiteman et al. 1999). For example, up to the 19th century, wood was mostly used as fuel, raw material for constructing, agriculture, crafts and shipbuilding (Gustavsson et al. 2006). Nowadays, the importance of forests is recognised through many European policies (Patacca et al. 2023) with the main goal to preserve healthy forest ecosystems and promote sustainable forest management. The necessity of preserving forest ecosystems lies in the significant negative impact of climate change and rising tree canopy mortality rate (Senf et al. 2021, Bledý et al. 2024), which potentially leads to increased volume of low-quality timber.
Norway spruce (Picea abies (L.) Karst.) and silver fir (Abies alba Mill.) are both recognised as economically and ecologically most valuable coniferous tree species in Europe (Dobrowolska et al. 2017, Spiecker 2000). In Croatian forests, both species represent 78.9% of coniferous state-owned growing stock, in which 62.0% are silver fir trees. Both tree species are significantly affected by climate change, resulting in increased mortality rates. In 2024, in 42.06% of silver fir trees, crown defoliation of more than 25% was observed, which is a decrease of 22.15% compared to 2016 (Potočić et al. 2025). In contrast to silver fir, in 59.3% of Norway spruce trees in Croatian forests, crown defoliation of more than 25% was observed, while in the region of Gorski Kotar, 96.2% trees showed crown defoliation of more than 25% (Matić 2011).
Forestry profitability is influenced by timber price, which strongly depends on timber quality and species (Knoke et al. 2005) that can be defined from different points of view. In technical terms, timber quality depends on the intrinsic characteristics, key attributes, and factors influencing its suitability for specific use (Nocetti et al. 2024, Jozsa and Middelton 1994, Mitchell 1961). An expanded definition of wood quality that includes all participants in the wood supply chain is provided by Zhang (1997), who defines wood quality as the wood characteristics that influence the value recovery chain and the serviceability of end products. Following that, having an accurate estimate of timber quality distribution provides strong benefits on many levels in the wood supply chain. For example, forest owners and forest managers can adopt silvicultural measures to increase wood quality (Nocetti et al. 2024), e.g., thinning is one of the main silvicultural measures used to increase timber quality (Speicker 2021, Goncalves 2021, Shifley 2002). Besides the silvicultural practice, site factors as well as genetics can also play a significant role in timber quality (Macdonald and Hubert 2002). Further, during the stand rotation, numerous natural disturbances can occur that can negatively influence conditions in which the stands are developing and possibly influence timber quality. In the past decade in Crotaian forests, three significant events occurred, which resulted in an increased amount of sanitary felling (Đuka et al. 2025). The first and second events were in the Gorski Kotar region (ice storm in 2014 and bark beetle outbreak in 2017), and the last one was a windstorm in 2023 in the Slavonia region (Đuka et al. 2025).
In general, timber quality can be determined by measuring visual tree/roundwood features (e.g. dimensions and present wood defects) or by testing timber as material to determine its suitability for a specific purpose (e.g. tension strength, tension modulus of elasticity, etc.). Visual assessment of the timber quality can be done on standing trees, when grading produced roundwood, or after sawmill processing, with the latter being the most accurate (Karaszewski et al. 2013) due to the impossibility of assessing all wood defects in standing trees (Marenče et al. 2020). In Croatian forestry, assessment of timber quality is performed on the felling site or on the landing. It is based on measuring roundwood dimensions (diameter and length), determining and measuring present wood defects, and classifying roundwood into quality classes following the standard used.
The tree crown defoliation degree is an often used indicator of tree health and vigor (Ferretti et al. 2021), and it is also used as an indicator of air contamination (Augustaitis et al. 2010). Overall, many studies were focused on the correlation between tree crown defoliation degree and different types of stressors (Popa et al. 2017), to improve mortality models (Paixo et al. 2019), and to improve growth rate models (Dobbertin and Brank 2001).
In Croatian forestry, tree crown defoliation is used as a criteria when marking trees for felling, resulting with the number of live and dead marked trees at subcompartment level. This distribution is further used in creating harvesting plans, e.g., calculations of gross and net harvesting volume, quality distribution, and expected value of marked trees. Since the recent studies (Ursić et al. 2025, Ursić and Vusić 2025) showed discrepancies between expected and actual average tree value as well as differences along tree crown defoliation degree classes, this research aimed to determine:
quantity and quality of produced silver fir and Norway spruce assortments from dieback-affected trees
correlation between tree crown defoliation degree and wood defect presence
level of value reduction of dieback-affected trees.
The Initial hypothesis of this research was that average tree value reduction is in the following order: healthy trees > severely defoliated trees > dead trees.
2. Materials and Methods
2.1 Sample Preparation
The study was conducted in four subcompartments located in Forest Administration Delnice, Management Unit »Milanov vrh« (Table 1), where a combination of selective and salvage felling of silver fir and Norway spruce was performed. Tree marking was performed by Croatian experts from the company »Croatian Forests« Ltd., Zagreb, after which sample trees were randomly chosen. Sample trees were chosen based on their diameter at breast height (DBH) and tree crown defoliation degree (TCDD). Two perpendicular diameters at breast height (1.3 m above ground) were measured from the upper side of the slope. The tree crown defoliation degree was determined via visual estimation of crown area without needles. Following the ICP guidelines for visual assesment of the crown condition and damaging agents (Eichhorn et al. 2020), first, the healthy and undefoliated trees (of both investigated tree species) were found, and then they were used as reference trees after which defoliation degree of defoliated tree was determined. Based on the TCDD, trees were classified in the following classes: healthy tree (H) if crown defoliation was less than 25%; severely defoliated tree (S) if the crown defoliation was 61–99%, and dead tree (D) if the crown was 100% defoliated (Fig. 1).
Table 1 Data on research locations and stand characteristics
|
Subcompartment |
12b |
14a |
53a |
55a |
|
|
Coordinates |
φ 45°36′56″ N λ 14°33′01″ E |
φ 45°36′50″ N λ 14°33′40″ E |
φ 45°38′57″ N λ 14°34′27″ E |
φ 45°39′11″ N λ 14°35′19″ E |
|
|
Area, ha |
49.00 |
24.64 |
46.26 |
41.03 |
|
|
Phytocenosis |
Omphalodo-Fagetum / Tregubov 1957 corr. Puncer 1980 / Marinček et al. 1993 |
Aremonio-Piceetum Horvat 1938 |
|||
|
Inclination, ° |
15–35 |
5–20 |
0–20 |
0–20 |
|
|
Stocking |
1.04 |
0.99 |
0.71 |
0.92 |
|
|
Basal area m2/ha |
European beech (Fagus sylvatica L.) |
12.51 |
10.63 |
3.42 |
6.08 |
|
Siver fir (Abies alba Mill) |
13.67 |
16.87 |
15.87 |
20.02 |
|
|
Norway spruce (Picea abies (L.) Karst. ) |
4.44 |
3.83 |
6.86 |
8.02 |
|
|
Scots pine (Pinus sylvestris L.) |
– |
– |
0.05 |
– |
|
|
OHB |
1.06 |
0.58 |
0.52 |
0.74 |
|
|
Growing stock, m3/ha |
403.0 |
365.0 |
321.0 |
482.0 |
|
|
Species composition, % |
European beech (Fagus sylvatica L.) |
39.4 |
30.7 |
8.1 |
12.6 |
|
Siver fir (Abies alba Mill) |
43.6 |
55.3 |
59.4 |
61.7 |
|
|
Norway spruce (Picea abies (L.) Karst. ) |
13.3 |
12.4 |
30.9 |
24.0 |
|
|
Scots pine (Pinus sylvestris L.) |
– |
– |
0.3 |
– |
|
|
OHB |
3.7 |
1.6 |
1.3 |
1.7 |
|
|
OHB — other hard broadleaves |
|||||
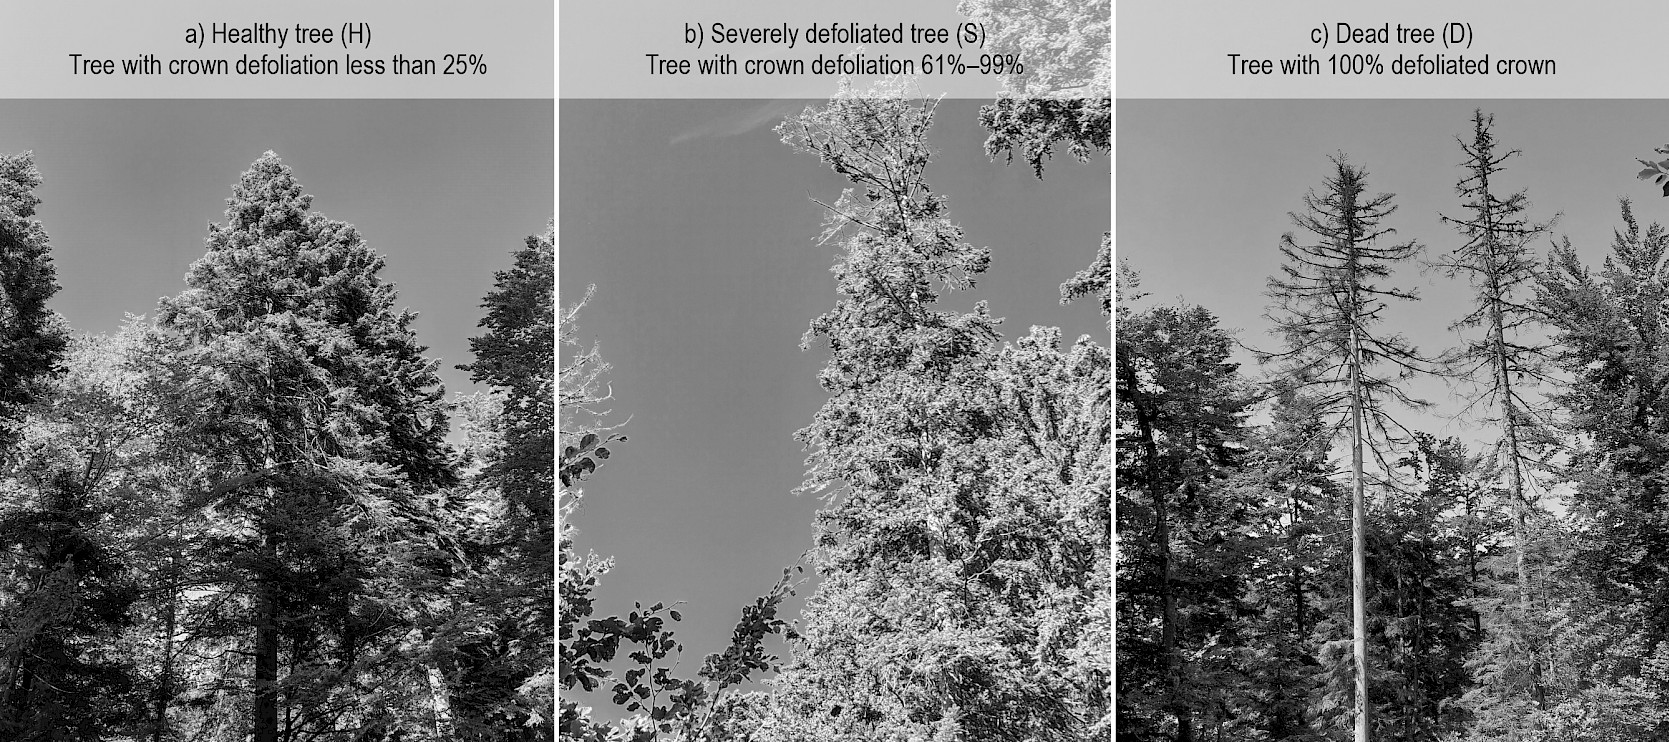
Fig. 1 Tree crown defoliation degree classes
2.2 Tree Measurements
After sample trees were chosen, they were cut and processed into logs following the HRN standard (HRN D.B4.021, 1979; HRN D.B4.029, 1979; HRN D.B5.020, 1979), which classifies logs into grades based on their potential end use. Following the HRN standard, it was possible to produce veneer logs (VL), saw logs of the first quality class (SLI), saw logs of the second quality class (SLII), saw logs of the third quality class (SLIII), and pulp wood (PW). Additionally, quality classes were assigned according to the HRN EN 1927-1:2008 standard, where grades are based only on the wood quality without indication of the wood end use. To assign the assortment class, the entrance criteria were dimensions of the produced log and present wood defects. Both standards have specific requirements for volume determination as stated in Table 2. On the tree level, measurements were performed in order to record actual log dimensions. The actual log length was measured with an accuracy of 0.01 m, and two mid-length over-bark diameters were measured with an accuracy of 0.1 cm. Additionally, in the case of a but log, the length of the notch cut was also measured with an accuracy of 0.01 m, as well as the unprocessed crown length.
Table 2 Prescribed volume determination rules used by standards
|
Standard |
JUS D.B0.022 |
HRN EN 1309-2 |
|
Length |
The shortest length is measured with an accuracy of at least one centimetre Timber with a notch cut or butt trimming should be measured from the end of the notch cut or butt trimming surface Length is rounded to the nearest 1/4 m The length allowance for the saw logs is minimum 5 cm and maximum 20 cm. |
The shortest length is measured with an accuracy of at least one centimetre Timber with a notch cut or butt trimming should be measured from the middle of the notch cut or butt trimming surface The length is expressed in metres rounded down to one decimal place The length allowance is not given. |
|
Diameter |
Measured two mid-length under bark diameters to an accuracy of at least one centimetre In case of an over-bark measure, conversion to an under-bark diameter is necessary The arithmetic mean of two measurements is rounded down to the nearest centimetre. |
Measured two mid-length under bark diameters to an accuracy of at least one centimetre In case of an over-bark measure, conversion to an under-bark diameter is necessary The arithmetic mean of two measurements is rounded down to the nearest centimetre. |
|
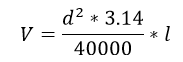
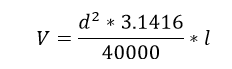
Volume calculation |
|
|
|
V – log volume l – log length d – log diameter |
||
The presence of wood defects was visually determined on the log cross-section and bark. If wood defects were present, additional measurements were performed to assess the significance of present wood defects (e.g., knot size and frequency), and their influence on assortment quality. The presence of wood defects that did not allow the log classification into the highest quality class, if the dimensions criteria were met, was recorded. All data were recorded using UMTPlus Max 20.1.12 software, in which the interface was modified to allow recording data on the log dimensions, present wood defects, and quality classes on the tree level (Ursić and Vusić 2025).
2.3 Data Processing
After field measurements were done, the collected data was transformed from the UMTPlus software to the MS Excel 2412 data sheet. The database created in MS Excel was checked to determine the correctness of the data. For both investigated species, distributions of sampled trees regarding five-centimetre-wide DBH classes and TCDD classes were made. For each measured tree part with over-bark top diameter greater than 7 cm, gross volume was calculated based on the measured length and over-bark diameter using Huber's formula. The tree gross volume was calculated by adding up the single tree part gross volumes. Log net volume was calculated based on the rounded dimensions according to the prescribed rules by the standard used, after which the tree net volume was calculated by adding single log net volume on the tree level. Based on the price list (fco. forests road) provided by »Croatian Forests« Ltd. (2025), the value of a single log and a single tree was calculated, after which the average tree value was calculated by dividing the total tree value by the net tree volume determined following HRN standard. Expected gross harvesting volume was calculated using single-entry volume tables prescribed by »Croatian Forests« Ltd.
The influence of wood defect presence on the timber grading was determined using MS Excel software. Log dimensions and minimum dimensions prescribed by the HRN standard for a particular quality class were used to determine how many logs could potentially be classified into a particular quality class, but they were not, because of present wood defects. Further, the number of present wood defects across the quality classes and TCDD classes was expressed as a percentage of the total number of wood defects in each quality class and in each TCDD class. Additionally, the presence of wood defects was presented regarding the ordinal number of logs in the tree and by the average height of wood defects on the tree. The average height of wood defects was calculated based on the logs length, e.g., for the second log in the tree, the length of the first log and half the length of the second log were summed up to express the average height of those wood defect.
To perform statistical analyses, TIBCO Statistica 14.0.0.15 software was employed. The multiple linear regression analysis was used to determine the influence of tree height and tree diameter on the actual gross and net tree volume across TCDD. The influence of TCDD classes on the average tree value was determined by calculating the percentage deviation (ΔEUR/m3, %) between the average healthy tree value and the average tree value of severely defoliated and dead trees along DBH classes. Additionally, a t-test was used to determine whether discrepancies between expected and determined gross volume, and between determined net HRN and net HRN EN volume are statistically significant. Analysis of variance was used to determine the influence of DBH and TCDD class on net HRN volume and average tree value (EUR/m3). If the analysis of variance showed statistically significant differences, the Unequal N HSD post-hoc test was used to determine significant difference. Descriptive statistics were used to present average, standard deviation, minimum, and maximum values of roundwood length, diameter, gross volume, and net HRN volume across tree species, quality classes, and TCDD classes. For all statistical tests, statistical significance was accepted at α<0.05.
3. Results
In total, 81 trees of silver fir and 83 trees of Norway spruce were sampled. Distribution of sampled trees in terms of TCDD and DBH classes is shown in Table 3.
Table 3 Number of sampled trees in terms of tree species, DBH, and TCDD classes
|
Tree species |
Silver fir |
Norway spruce |
||||
|
DBH, cm |
H |
S |
D |
H |
S |
D |
|
37.5 |
5 |
3 |
5 |
6 |
5 |
3 |
|
42.5 |
6 |
6 |
7 |
6 |
7 |
6 |
|
47.5 |
7 |
6 |
6 |
4 |
6 |
4 |
|
52.5 |
7 |
6 |
7 |
5 |
8 |
5 |
|
57.5 |
2 |
3 |
5 |
5 |
7 |
6 |
|
Total |
27 |
24 |
30 |
26 |
33 |
24 |
|
DBH – diameter class; H – tree with crown defoliation less than 25%; S – tree with crown defoliation 61%–99%; D – tree with 100% defoliated crown |
||||||
3.1 Gross and Net Volume
The parameters of multiple regression showed statistically significant influence of tree height and diameter at breast height on the measured gross volume for both researched species, regardless of tree crown defoliation degree (Table A1 and A4). The measured gross volume of silver fir amounted to 208.77 m3 and of Norway spruce to 208.43 m3. For silver fir, the measured gross volume was 8.29% higher compared to the expected gross volume calculated using prescribed single-entry volume tables. In the case of Norway spruce, prescribed single-entry volume tables also predicted lower gross volume, but only by 0.90%. Parameters of the t-test (Table 4) showed no statistically significant differences between measured and expected gross volume for silver fir (p=0.1035) and Norway spruce (p=0.8695).
Table 4 t-test parameters of determined and expected gross volume (m3)
|
Tree species |
Mean D |
Mean E |
t-value |
df |
p |
N |
SD D |
SD E |
F-ratio variances |
p variance |
|
Silver fir |
2.5774 |
2.3637 |
1.6376 |
160.0000 |
0.1035 |
81 |
0.9213 |
0.7285 |
1.5993 |
0.0372 |
|
Norway spruce |
2.5112 |
2.4886 |
0.1646 |
164.0000 |
0.8695 |
83 |
0.9297 |
0.8403 |
1.2242 |
0.3615 |
|
D – determined gross volume; E – expected gross volume; SD – standard deviation |
||||||||||
According to the HRN standard, the total calculated net volume was 167.05 m3 and 170.76 m3 for silver fir and Norway spruce, respectively. According to the HRN EN standard, the calculated net volume was 1.95% higher for silver fir and 2.25% higher for Norway, without statistically significant differences for both investigated species (Table 5).
Table 5 t-test parameters of determined HRN and HRN EN net volume (m3)
|
Tree species |
Mean HRN |
Mean HRN EN |
t-value |
df |
p |
N |
SD HRN |
SD HRN EN |
F-ratio variances |
p variance |
|
Silver fir |
2.0623 |
2.1026 |
–0.3361 |
160.0000 |
0.7373 |
81 |
0.7559 |
0.7695 |
1.0362 |
0.8741 |
|
Norway spruce |
2.0573 |
2.1035 |
–0.3823 |
164.0000 |
0.7027 |
83 |
0.7685 |
0.7897 |
1.0558 |
0.8063 |
|
HRN – net volume according to HRN standard; HRN EN – net volume according to HRN EN standard; SD – standard deviation |
||||||||||
Except for the prescribed volume calculation rules, both HRN and HRN EN net volumes were significantly influenced by DBH and tree height along both researched species and TCDD classes (Table A2, A3, A5, and A6). Additionally, analysis of variance showed no statistically significant influence of TCDD class on the determined HRN net volume (Table 6).
Table 6 Influence of TCDD and DBH classes on the net HRN volume (m3)
|
Tree species |
Effect |
Degr. of freedom |
SS |
MS |
F |
p |
|
Silver fir |
Intercept |
1 |
313.9134 |
313.9134 |
2246.356 |
<0.000001 |
|
TCDD |
2 |
0.0634 |
0.0317 |
0.227 |
0.797726 |
|
|
DBH |
4 |
34.9820 |
8.7455 |
62.582 |
<0.000001 |
|
|
TCDD*DBH |
8 |
0.4461 |
0.0558 |
0.399 |
0.917219 |
|
|
Error |
66 |
9.2231 |
0.1397 |
– |
– |
|
|
Norway spruce |
Intercept |
1 |
309.2852 |
309.2852 |
2099.578 |
<0.000001 |
|
TCDD |
2 |
0.2083 |
0.1042 |
0.707 |
0.496690 |
|
|
DBH |
4 |
36.3802 |
9.0951 |
61.742 |
<0.000001 |
|
|
TCDD*DBH |
8 |
0.3494 |
0.0437 |
0.297 |
0.964785 |
|
|
Error |
68 |
10.0170 |
0.1473 |
– |
– |
|
|
TCDD – tree crown defoliation degree; DBH – diameter at breast height; SS – sum of squares; MS – mean square |
||||||
3.2 Features of Produced Roundwood
Descriptive statistics of produced roundwood are shown in Appendix A Table A7 for silver fir and Table A8 for Norway spruce. In total, 326 logs of silver fir and 367 logs of Norway spruce were produced. Regarding the quality classes, 3 VL, 34 SLI, 80 SLII, 84 SLIII, and 125 PW were produced from silver fir trees, and 5 VL, 26 SLI, 84 SLII, 125 SLIII, and 127 PW were produced from Norway spruce trees.
The first criteria that must be met to classify a log into a particular quality class are dimensions. Furthermore, information about log under-bark diameter is important when the unit price is created based on the quality class and diameter class, which is the case in the Croatian forestry. The deviation in under-bark log diameter along TCDD classes and quality classes is shown in Fig. 2a for silver fir and in Fig. 2b for Norway spruce. It is obvious that the average log diameter depends on the TCDD class since healthy trees almost always had a smaller average diameter along quality classes, except in the case of silver fir, where SLI logs produced from healthy trees had slightly higher average under-bark diameter. This trend is probably caused by the presence of wood defects. Namely, the second criteria during roundwood grading were the allowed wood defects prescribed by the standard used. Based on the results, it seems that the lower part of dead trees had a higher share of unallowed wood defects in comparison to the H and S trees, because of which they were classified into lower quality classes regardless of their dimensions. Following that, additional analysis was done to detect whether the share of wood defects depends on the TCDD class.
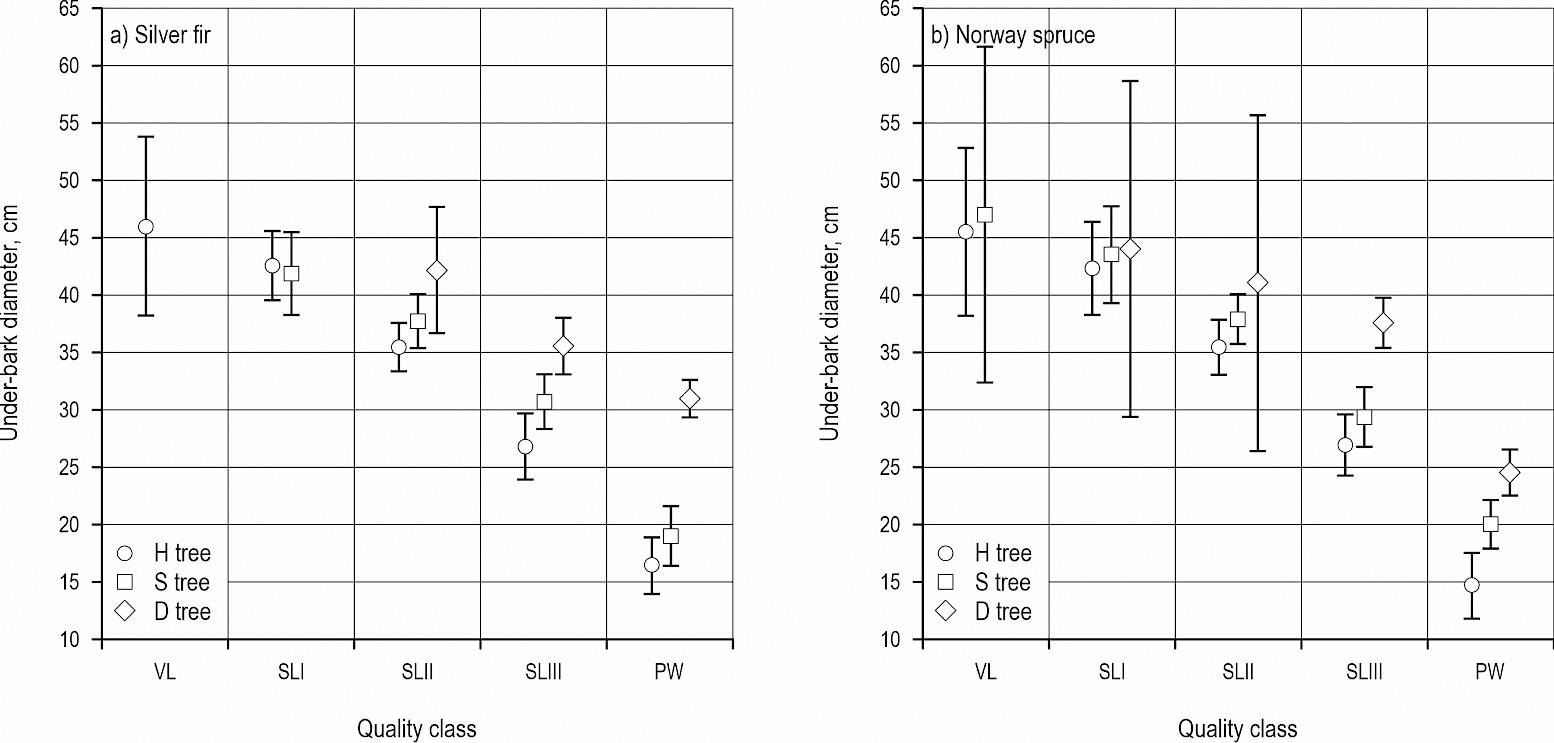
Fig. 2 Under-bark diameter along quality classes and tree crown defoliation classes (vertical bars denote 0.95 confidence intervals)
3.2.1 Influence of Wood Defects on Silver fir Roundwood Grading
In the total number of wood defects, rot accounted for the highest share (23.5%) followed by intergrown sound knots (23.1%), unsound knots (18.3%), covered knots (12.8%), sound dead knots (11.7%), insect holes bigger than 3.0 mm (6.0%),insect holes smaller than 3.0 mm (3.3%) and stain (1.4%). The number of logs that could be potentially classified into a particular quality class based on their dimensions, but were not, as well as the share of determined wood defects (by number of occurrences) that negatively affect log quality are shown in Table 7. In total, 136 silver fir potential veneer logs were mostly declassified because of: covered knots in the case of H trees; unsound knots in the case of S trees; and rot in the case of D trees. Potential silver fir veneer logs were mostly declassified into SLI and SLII classes in the case of H and S trees, while in the case of D trees they were mostly declassified into SLIII and PW classes. Silver fir potential SLI logs were mostly declassified because of intergrown sound knots in the case of H and S trees, while in the case of D trees the main reason was rot. Generally, intergrown sound knots were the most frequent limiting factor for logs produced from H trees to be classified into the highest quality class (based on their dimensions), while rot and insect holes were the most limiting factors in the case of D trees.
Table 7 Share (%) of present wood defects along quality classes and TCDD classes on measured silver fir logs
|
TCDD |
QC |
N |
Covered knots |
Intergrown sound knots |
Dead sound knots |
Unsound knots |
Stain |
Rot |
Insect holes >3.00 mm |
Insect holes <3.00 mm |
|
|
Declassified VL |
Healthy fir tree |
I |
20 |
50.00 |
36.36 |
4.55 |
9.09 |
– |
– |
– |
– |
|
II |
23 |
25.00 |
28.85 |
11.54 |
30.77 |
3.85 |
– |
– |
– |
||
|
PW |
1 |
– |
– |
– |
– |
– |
100.00 |
– |
– |
||
|
Total |
44 |
32.00 |
30.67 |
9.33 |
24.00 |
2.67 |
1.33 |
– |
– |
||
|
Severely defoliated fir tree |
I |
12 |
50.00 |
14.29 |
14.29 |
21.43 |
– |
– |
– |
– |
|
|
II |
20 |
17.95 |
28.21 |
7.69 |
38.46 |
7.69 |
– |
– |
– |
||
|
III |
11 |
4.55 |
22.73 |
31.82 |
36.36 |
– |
4.55 |
– |
– |
||
|
PW |
1 |
– |
– |
– |
– |
– |
100.00 |
– |
– |
||
|
Total |
44 |
19.74 |
23.68 |
15.79 |
34.21 |
3.95 |
2.63 |
– |
– |
||
|
Dead fir tree |
II |
6 |
36.36 |
– |
27.27 |
9.09 |
9.09 |
– |
18.18 |
– |
|
|
III |
17 |
12.50 |
12.50 |
10.00 |
20.00 |
– |
15.00 |
17.50 |
12.50 |
||
|
PW |
25 |
– |
2.63 |
2.63 |
2.63 |
– |
60.53 |
23.68 |
7.89 |
||
|
Total |
48 |
10.11 |
6.74 |
8.99 |
11.24 |
1.12 |
32.58 |
20.22 |
8.99 |
||
|
Declassified SLI |
Healthy fir tree |
II |
18 |
18.42 |
39.47 |
23.68 |
18.42 |
– |
– |
– |
– |
|
III |
15 |
4.76 |
61.9 |
4.76 |
23.81 |
– |
4.76 |
– |
– |
||
|
Total |
33 |
13.56 |
47.46 |
16.95 |
20.34 |
– |
1.69 |
– |
– |
||
|
Severely defoliated fir tree |
II |
13 |
18.52 |
29.63 |
18.52 |
29.63 |
3.70 |
– |
– |
– |
|
| III |
16 |
3.45 |
51.72 |
24.14 |
20.69 |
– |
– |
– |
– |
||
|
PW |
3 |
– |
33.33 |
– |
33.33 |
– |
33.33 |
– |
– |
||
|
Total |
32 |
10.17 |
40.68 |
20.34 |
25.42 |
1.69 |
1.69 |
– |
– |
||
|
Dead fir tree |
III |
12 |
7.41 |
18.52 |
18.52 |
11.11 |
– |
14.81 |
14.81 |
14.81 |
|
|
PW |
24 |
3.03 |
3.03 |
– |
9.09 |
– |
54.55 |
27.27 |
3.03 |
||
|
Total |
36 |
5.00 |
10.0 |
8.33 |
10.0 |
– |
36.67 |
21.67 |
8.33 |
||
|
Declassified SLII |
Healthy fir tree |
III |
7 |
– |
55.56 |
22.22 |
22.22 |
– |
– |
– |
– |
|
PW |
3 |
– |
100.00 |
– |
– |
– |
– |
– |
– |
||
|
Total |
10 |
– |
60.00 |
20.00 |
20.00 |
– |
– |
– |
– |
||
|
Severely defoliated fir tree |
III |
5 |
12.50 |
25.00 |
25.00 |
25.00 |
– |
12.5 |
– |
– |
|
|
PW |
4 |
– |
50.00 |
– |
– |
– |
50.00 |
– |
– |
||
|
Total |
9 |
10.00 |
30.00 |
20.00 |
20.00 |
– |
20.00 |
– |
– |
||
|
Dead fir tree |
III |
1 |
– |
– |
– |
– |
– |
50.00 |
– |
50.00 |
|
|
PW |
6 |
– |
14.29 |
14.29 |
14.29 |
– |
42.86 |
– |
14.29 |
||
|
Total |
7 |
– |
11.11 |
11.11 |
11.11 |
– |
44.44 |
– |
22.22 |
||
|
Declassified SLIII |
Healthy fir tree |
PW |
3 |
– |
100.00 |
– |
– |
– |
– |
– |
– |
|
Severely defoliated fir tree |
PW |
3 |
– |
100.00 |
– |
– |
– |
– |
– |
– |
|
|
Dead fir tree |
PW |
3 |
– |
100.00 |
– |
– |
– |
– |
– |
– |
|
Except for the share of each wood defect, additional analysis was done to determine wood defect presence according to the ordinal number of the log in the tree (Fig. 3) and according to the height of the wood defect (Fig. 4). The appearance of knots by their type follows a logical trend where the lowest part of the tree mostly had covered knots, and by rising height knots appeared in the following order: unsound knots, sound dead knots and intergrown sound knots. Further, stain as an initial stage of rot was present only on the lowest part of the tree along all TCDD classes, while rot was present in the higher parts of D trees in comparison to H and S trees.
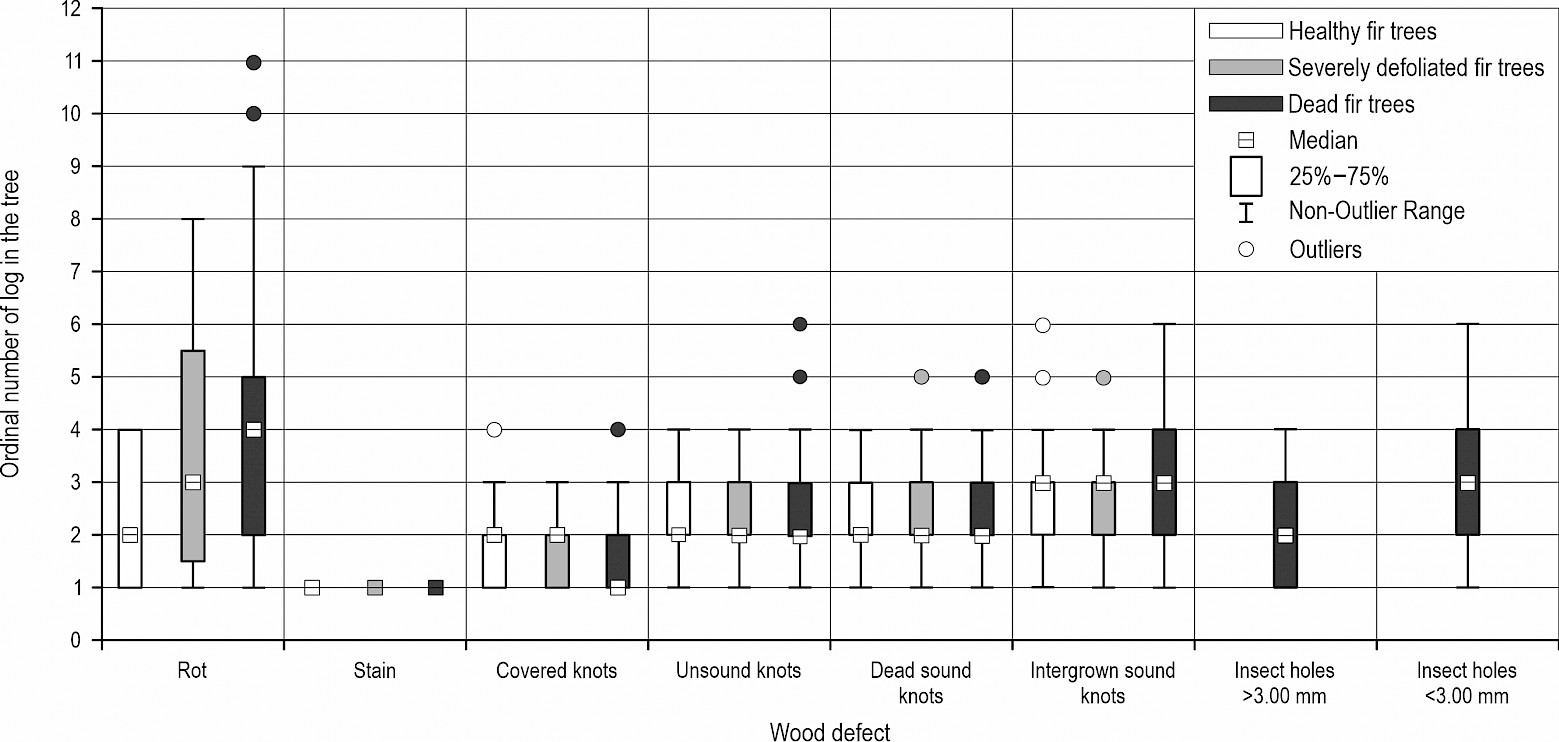
Fig. 3 The average ordinal number of log in the tree where wood defect was present
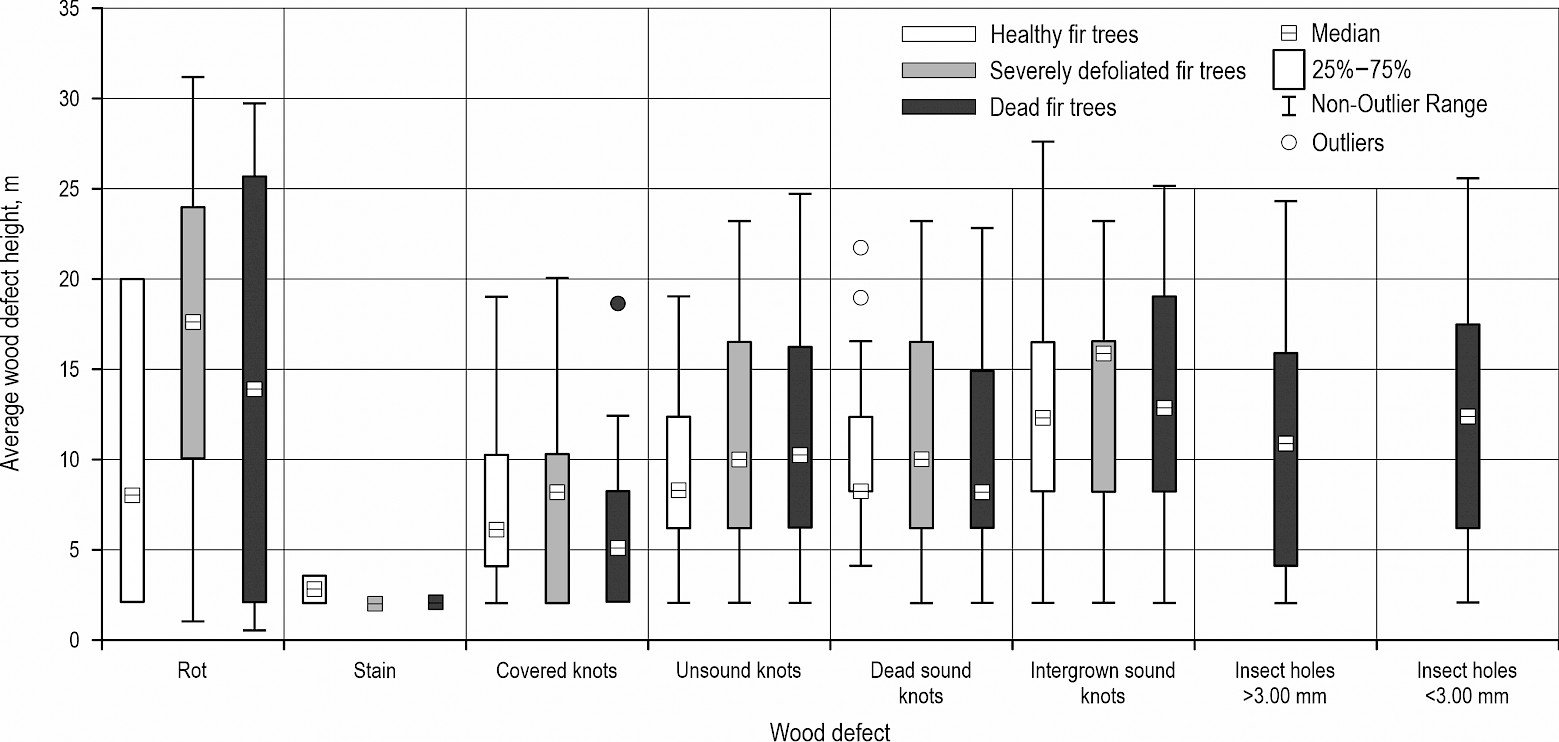
Fig. 4 The average height (m) of wood defects
3.2.2 Influence of Wood Defects on Norway Spruce Roundwood Grading
In the total number of wood defects, intergrown sound knots accounted for the highest share (33.1%) followed by covered knots (15.7%), sound dead knots (13.0%), rot (12.8), insect holes smaller than 3.0 mm (9.1%), unsound knots (6.6%), stain (5.5%) and insect holes bigger than 3.0 mm (4.2%). The number of logs that could be potentially classified into a particular quality class based on their dimensions, but were not, as well as the share of determined wood defects (by number of occurrences) that negatively affect log quality are shown in Table 8. In total, 136 Norway spruce potential veneer logs were declassified because of: intergrown sound knots in the case of H trees; covered knots in the case of S trees; and rot in the case of dead trees. Potential Norway spruce VL were mostly declassified into SLI and SLII classes in the case of H and S trees, while in the case of D trees, they were mostly declassified into the SLIII class. Potential Norway spruce SLI logs were mostly declassified because of intergrown sound knots in the case of H and S trees, while in the case of dead trees, the main reason for declassification was rot. Generally, the same trend as in the case of silver fir was found for Norway spruce; intergrown sound knots were the most frequent limiting factor for logs produced from H trees to be classified into the highest quality class (based on their dimensions), while rot and insect holes were the most limitating factors in the case of D trees.
Table 8 Share (%) of present wood defects along quality classes and TCDD classes on measured Norway spruce logs
|
TCDD |
QC |
N |
Covered knots |
Intergrown sound knots |
Dead sound knots |
Unsound knots |
Stain |
Rot |
Insect holes >3.00 mm |
Insect holes <3.00 mm |
|
|
Declassified VL |
Healthy spruce tree |
I |
12 |
43.75 |
43.75 |
12.50 |
– |
– |
– |
– |
– |
|
II |
20 |
17.5 |
45.00 |
15.00 |
17.50 |
2.50 |
– |
– |
2.50 |
||
|
III |
2 |
– |
50.00 |
– |
25.00 |
– |
25.00 |
– |
– |
||
|
Total |
34 |
23.33 |
45.00 |
13.33 |
13.33 |
1.67 |
1.67 |
– |
1.67 |
||
|
Severely defoliated spruce tree |
I |
11 |
50.00 |
18.75 |
25.00 |
6.25 |
– |
– |
– |
– |
|
|
II |
33 |
28.33 |
33.33 |
15.00 |
11.67 |
8.33 |
– |
– |
3.33 |
||
|
III |
10 |
16.67 |
20.83 |
16.67 |
20.83 |
– |
12.50 |
– |
12.50 |
||
|
PW |
7 |
12.5.0 |
– |
– |
– |
– |
87.50 |
– |
– |
||
|
Total |
61 |
27.78 |
25.93 |
15.74 |
12.04 |
4.63 |
9.26 |
– |
4.63 |
||
|
Dead spruce tree |
I |
1 |
100.00 |
– |
– |
– |
– |
– |
– |
– |
|
|
II |
1 |
50.00 |
– |
– |
– |
– |
– |
– |
50.00 |
||
|
III |
30 |
5.36 |
7.14 |
5.36 |
3.57 |
19.64 |
26.79 |
14.29 |
17.86 |
||
|
PW |
9 |
– |
7.69 |
– |
– |
– |
46.15 |
23.08 |
23.08 |
||
|
Total |
41 |
6.94 |
6.94 |
4.17 |
2.78 |
15.28 |
29.17 |
15.28 |
19.44 |
||
|
Declassified SLI |
Healthy spruce tree |
II |
16 |
29.03 |
38.71 |
22.58 |
6.45 |
3.23 |
– |
– |
– |
|
III |
18 |
9.09 |
77.27 |
9.09 |
– |
– |
– |
– |
4.55 |
||
|
PW |
1 |
– |
100.00 |
– |
– |
– |
– |
– |
– |
||
|
Total |
35 |
20.37 |
55.56 |
16.67 |
3.70 |
1.85 |
– |
– |
1.85 |
||
|
Severely defoliated spruce tree |
II |
13 |
14.81 |
44.44 |
22.22 |
11.11 |
– |
– |
– |
7.41 |
|
|
III |
26 |
8.89 |
53.33 |
22.22 |
2.22 |
– |
6.67 |
– |
6.67 |
||
|
Total |
39 |
11.11 |
50.00 |
22.22 |
5.56 |
– |
4.17 |
– |
6.94 |
||
|
Dead spruce tree |
III |
14 |
– |
5.56 |
– |
– |
27.78 |
27.78 |
22.22 |
16.67 |
|
|
PW |
12 |
4.55 |
18.18 |
9.09 |
– |
4.55 |
36.36 |
13.64 |
13.64 |
||
|
Total |
26 |
2.50 |
12.50 |
5.00 |
– |
15.00 |
32.50 |
17.50 |
15.00 |
||
|
Declassified SLII |
Healthy spruce tree |
III |
9 |
– |
75.00 |
25.00 |
– |
– |
– |
– |
– |
|
Total |
9 |
– |
75.00 |
25.00 |
– |
– |
– |
– |
– |
||
|
Severely defoliated spruce tree |
III |
13 |
– |
76.92 |
15.38 |
– |
– |
– |
– |
7.69 |
|
|
PW |
4 |
– |
– |
– |
– |
– |
– |
– |
100.00 |
||
|
Total |
17 |
– |
71.43 |
14.29 |
– |
– |
– |
– |
14.29 |
||
|
Dead spruce tree |
III |
1 |
– |
– |
– |
– |
– |
50.00 |
– |
50.00 |
|
|
PW |
9 |
16.67 |
– |
– |
– |
16.67 |
33.33 |
– |
33.33 |
||
|
Total |
10 |
12.50 |
– |
– |
– |
12.50 |
37.5 |
– |
37.50 |
||
|
Declassified SLIII |
Severely defoliated spruce tree |
PW |
4 |
– |
– |
– |
– |
– |
– |
– |
100.00 |
|
Dead spruce tree |
PW |
9 |
16.67 |
– |
– |
– |
16.67 |
33.33 |
– |
33.33 |
|
The presence of wood defects according to the ordinal number of the log in the tree is shown in Fig. 5, and according to the height of wood defect in Fig. 6. The same trend of knots appearing as for silver fir is noticed in the case of Norway spruce; knots appear by height in the following order: covered knots < unsound knots < sound dead knots < intergrown sound knots. Appearance of rot was also noticed in higher parts of D trees compared to H and S trees. Furthermore, in the case of the knots (for both investigated species), the average height of their appearance was quite similar regardless of TCDD class, indicating that growing conditions, management measures, and species characteristics may have had a stronger influence than TCDD class.
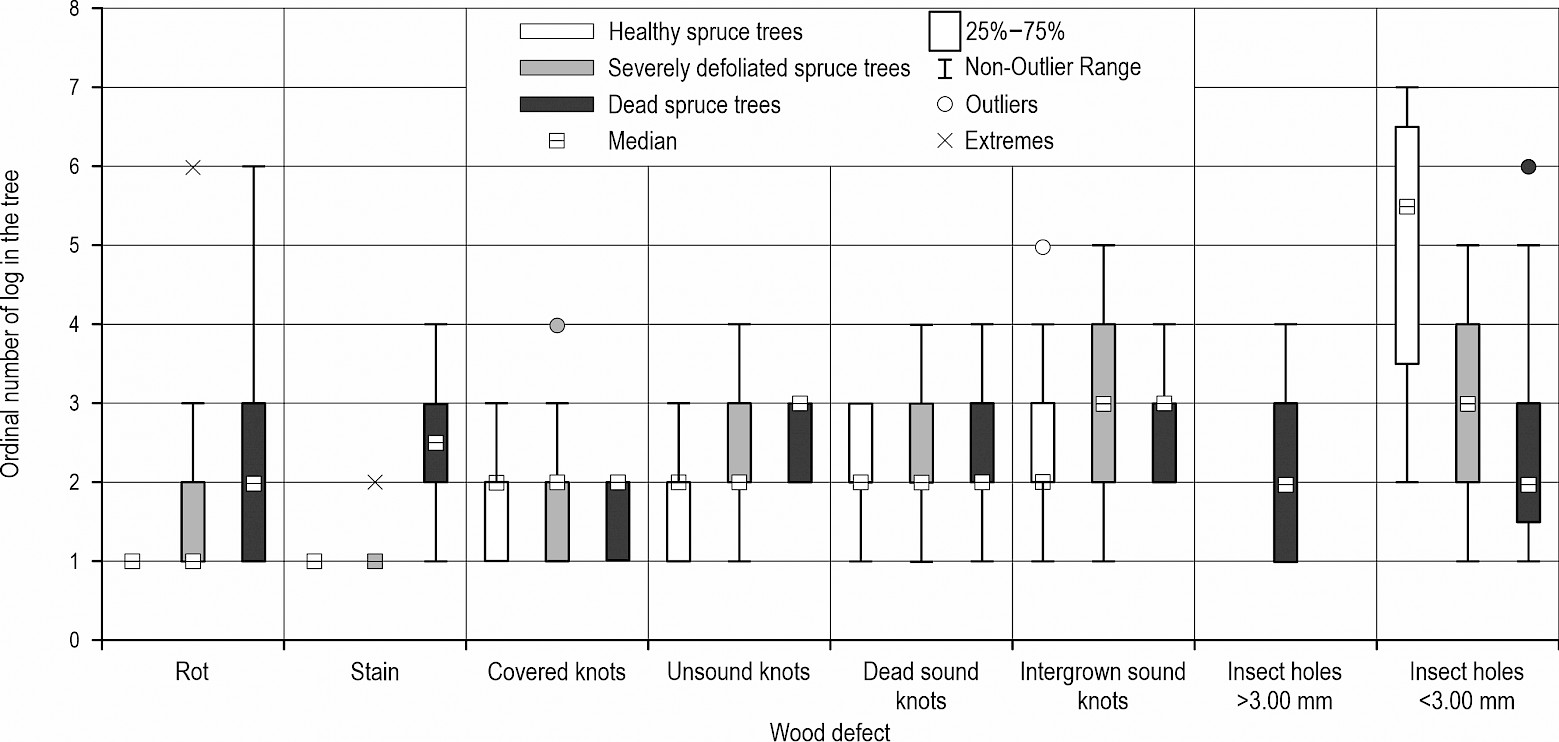
Fig. 5 The average ordinal number of log in the tree where wood defect was present
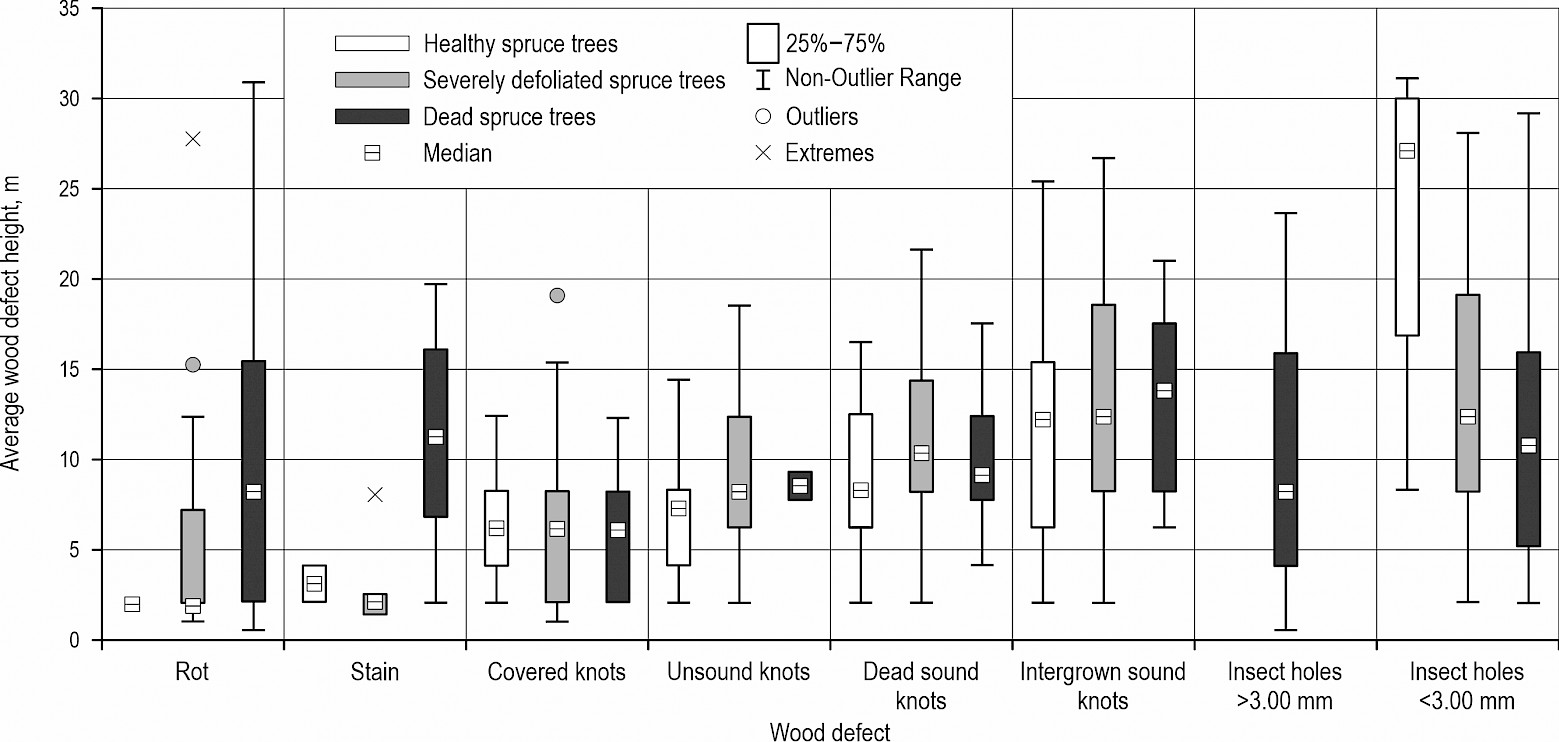
Fig. 6 The average height (m) of wood defects
3.3 Determined Assortment Structure
Determined assortment structure following HRN standard quality grades on the research sites along TCDD classes is shown in Fig. 7 for silver fir and in Fig. 8 for Norway spruce. Determined assortment structure according to the HRN EN standard is shown in Appendix A, Fig. A1 for silver fir and Fig. A2 for Norway spruce.
Determined assortment structure for silver fir showed the influence of TCDD class on the share of highly valuable assortments, e.g., VL were only produced from H trees, while VL and SLI logs were completely absent in the case of D silver fir trees. Absence of VL logs in DBH 57.5 cm of healthy trees could be explained by the presence of covered and dead knots, which were present mostly on the first and second log, from which it is supposed that VL can be produced. On the other side, the share of PW was the lowest in the case of H trees (3.82%), while it was significantly higher in the case of D trees (38.58%). The share of sawlogs was the highest in the case of S trees (74.78%), followed by H trees (72.56%) and D trees (30.11%). This trend could be explained by the absence of VL logs in the case of S trees, while a significantly lower share of sawlogs in the case of D trees is the result of a higher share of waste and PW. Namely, the highest share of waste was present in the case of D trees (22.19%), followed by H trees (18.69%) and S trees (18.47%).
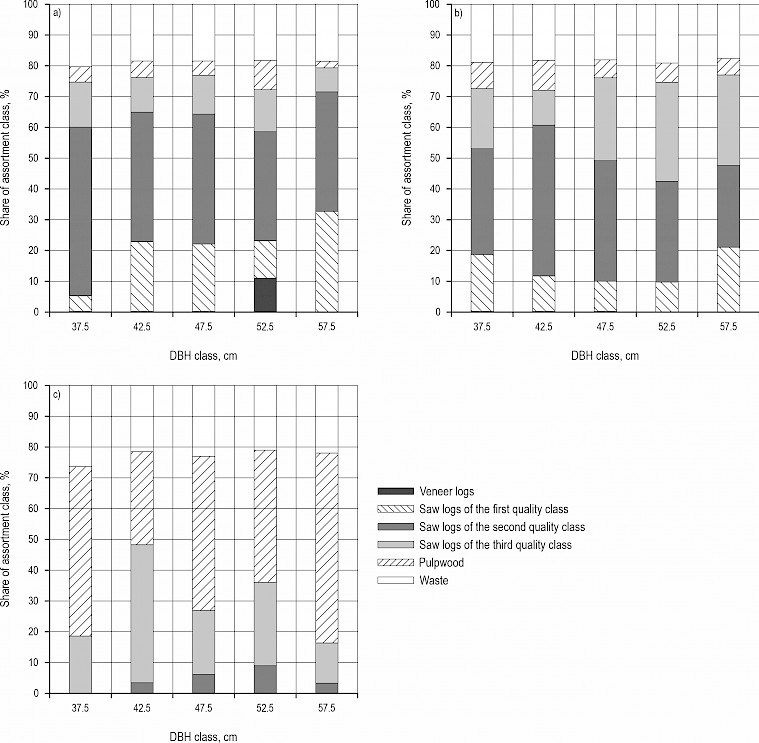
Fig. 7 Silver fir assortment structure according to HRN grading classes: a) for healthy fir trees, b) for severely defoliated fir trees, c) for dead fir trees
In the case of Norway spruce, a determined assortment structure also showed the influence of TCDD class on the share of highly valuable assortments, e.g., the highest share of VL was produced from H trees, while VL logs were completely absent in the case of D Norway spruce trees. The highest share of saw logs was produced from H trees (72.67%), followed by S trees (70.50%) and D trees (50.77%). The average share of waste was 18.07% with low deviation between TCDD classes (from 17.97% for D trees to 18.17% for H trees).
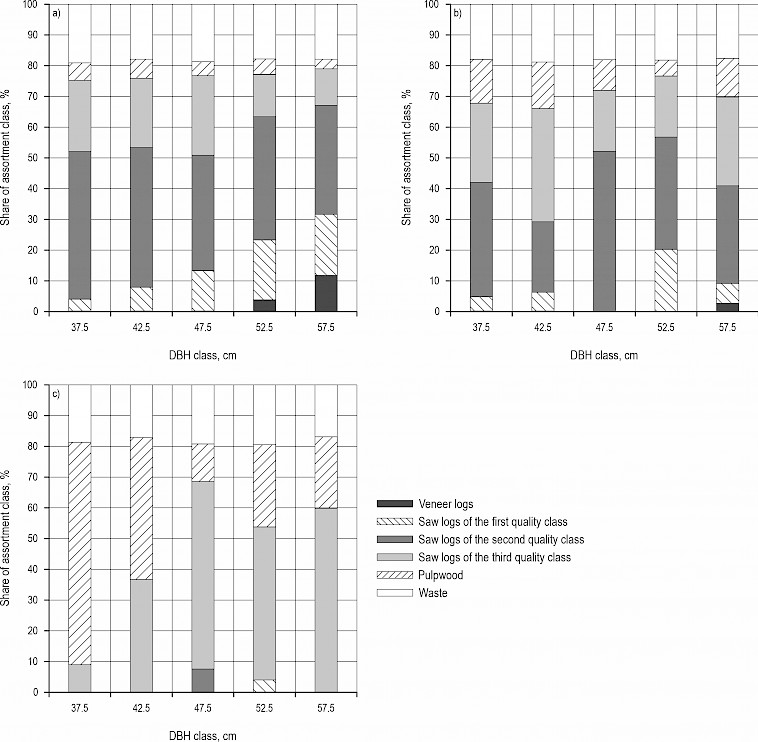
Fig. 8 Norway spruce assortment structure according to HRN grading classes: a) for healthy spruce trees, b) for severely defoliated spruce trees, c) for dead spruce trees
3.4 Average Tree Value
The deviation in average tree value of defoliated and dead trees in comparison to H trees is shown in Fig. 9a for silver fir and in Fig. 9b for Norway spruce as the final result of this study. The general trend shows a negative correlation between TCDD class and the average tree value. A slightly higher (0.25%) average tree value was determined in DBH class 37.5 for S silver fir trees, while in other TCDD and DBH classes, S and D trees always had a lower average tree value for both investigated species. Also, for silver fir, the largest decrease in the average tree value of 41.6% (DBH class 57.5) was detected for D trees. In the case of Norway spruce, the value of S trees decreased from 4.14% in DBH class 37.5 to 16.38% in DBH class 57.5, while the decrease of D trees in average tree value was significantly higher, from 22.39% in DBH class 37.5 to 36.3% in DBH class 57.5. In the case of D trees, silver fir trees showed a larger decrease in average tree value along all DBH classes compared to Norway spruce trees, while silver fir S trees showed a lower decrease in average tree value in DBH classes 37.5, 42.5, and 57.5 than Norway spruce S trees.
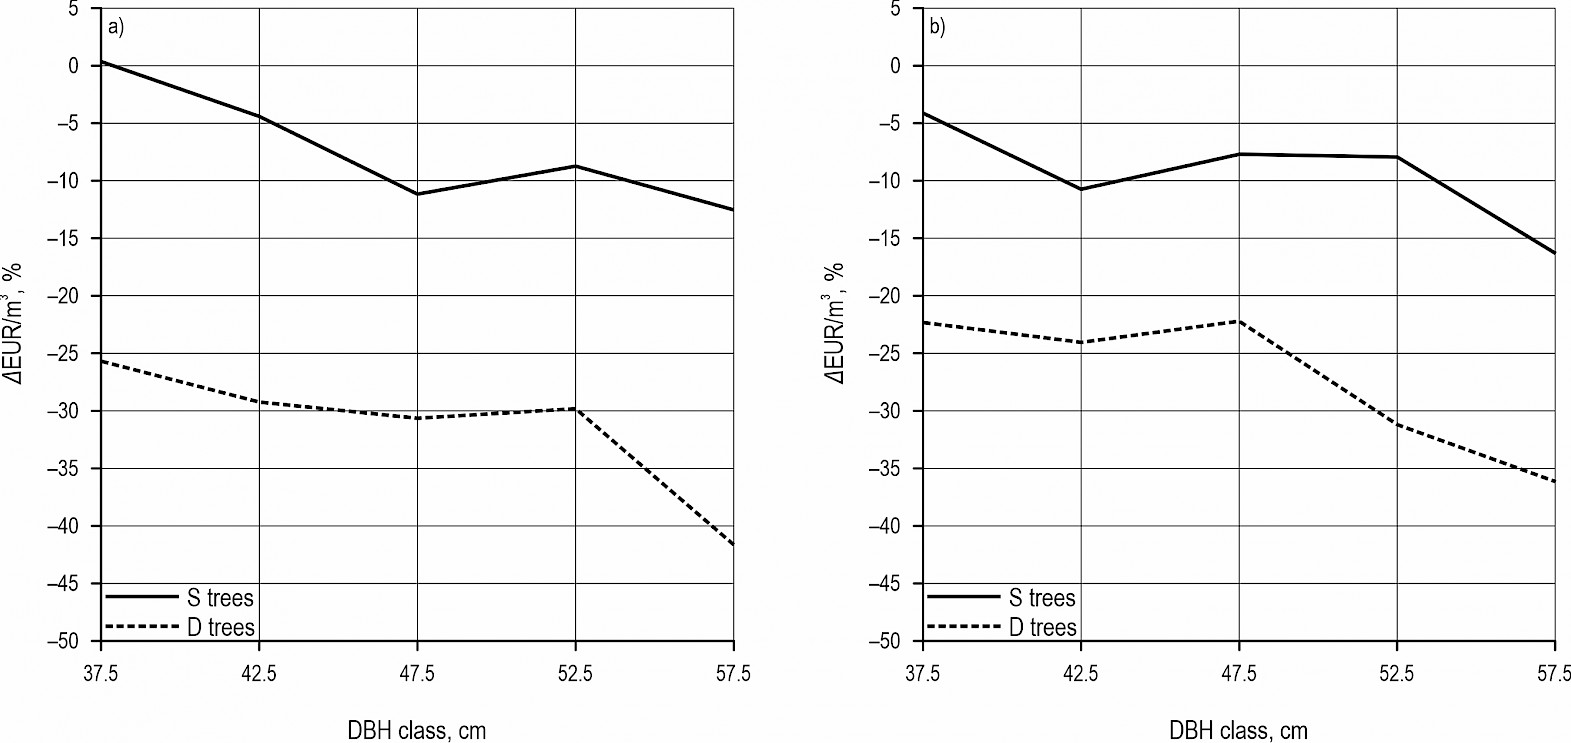
Fig. 9 Influence of TCDD class on the average tree value: a) for silver fir, b) for Norway spruce
As a final result of this study, the average tree value was expressed in EUR/m3 and statistically tested to determine whether it depends on the DBH class and TCDD class, and whether their interaction has a statistically significant influence. Analysis of variance (Table 9) showed statistically significant influence of DBH and TCDD class on the average tree value, while the interaction of TCDD and DBH class was not statistically significant. Although the statistical test did not show a significant influence of DBH and TCDD interaction on the average tree value, it is obvious that the average tree value is positively correlated with DBH class and negatively correlated with TCDD class. Furthermore, regression analysis (Fig. A3) showed a gentle introduction to linear regression in the case of D trees for both investigated tree species, which also idicates a lower quality of produced roundwood from D trees and quite simillar quality regardless of DBH. In contrast to D trees, H and S trees showed steeper slope of linear regression and higher determination coeficient indicating a stonger dependence between DBH and quality of produced roundwood.
Table 9 Influence of TCDD degree on average tree value (EUR/m3)
|
Tree species |
Effect |
Degr. of freedom |
SS |
MS |
F |
p |
|
Silver fir |
Intercept |
1 |
248632.8 |
248632.8 |
6781.690 |
<0.000001 |
|
TCDD |
2 |
6454.9 |
3227.5 |
88.032 |
<0.000001 |
|
|
DBH |
4 |
1005.4 |
251.3 |
6.856 |
0.000112 |
|
|
TCDD*DBH |
8 |
443.2 |
55.4 |
1.511 |
0.170314 |
|
|
Error |
66 |
2419.7 |
36.7 |
– |
– |
|
|
Norway spruce |
Intercept |
1 |
255271.1 |
255271.1 |
4406.225 |
<0.000001 |
|
TCDD |
2 |
3816.3 |
1908.2 |
32.937 |
<0.000001 |
|
|
DBH |
4 |
2530.1 |
632.5 |
10.918 |
<0.000001 |
|
|
TCDD*DBH |
8 |
467.4 |
58.4 |
1.008 |
0.438081 |
|
|
Error |
68 |
3939.5 |
57.9 |
– |
– |
|
|
TCDD – tree crown defoliation degree; DBH – diameter at breast height; SS – sum of squares; MS – mean square |
||||||
An additional post-hoc test showed that in the case of silver fir, D trees had the lowest average tree value (46.81 EUR/m3), followed by S trees (62.01 EUR/m3) and H trees (66.69 EUR/m3) with statistically significant differences between TCDD classes (Table A9). In the case of Norway spruce, D trees also had the lowest average tree value (47.75 EUR/m3), followed by S trees (60.32 EUR/m3) and H (65.26 EUR/m3), while only D trees were statistically significantly different from H and S trees (Table A9).
4. Discussion
Accelerated climate change poses a great challenge to the sustainability of forest ecosystems, sustainable forest management, and the production of high-quality timber assortments. Namely, recent studies determined a discrepancy between the established harvesting plans (on both national and stand level) and the actual harvested timber volume and value (Mederski et al. 2021, Ursić et. al. 2025, Ursić and Vusić 2025), which presents a large problem in the long-term and sustainable planning. This study was motivated by reduced volume utilisation and tree value, as a highly valuable renewable resource, due to the present climate change, and consequently increased sanitary felling in Croatian forests.
The deviation between the expected and actual timber volume processed could always be expected because of numerous reasons, e.g., trees and timber in general are a very heterogeneous material in which two identical trees or logs can rarely be found. Further, the number of input variables and calculation methods will strongly influence the deviation rate. For example, in the case of Turkey oak, the double-entry volume equation will estimate volume more accurately than the single-entry volume equation (Sönmez et al. 2022). According to the previous research, the deviation between the expected and actual gross volume is mostly within ±2.5% (Daniš and Neruda 2020), while the deviation of ±10% is considered very good (Brack and Wood 1998). Results of this study showed the deviation between the determined and expected gross volume of 0.90% in the case of Norway spruce, which is quite low, while the deviation of 8.29% in the case of silver fir was confirmed as statistically significant. The prescribed volume determination rules also play an important role in volume determination since the determined HRN and HRN EN net volumes were statistically significantly different for both researched species. In Croatia, a gross volume calculation method is prescribed by the Regulation on tree marking, classification of forest products, consignment notes, and forest order (Ministry of Agriculture, Forestry and Fisheries 2019). Following this, the number of marked trees in each DBH class is multiplied by the single-entry table prescribed volume, which was obtained by measuring 1.0–3.0 m long tree parts. In this research, gross volume was determined by measuring produced log assortments that were commonly significantly longer than 3.0 m. In the case of silver fir, a higher expected gross volume could have been affected by an inappropriately chosen single-entry volume table.
Forest management requires tools for developing accurate harvesting plans. For example, an efficient and accurate timber measurement is highly important for timber trade transparency (Tomczak et. al. 2024), while an accurate estimated assortment structure can provide multiple benefits for all participants in the wood supply chain, even in harvesting efficiency calculation (Papandrea et al. 2025). Assortment structure, except for the timber dimensions and quality, also depends on the prescribed rules by the standard used. The numerous different standards have unique rules for the classification of produced logs into quality classes. Faced with those limitations, very few studies were conducted with the aim of researching the silver fir and Norway spruce assortment structure following HRN and HRN EN standards. The results of this study showed a negative correlation between TCDD class and highly valuable assortments, e.g., veneer logs, and a positive correlation between TCDD class and low-quality timber, e.g., pupwood. This trend strongly supports the idea of using the TCDD class in creating future assortment tables in order to have more accurate assortment tables and consequently to develop more accurate harvesting plans.
The presence of wood defects plays an important role in roundwood grading. Only 15.03% of silver fir logs and 22.34% of Norway spruce logs were classified into quality classes based solely on their dimensions. On research sites, the share of knots was significantly high, 65.9% for silver fir and 68.4% for Norway spruce. The conducted studies also showed that knots are the most influential factors in roundwood grading in silver fir (Šušnjar et al. 2006) and Norway spruce trees (Berezjuk et al. 2025). Further, the height of knot appearance strongly influenced the declassification of the lower tree part from which highly valuable assortments could be produced. It is detected that wood defects related to the biological degradation are more common on D trees than on H and S trees. Namely, insect damage in the case of silver fir were present only on D trees, and the share of rot was always higher on the logs produced from D trees. A similar trend was observed in the case of Norway spruce, but with detected insect damage on H trees, which is most likely caused by a recent bark beetle outbreak in Croatia (Đuka et al. 2025). The negative influence of insect-infested trees is recognised through reduced tensile strength in comparison to uninfested Norway spruce trees (Löwe et al. 2022). In total, Norway spruce trees had a lower rot share than silver fir trees, indicating a higher durability of Norway spruce trees.
The final part of the study addressed the average tree value along DBH and TCDD classes. As presented, the average tree value was strongly influenced by TCDD class for both investigated tree species. A similar trend was reported by Zečić et al. (2009), where silver fir trees with defoliated crowns of 81–99% had 10–30% lower average value, while dead trees had 30–45% lower average value in comparison to healthy trees.
Further steps in research related to the assortment structure assessment should be directed towards the development of verified models since accurate assortment structure estimation models (which are still lacking) are a very valuable tool in forest management on many levels (Nocceti and Brunetti 2024, Drew et al. 2022). This paper did not intend to create new models for assortment quality estimation, but rather to indicate the additional significant predictor of timber quality, and consequently timber value - tree crown defoliation degree.
5. Conclusions
Following the results of the conducted study, it can be concluded that:
on the researched sites, currently used single-entry volume tables could be used to calculate harvesting volumes in case of Norway spruce, while they can be improved in case of silver fir
declassification of produced logs was mostly influenced by presence of knots in the case of both researched species
average tree value is strongly influenced by the tree crown defoliation degree
additional research must be considered to develop new models for assortment structure prediction.
Acknowledgments
This research was funded by the Croatian Science Foundation (HRZZ) under the project »Quantity and structure of fir and spruce biomass in changed climatic conditions« (UIP-2019-04-7766).
Conflicts of Interest
»The authors declare no conflict of interest«
»The founding sponsors had no role in the design of the study; in the collection, analyses, or interpretation of data; in the writing of the manuscript, and in the decision to publish the results«.
Appendix A Tables and Figures
Table A1 Multiple regression parameters of determined tree gross volume
|
Tree species |
Parameter |
b* |
SE of b* |
b |
SE of b |
t |
p |
M R2 |
|
Silver fir |
Intercept |
– |
– |
–4.60976 |
0.250345 |
–18.4137 |
<0.000001 |
0.9169 |
|
DBH |
0.652350 |
0.048608 |
0.09662 |
0.007199 |
13.4206 |
<0.000001 |
||
|
TH |
0.368097 |
0.048608 |
0.09402 |
0.012415 |
7.5727 |
<0.000001 |
||
|
Norway spruce |
Intercept |
– |
– |
–4.63440 |
0.263169 |
–17.6100 |
<0.000001 |
0.9094 |
|
DBH |
0.596675 |
0.045546 |
0.07960 |
0.006076 |
13.1005 |
<0.000001 |
||
|
TH |
0.443500 |
0.045546 |
0.10990 |
0.011286 |
9.7374 |
<0.000001 |
||
|
SE – standard error; M – multiple; DBH – diameter at breast height, cm; TH – tree height, m |
||||||||
Table A2 Multiple regression parameters of determined net HRN volume
|
Tree species |
Parameter |
b* |
SE of b* |
b |
SE of b |
t |
p |
M R2 |
|
Silver fir |
Intercept |
– |
– |
–4.60976 |
0.250345 |
–18.4137 |
<0.000001 |
0.9158 |
|
DBH |
0.652350 |
0.048608 |
0.09662 |
0.007199 |
13.4206 |
<0.000001 |
||
|
TH |
0.368097 |
0.048608 |
0.09402 |
0.012415 |
7.5727 |
<0.000001 |
||
|
Norway spruce |
Intercept |
– |
– |
–4.63440 |
0.263169 |
–17.6100 |
<0.000001 |
0.9023 |
|
DBH |
0.596675 |
0.045546 |
0.07960 |
0.006076 |
13.1005 |
<0.000001 |
||
|
TH |
0.443500 |
0.045546 |
0.10990 |
0.011286 |
9.7374 |
<0.000001 |
||
|
SE – standard error; M – multiple; DBH – diameter at breast height, cm; TH – tree height, m |
||||||||
Table A3 Multiple regression parameters of determined net HRN EN volume
|
Tree species |
Parameter |
b* |
SE of b* |
b |
SE of b |
t |
p |
M R2 |
|
Silver fir |
Intercept |
– |
– |
–3.91533 |
0.208486 |
–18.7799 |
<0.000001 |
0.9173 |
|
DBH |
0.634942 |
0.048467 |
0.07854 |
0.005995 |
13.1006 |
<0.000001 |
||
|
TH |
0.387193 |
0.048467 |
0.08260 |
0.010339 |
7.9888 |
<0.000001 |
||
|
Norway spruce |
Intercept |
– |
– |
–3.92384 |
0.232252 |
–16.8947 |
<0.000001 |
0.9022 |
|
DBH |
0.606288 |
0.047324 |
0.06870 |
0.005362 |
12.8114 |
<0.000001 |
||
|
TH |
0.428989 |
0.047324 |
0.09029 |
0.009960 |
9.0649 |
<0.000001 |
||
|
SE – standard error; M – multiple; DBH – diameter at breast height, cm; TH – tree height, m |
||||||||
Table A4 Multiple regression parameters of determined gross volume across different tree crown defoliation degrees
|
Tree species |
TCDD |
Parameter |
b* |
SE of b* |
b |
SE of b |
t |
p |
M R2 |
|
Silver fir |
Healthy tree |
Intercept |
– |
– |
–4.51334 |
0.420268 |
–10.7392 |
<0.000001 |
0.9235 |
|
DBH |
0.695176 |
0.070398 |
0.09663 |
0.009785 |
9.8749 |
<0.000001 |
|||
|
TH |
0.367439 |
0.070398 |
0.08700 |
0.016668 |
5.2194 |
0.000024 |
|||
|
Severely defoliated tree |
Intercept |
– |
– |
–4.42367 |
0.353714 |
–12.5063 |
<0.000001 |
0.9496 |
|
|
DBH |
0.546992 |
0.087539 |
0.08171 |
0.013077 |
6.2486 |
0.000003 |
|||
|
TH |
0.471854 |
0.087539 |
0.11242 |
0.020857 |
5.3902 |
0.000024 |
|||
|
Dead tree |
Intercept |
– |
– |
–4.69831 |
0.483301 |
–9.72128 |
<0.000001 |
0.9099 |
|
|
DBH |
0.712059 |
0.096519 |
0.10823 |
0.014671 |
7.37739 |
<0.000001 |
|||
|
TH |
0.282948 |
0.096519 |
0.08128 |
0.027727 |
2.93152 |
0.006791 |
|||
|
Norway spruce |
Healthy tree |
Intercept |
– |
– |
–4.81723 |
0.562963 |
–8.55693 |
<0.000001 |
0.8812 |
|
DBH |
0.432571 |
0.118519 |
0.06051 |
0.016578 |
3.64981 |
0.001336 |
|||
|
TH |
0.557364 |
0.118519 |
0.14439 |
0.030703 |
4.70276 |
0.000098 |
|||
|
Severely defoliated tree |
Intercept |
– |
– |
–4.77548 |
0.424393 |
–11.2525 |
<0.000001 |
0.9248 |
|
|
DBH |
0.660630 |
0.063461 |
0.08398 |
0.008068 |
10.4099 |
<0.000001 |
|||
|
TH |
0.402215 |
0.063461 |
0.10869 |
0.017149 |
6.3379 |
0.000001 |
|||
|
Dead tree |
Intercept |
– |
– |
–4.28695 |
0.358358 |
–11.9628 |
<0.000001 |
0.9477 |
|
|
DBH |
0.648060 |
0.062663 |
0.08464 |
0.008184 |
10.3421 |
<0.000001 |
|||
|
TH |
0.433363 |
0.062663 |
0.09104 |
0.013164 |
6.9158 |
0.000001 |
|||
|
TCDD – tree crown defoliation degree; SE – standard error; M – multiple; DBH – diameter at breast height, cm; TH – tree height, m |
|||||||||
Table A5 Multiple regression parameters of determined net HRN volume across different tree crown defoliation degrees
|
Tree species |
TCDD |
Parameter |
b* |
SE of b* |
b |
SE of b |
t |
p |
M R2 |
|
Silver fir |
Healthy tree |
Intercept |
– |
– |
–3.72575 |
0.332195 |
–11.2155 |
<0.000001 |
0.9292 |
|
DBH |
0.716117 |
0.067720 |
0.08179 |
0.007735 |
10.5747 |
<0.000001 |
|||
|
TH |
0.346389 |
0.067720 |
0.06739 |
0.013175 |
5.1150 |
0.000031 |
|||
|
Severely defoliated tree |
Intercept |
– |
– |
–3.65475 |
0.339421 |
–10.7676 |
<0.000001 |
0.9326 |
|
|
DBH |
0.525952 |
0.101193 |
0.06522 |
0.012549 |
5.1975 |
0.000038 |
|||
|
TH |
0.483927 |
0.101193 |
0.09571 |
0.020014 |
4.7822 |
0.000100 |
|||
|
Dead tree |
Intercept |
– |
– |
–4.12186 |
0.404344 |
–10.1940 |
<0.000001 |
0.9064 |
|
|
DBH |
0.600794 |
0.098347 |
0.07498 |
0.012274 |
6.1089 |
0.000002 |
|||
|
TH |
0.400261 |
0.098347 |
0.09441 |
0.023198 |
4.0699 |
0.000368 |
|||
|
Norway spruce |
Healthy tree |
Intercept |
– |
– |
–3.99534 |
0.469875 |
–8.50299 |
<0.000001 |
0.8791 |
|
DBH |
0.437251 |
0.119559 |
0.05060 |
0.013837 |
3.65719 |
0.001312 |
|||
|
TH |
0.551648 |
0.119559 |
0.11824 |
0.025626 |
4.61402 |
0.000122 |
|||
|
Severely defoliated tree |
Intercept |
– |
– |
–3.89801 |
0.361533 |
–10.7819 |
<0.000001 |
0.9199 |
|
|
DBH |
0.675123 |
0.065488 |
0.07085 |
0.006873 |
10.3091 |
<0.000001 |
|||
|
TH |
0.382768 |
0.065488 |
0.08539 |
0.014609 |
5.8449 |
0.000002 |
|||
|
Dead tree |
Intercept |
– |
– |
–3.50113 |
0.344983 |
–10.1487 |
<0.000001 |
0.9291 |
|
|
DBH |
0.645856 |
0.072968 |
0.06973 |
0.007878 |
8.8512 |
<0.000001 |
|||
|
TH |
0.424463 |
0.072968 |
0.07372 |
0.012673 |
5.8171 |
0.000009 |
|||
|
TCDD – tree crown defoliation degree; SE – standard error; M – multiple; DBH – diameter at breast height, cm; TH – tree height, m |
|||||||||
Table A6 Multiple regression parameters of determined net (HRN EN standard) volume across different tree crown defoliation degrees
|
Tree species |
TCDD |
Parameter |
b* |
SE of b* |
b |
SE of b |
t |
p |
M R2 |
|
Silver fir |
Healthy tree |
Intercept |
– |
– |
–3.80810 |
0.345594 |
–11.0190 |
<0.000001 |
0.9268 |
|
DBH |
0.711526 |
0.068861 |
0.08314 |
0.008047 |
10.3328 |
<0.000001 |
|||
|
TH |
0.350300 |
0.068861 |
0.06972 |
0.013706 |
5.0871 |
0.000033 |
|||
|
Severely defoliated tree |
Intercept |
– |
– |
–3.76842 |
0.342935 |
–10.9887 |
<0.000001 |
0.9348 |
|
|
DBH |
0.529380 |
0.099519 |
0.06744 |
0.012678 |
5.3194 |
0.000028 |
|||
|
TH |
0.481672 |
0.099519 |
0.09787 |
0.020222 |
4.8400 |
0.000088 |
|||
|
Dead tree |
Intercept |
– |
– |
–4.16591 |
0.402097 |
–10.3605 |
<0.000001 |
0.9090 |
|
|
DBH |
0.594574 |
0.096988 |
0.07483 |
0.012206 |
6.1304 |
0.000002 |
|||
|
TH |
0.408206 |
0.096988 |
0.09709 |
0.023069 |
4.2088 |
0.000254 |
|||
|
Norway spruce |
Healthy tree |
Intercept |
– |
– |
–4.10790 |
0.484984 |
–8.47016 |
<0.000001 |
0.8777 |
|
DBH |
0.430332 |
0.120225 |
0.05112 |
0.014282 |
3.57940 |
0.001588 |
|||
|
TH |
0.557626 |
0.120225 |
0.12268 |
0.026450 |
4.63819 |
0.000115 |
|||
|
Severely defoliated tree |
Intercept |
– |
– |
–4.04336 |
0.372002 |
–10.8692 |
<0.000001 |
0.9202 |
|
|
DBH |
0.670366 |
0.065400 |
0.07249 |
0.007072 |
10.2502 |
<0.000001 |
|||
|
TH |
0.388318 |
0.065400 |
0.08925 |
0.015032 |
5.9376 |
0.000002 |
|||
|
Dead tree |
Intercept |
– |
– |
–3.60763 |
0.341544 |
–10.5627 |
<0.000001 |
0.9340 |
|
|
DBH |
0.663952 |
0.070412 |
0.07355 |
0.007800 |
9.4295 |
<0.000001 |
|||
|
TH |
0.407266 |
0.070412 |
0.07257 |
0.012547 |
5.7840 |
0.000010 |
|||
|
TCDD – tree crown defoliation degree; SE – standard error; M – multiple; DBH – diameter at breast height, cm; TH – tree height, m |
|||||||||
Table A7 Descriptive statistics of measured silver fir roundwood
|
TCDD |
Quality class |
VL |
SLI |
SLII |
SLIII |
PW |
|
|
Number of measured logs |
3 |
20 |
41 |
22 |
30 |
||
|
Healthy fir tree |
Length, m |
Average |
4.07 |
4.59 |
6.83 |
6.17 |
5.27 |
|
Standard deviation |
0.06 |
1.44 |
1.77 |
1.84 |
1.90 |
||
|
Minimum |
4.00 |
4.00 |
4.00 |
4.00 |
2.20 |
||
|
Maximum |
4.10 |
8.00 |
8.00 |
10.00 |
9.40 |
||
|
Diameter, cm |
Average |
46.00 |
42.55 |
35.44 |
26.77 |
16.37 |
|
|
Standard deviation |
1.73 |
4.93 |
4.86 |
3.91 |
6.32 |
||
|
Minimum |
45.00 |
35.00 |
25.00 |
20.00 |
10.00 |
||
|
Maximum |
48.00 |
54.00 |
45.00 |
34.00 |
46.00 |
||
|
Gross volume, m3 |
Average |
0.7883 |
0.7838 |
0.8232 |
0.4532 |
0.1540 |
|
|
Standard deviation |
0.0511 |
0.2171 |
0.2837 |
0.2100 |
0.1456 |
||
|
Minimum |
0.7467 |
0.4654 |
0.4215 |
0.1702 |
0.0214 |
||
|
Maximum |
0.8454 |
1.3387 |
1.5651 |
0.8670 |
0.8087 |
||
|
Net HRN volume, m3 |
Average |
0.6764 |
0.6447 |
0.6724 |
0.3663 |
0.1272 |
|
|
Standard deviation |
0.0518 |
0.1876 |
0.2385 |
0.1808 |
0.1281 |
||
|
Minimum |
0.6521 |
0.3945 |
0.3485 |
0.1445 |
0.0173 |
||
|
Maximum |
0.7419 |
1.1222 |
1.3042 |
0.7445 |
0.6980 |
||
|
Severely defoliated fir tree |
Number of measured logs |
– |
14 |
33 |
32 |
27 |
|
|
Length, m |
Average |
– |
4.00 |
5.93 |
6.34 |
5.00 |
|
|
Standard deviation |
– |
0.00 |
1.95 |
1.64 |
1.31 |
||
|
Minimum |
– |
4.00 |
4.00 |
4.00 |
2.10 |
||
|
Maximum |
– |
4.00 |
8.00 |
8.00 |
8.20 |
||
|
Diameter, cm |
Average |
– |
41.86 |
37.70 |
30.69 |
18.96 |
|
|
Standard deviation |
– |
6.30 |
6.07 |
5.84 |
6.74 |
||
|
Minimum |
– |
33.00 |
25.00 |
23.00 |
10.00 |
||
|
Maximum |
– |
53.00 |
49.00 |
43.00 |
44.00 |
||
|
Gross volume, m3 |
Average |
– |
0.6817 |
0.8051 |
0.5978 |
0.1865 |
|
|
Standard deviation |
– |
0.1947 |
0.3367 |
0.2855 |
0.1386 |
||
|
Minimum |
– |
0.4117 |
0.3161 |
0.2299 |
0.0493 |
||
|
Maximum |
– |
1.0235 |
1.5824 |
1.1713 |
0.5983 |
||
|
Net HRN volume, m3 |
Average |
– |
0.5617 |
0.6686 |
0.4906 |
0.1526 |
|
|
Standard deviation |
– |
0.1750 |
0.2941 |
0.2459 |
0.1151 |
||
|
Minimum |
– |
0.3507 |
0.2525 |
0.1855 |
0.0330 |
||
|
Maximum |
– |
0.9045 |
1.3628 |
0.9796 |
0.5049 |
||
|
Dead fir tree |
Number of measured logs |
– |
– |
6 |
30 |
68 |
|
|
Length, m |
Average |
– |
– |
5.33 |
6.48 |
6.64 |
|
|
Standard deviation |
– |
– |
2.07 |
1.82 |
2.10 |
||
|
Minimum |
– |
– |
4.00 |
4.00 |
2.10 |
||
|
Maximum |
– |
– |
8.00 |
8.25 |
10.20 |
||
|
Diameter, cm |
Average |
– |
– |
42.17 |
35.53 |
30.94 |
|
|
Standard deviation |
– |
– |
3.66 |
6.57 |
9.98 |
||
|
Minimum |
– |
– |
38.00 |
23.00 |
12.00 |
||
|
Maximum |
– |
– |
47.00 |
53.00 |
53.00 |
||
|
Gross volume, m3 |
Average |
– |
– |
0.8843 |
0.8127 |
0.6754 |
|
|
Standard deviation |
– |
– |
0.2605 |
0.3821 |
0.4652 |
||
|
Minimum |
– |
– |
0.5841 |
0.2634 |
0.0480 |
||
|
Maximum |
– |
– |
1.2573 |
1.6081 |
2.1138 |
||
|
Net HRN volume, m3 |
Average |
– |
– |
0.7211 |
0.6677 |
0.5674 |
|
|
Standard deviation |
– |
– |
0.2062 |
0.3238 |
0.3980 |
||
|
Minimum |
– |
– |
0.4898 |
0.2119 |
0.0358 |
||
|
Maximum |
– |
– |
1.0430 |
1.3628 |
1.8091 |
||
|
TCDD – tree crown defoliation degree |
|||||||
Table A8 Descriptive statistics of measured Norway spruce roundwood
|
TCDD |
Quality class |
VL |
SLI |
SLII |
SLIII |
PW |
|
|
Number of measured logs |
4 |
13 |
37 |
30 |
26 |
||
|
Healthy spruce tree |
Length, m |
Average |
4.10 |
4.65 |
6.72 |
6.11 |
6.14 |
|
Standard deviation |
0.08 |
1.60 |
1.86 |
1.69 |
1.99 |
||
|
Minimum |
4.00 |
4.00 |
4.00 |
3.75 |
2.70 |
||
|
Maximum |
4.20 |
8.50 |
8.25 |
8.25 |
11.00 |
||
|
Diameter, cm |
Average |
45.50 |
42.31 |
35.43 |
26.90 |
14.62 |
|
|
Standard deviation |
5.51 |
5.71 |
5.80 |
4.82 |
3.74 |
||
|
Minimum |
39.00 |
32.00 |
24.00 |
20.00 |
10.00 |
||
|
Maximum |
51.00 |
53.00 |
48.00 |
40.00 |
29.00 |
||
|
Gross volume, m3 |
Average |
0.8095 |
0.8229 |
0.8020 |
0.4324 |
0.1361 |
|
|
Standard deviation |
0.1803 |
0.4135 |
0.2857 |
0.1850 |
0.0761 |
||
|
Minimum |
0.6167 |
0.3996 |
0.3281 |
0.1725 |
0.0443 |
||
|
Maximum |
1.0237 |
1.7865 |
1.6060 |
0.9579 |
0.3365 |
||
|
Net HRN volume, m3 |
Average |
0.6758 |
0.6821 |
0.6566 |
0.3550 |
0.1086 |
|
|
Standard deviation |
0.1626 |
0.3596 |
0.2422 |
0.1569 |
0.0645 |
||
|
Minimum |
0.5017 |
0.3297 |
0.2708 |
0.1559 |
0.0322 |
||
|
Maximum |
0.8580 |
1.5463 |
1.3628 |
0.8245 |
0.2708 |
||
|
Severely defoliated spruce tree |
Number of measured logs |
– |
14 |
33 |
32 |
27 |
|
|
Length, m |
Average |
1 |
4.00 |
4.33 |
6.08 |
6.26 |
|
|
Standard deviation |
– |
0.00 |
1.15 |
2.03 |
1.81 |
||
|
Minimum |
– |
4.00 |
4.00 |
4.00 |
3.75 |
||
|
Maximum |
– |
4.00 |
8.00 |
9.00 |
10.00 |
||
|
Diameter, cm |
Average |
– |
47.00 |
43.50 |
37.87 |
29.34 |
|
|
Standard deviation |
– |
0.00 |
5.98 |
5.89 |
5.78 |
||
|
Minimum |
– |
47.00 |
33.00 |
26.00 |
21.00 |
||
|
Maximum |
– |
47.00 |
53.00 |
49.00 |
43.00 |
||
|
Gross volume, m3 |
Average |
– |
0.8444 |
0.7912 |
0.8098 |
0.5427 |
|
|
Standard deviation |
– |
0.0000 |
0.2694 |
0.2718 |
0.2705 |
||
|
Minimum |
– |
0.8444 |
0.4218 |
0.3156 |
0.1777 |
||
|
Maximum |
– |
0.8444 |
1.4082 |
1.4756 |
1.1903 |
||
|
Net HRN volume, m3 |
Average |
– |
0.6936 |
0.6528 |
0.6665 |
0.4435 |
|
|
Standard deviation |
– |
0.0000 |
0.2376 |
0.2320 |
0.2312 |
||
|
Minimum |
– |
0.7113 |
0.3507 |
0.2708 |
0.1559 |
||
|
Maximum |
– |
0.7113 |
1.2053 |
1.2468 |
0.9796 |
||
|
Dead spruce tree |
Number of measured logs |
– |
1 |
1 |
45 |
53 |
|
|
Length, m |
Average |
– |
4.00 |
4.00 |
6.16 |
6.86 |
|
|
Standard deviation |
– |
0.00 |
0.00 |
1.84 |
2.56 |
||
|
Minimum |
– |
4.00 |
4.00 |
3.75 |
2.10 |
||
|
Maximum |
– |
4.00 |
4.00 |
8.25 |
13.50 |
||
|
Diameter, cm |
Average |
– |
44.00 |
41.00 |
37.56 |
24.49 |
|
|
Standard deviation |
– |
0.00 |
0.00 |
6.80 |
9.46 |
||
|
Minimum |
– |
44.00 |
41.00 |
23.00 |
9.00 |
||
|
Maximum |
– |
44.00 |
41.00 |
50.00 |
49.00 |
||
|
Gross volume, m3 |
Average |
– |
0.7335 |
0.6704 |
0.8192 |
0.4386 |
|
|
Standard deviation |
– |
0.0000 |
0.0000 |
0.2881 |
0.3254 |
||
|
Minimum |
– |
0.7335 |
0.6704 |
0.2460 |
0.0397 |
||
|
Maximum |
– |
0.7335 |
0.6704 |
1.4037 |
1.4021 |
||
|
Net HRN volume, m3 |
Average |
– |
0.6079 |
0.5278 |
0.6752 |
0.3662 |
|
|
Standard deviation |
– |
0.0000 |
0.0000 |
0.2476 |
0.2772 |
||
|
Minimum |
– |
0.6234 |
0.5413 |
0.1964 |
0.0317 |
||
|
Maximum |
– |
0.6234 |
0.5413 |
1.1908 |
1.1763 |
||
|
TCDD – tree crown defoliation degree |
|||||||
Table A9 Parameters of Unequal N HSD post-hoc test of significant difference in average tree value between TCDD classes
|
Tree species |
Tree crown defoliation degree |
Dead trees |
Severely defoliated trees |
Healthy trees |
|
Silver fir |
Dead trees |
– |
0.000113 |
0.000113 |
|
Severely defoliated trees |
0.000113 |
– |
0.025049 |
|
|
Healthy trees |
0.000113 |
0.025049 |
– |
|
|
Norway spruce |
Dead trees |
– |
0.000113 |
0.000112 |
|
Severely defoliated trees |
0.000113 |
– |
0.057064 |
|
|
Healthy trees |
0.000112 |
0.057064 |
– |
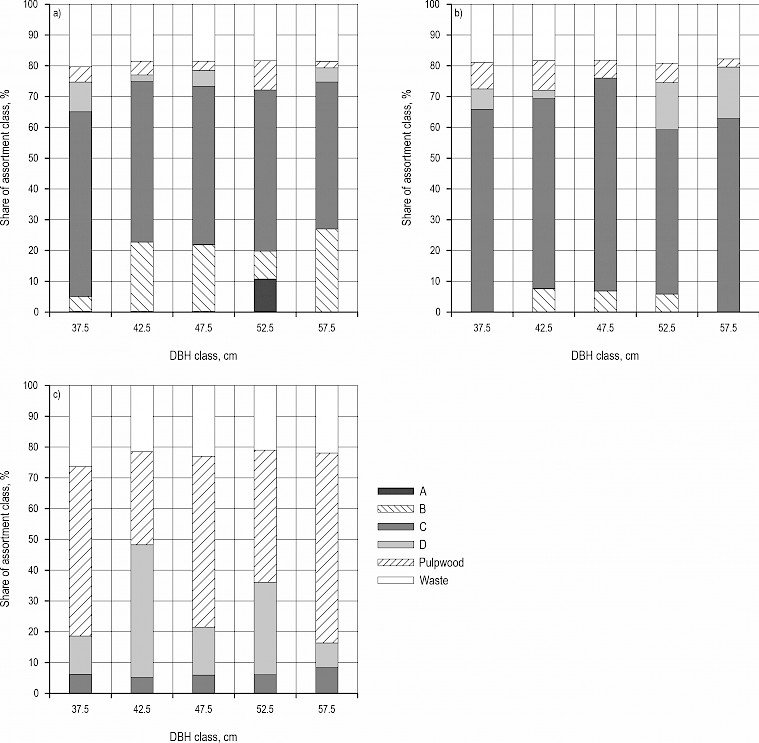
Fig. A1 Silver fir assortment structure according to HRN EN grading classes: a) for healthy fir trees, b) for severely defoliated fir trees, c) for dead fir trees
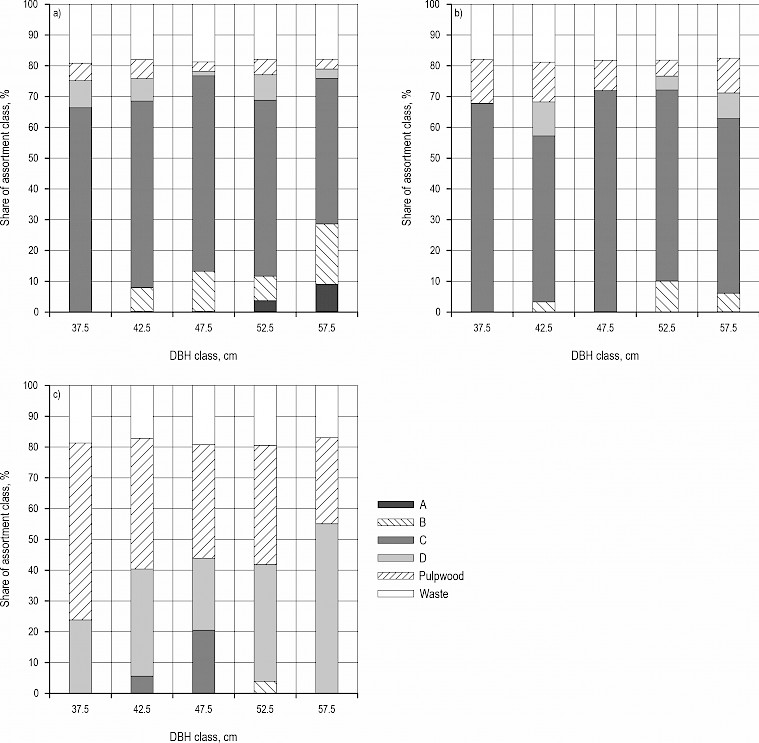
Fig. A2 Norway spruce assortment structure according to HRN EN grading classes: a) for healthy spruce trees, b) for severely defoliated spruce trees, c) for dead spruce trees
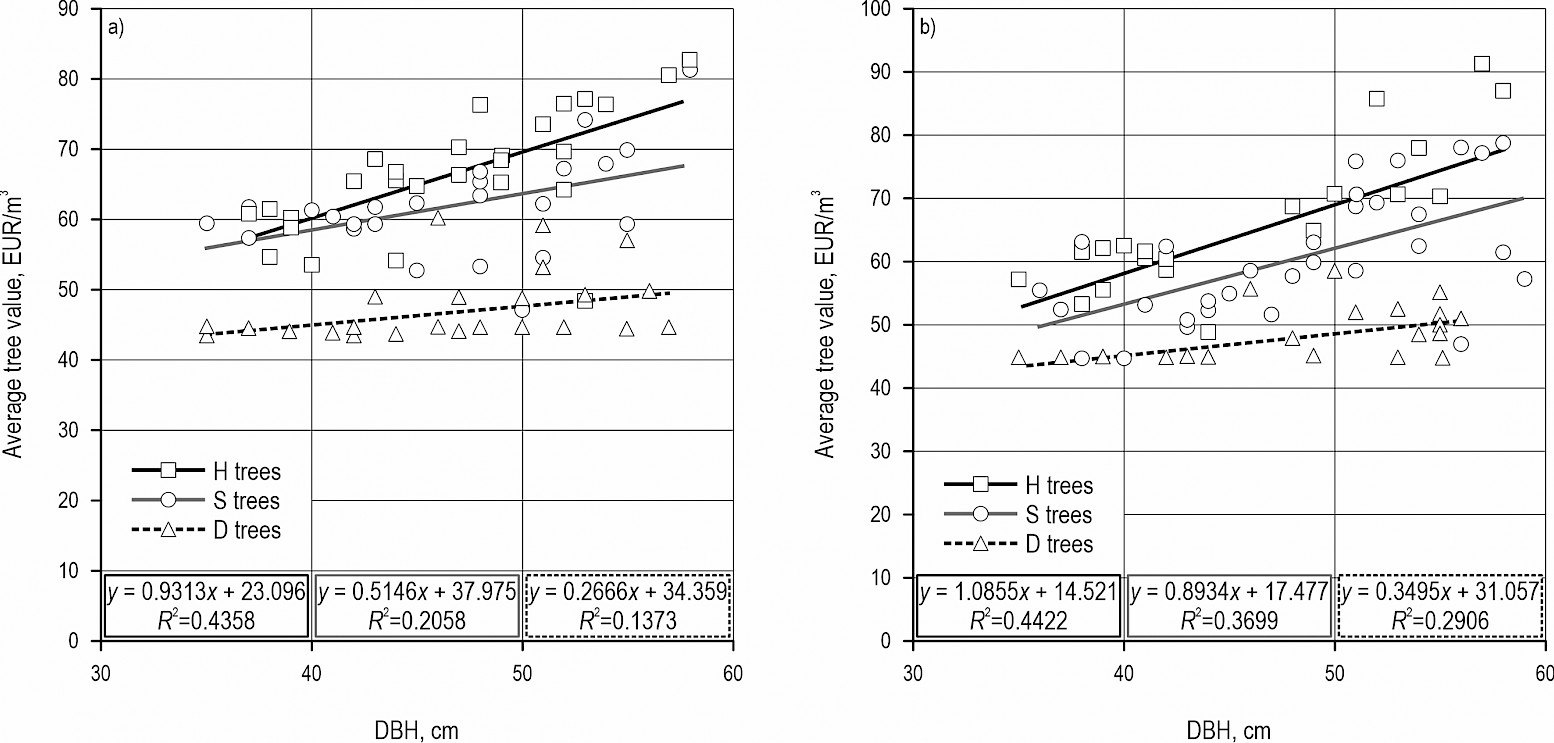
Fig. A3 Regression of average tree value (EUR/m3) and diameter at breast height (cm) for: a) silver fir, b) Norway spruce
6. References
Augustaitis, A., Šopauskienė, D., Baužienė, I., 2010: Direct and indirect effects of regional air pollution on tree crown defoliation. Baltic Forestry 16(1): 23–34.
Berezjuk, R., Nop, P., Mařík, R., Gracovský, R., Tippner, J., 2025: Towards more accurate grading: non-destructive methods for assessing low-quality sawlogs. Holzforschung: 1–13. https://doi.org/10.1515/hf-2025-0039
Bledý, M., Vacek, S., Brabec, P., Vacek, Z., Cukor, J., Černý, J., Ševčík, R., Brynychová, K., 2024: Silver Fir (Abies alba Mill.): Review of Ecological Insights. Forest Management Strategies, and Climate Change's Impact on European Forests. Forests 15(6): 998. https://doi.org/10.3390/f15060998
Brack, G.L., Wood, G.B., 1998: Forest Mensuration: Volume of Single Tree; Australian National University: Canberra, Australia.
Croatian forests. Available online: https://www.hrsume.hr/wp-content/uploads/2025/02/Cjenik-glavnih-sumskih-proizvoda-veljaca-2025.pdf (accessed 01 March 2025).
Daniš, M., Neruda, J., 2020: Comparison of The Accuracy of Methods for Calculating the Volume of Standing European Beech Trees. Acta Univ. Agric. Silvic. Mendelianae Brun. 68: 821–830. https://doi.org/10.11118/actaun202068050821
Dobbertin, M., Brank, P., 2001: Crown defoliation improves tree mortality models. For. Ecol. Manag. 141(3): 271–284. https://doi.org/10.1016/S0378-1127(00)00335-2
Dobrowolska, D., Bončina, A., Klumpp, R., 2017: Ecology and silviculture of silver fir (Abies alba Mill.): a review. J. For. Res. 22(6): 326–335. https://doi.org/10.1080/13416979.2017.1386021
Drew, D.M., Downes, G., Seifert, T., Eckes-Shepard, A., Achim, A., 2022: A Review of Progress and Applications in Wood Quality Modelling. Curr. For. Rep. 8: 317–332. https://doi.org/10.1007/s40725-022-00171-0
Đuka, A., Franjević, M., Tomljanović, K., Popović, M., Ugarković, D., Teslak, K., Barčić, D., Žagar, K., Palatinuš, K., Papa, I., 2025: A Decade of Sanitary Fellings Followed by Climate Extremes in Croatian Managed Forests. Land 14(4): 766. https://doi.org/10.3390/land14040766
Eichhorn, J., Roskams, P., Potočić, N., Timmermann, V., Ferretti, M., Mues, V., Szepesi, A., Durrant, D., Seletković, I., Schrock, H.W., 2021: Manual on methods and criteria for harmonized sampling, assessment, monitoring and analysis of the effects of air pollution on forests. In Part IV Visual Assessment of Crown Condition and Damaging Agents; Version 2020-3; ICP Forests: Eberswalde, Germany, 1–54 p. Available online: https://www.icp-forests.org/pdf/manual/2020/ICP_Manual_part04_2020_Crown_version_2020-3.pdf (accessed on 10 March 2021).
European Commission. Communication from the Commission to The European Parliament, The Council, The European Economic and Social Committee and The Committee of The Regions. New EU Forest Strategy for 2030. Brussels, 16 July 2021. Available online: https://eur-lex.europa.eu/legal-content/EN/TXT/HTML/?uri=CELEX:52021DC0572#footnote2 (accessed on 1 March 2024).
Ferretti, M., Ghosh, S., Gottardini, E., 2021: Stem Radial Growth Is Negatively Related to Tree Defoliation and Damage in Conifers, Northern Italy. Front. For. Glob. Change 4: 775600. https://doi.org/10.3389/ffgc.2021.775600
Gonçalves, A.C., 2021: Thinning: An Overview. In Silviculture; Gonçalves. A.C., Ed.; IntechOpen: London. UK, 41–50 p.
Gustavsson, L., Madlener, R., Hoen, H.F., Jungmeier, G., Karjalainen, T., Klöhn, S., Mahapatra, K., Pohjola, J., Solberg, B., Spelter, H., 2006: The Role of Wood Material for Greenhouse Gas Mitigation. Adapt. Strat. Gl. 11: 1097–1127. https://doi.org/10.1007/s11027-006-9035-8
HRN D.B4.021, 1979: Hrvatske norme proizvoda iskorištavanja šuma. Crnogorični trupci za furnir. Državni zavod za Normizaciju i mjeriteljstvo: Zagreb, Croatia, 1995.
HRN D.B4.029, 1979: Hrvatske norme proizvoda iskorištavanja šuma. Crnogorični trupci za rezanje. Državni zavod za Normizaciju i mjeriteljstvo: Zagreb, Croatia, 1995.
HRN D.B5.020, 1979: Hrvatske norme proizvoda iskorištavanja šuma. Drvo za izradu celuloze i drvenjače. Državni zavod za Normizaciju i mjeriteljstvo: Zagreb, Croatia, 1995.
HRN EN 1309-2:2010: Round and Sawn Timber–Method of Measurement of Dimensions–Part 2: Round Timber—Requirements for Measurement and Volume Calculation Rules. Croatian Standards Institute: Zagreb, Croatia, 2010.
HRN EN 1927-1:2008: Qualitative classification of softwood round timber – Part 1: Spruces and firs. Croatian Standards Institute: Zagreb, Croatia.
Jozsa, L.A., Middleton, G.R., 1994: A Discussion of Wood Quality Attributes and Their Practical Implications; Forintek Canada Corp.: Vancouver, BC, Canada; Western Laboratory: VA, Canada, 1–51 p.
JUS D.B0.022, 1984: Proizvodi eksploatacije šuma: Razvrstavanje i merenje neobrađenog i obradđenog drveta. Jugoslavenski Standard: Beograd, Serbia.
Karaszewski, Z., Bembenek, M., Mederski, P.S., Szczepańska-Alvarez, A., Byczkowski, R., Kozłowska, A., Michnowicz, K., Przytuła, W., Giefing, D.F., 2013: Identifying Beech Round Wood Quality–Distributions and The Influence of Defects On Grading. Drewno 56(189): 39–54. https://doi.org/10.12841/wood.1644-3985.041.03
Knoke, T., Stang, S., Remler, N., Seifert. T., 2005: Ranking the importance of quality variables for the price of high quality beech timber (Fagus sylvatica L.). Ann. For. Sci. 63(4): 399–413. https://doi.org/10.1051/forest:2006020
Löwe, R., Sedlecký, M., Sikora, A., Prokůpková, A., Modlinger, R., Novotný, K., Turčáni, M., 2022: How Bark Beetle Attack Changes the Tensile and Compressive Strength of Spruce Wood (Picea abies (L.) H. Karst.). Forests 13(1): 87. https://doi.org/10.3390/f13010087
Macdonald, E., Hubert, J., 2002: A review of the effects of silviculture on timber quality of Sitka spruce. Forestry 75(2): 107–138. https://doi.org/10.1093/forestry/75.2.107
Marenče, J., Šega, B., Gornik Bučar, D., 2020: Monitoring the Quality and Quantity of Beechwood from Tree to Sawmill Product. Croat. J. For. Eng. 41(1): 119–128. https://doi.org/10.5552/crojfe.2020.613
Matić, S., 2011: Utjecaj stanišnih promjena i načina gospodarenja na sušenje obične smreke (Picea abies Karst.) u Hrvatskoj. Croat. J. For. Eng. 32(1): 7–17.
Mederski, P.S., Borz, S.A., Đuka, A., Lazdiņš, A., 2021: Challenges in Forestry and Forest Engineering – Case Studies from Four Countries in East Europe. Croat. J. For. Eng. 42(1): 117–134. https://doi.org/10.5552/crojfe.2021.838
Ministry of Agriculture, Forestry and Fisheries of the Republic of Croatia. Šumskogospodarska Osnova 2016–2025; Ministry of Agriculture, Forestry and Fisheries of the Republic of Croatia: Zagreb, Croatia.
Mitchel, H.L., 1961: A concept of Intristic Wood Quality, and Nondestructive Methods for Determining Quality in Standing Timber. Report No 2233, Forest Products Laboratory, Madison, Wisconsin.
Nocetti, M., Brunetti, M., 2024: Advancements in Wood Quality Assessment: Standing Tree Visual Evaluation–A Review. Forests 15(6): 943. https://doi.org/10.3390/f15060943
Paixo, C., Krause, C., Morin, H., Achim, A., 2019: Wood quality of black spruce and balsam fir trees defoliated by spruce budworm: A case study in the boreal forest of Quebec, Canada. For. Ecol. Manag. 437: 201–210. https://doi.org/10.1016/j.foreco.2019.01.032
Papandrea, S.F., Stoilov, S., Cataldo, M.F., Nichev, P., Angelov, G., Proto, A.R., 2025: How Different Distribution of Assortments on Worksites Influences Forwarder Performance in Coniferous Plantations. Croat. J. For. Eng. 46(1): 33–45. https://doi.org/10.5552/crojfe.2025.2593
Patacca, M., Lindner, M., Lucas-Borja, M.E., Cordonnier, T., Fidej, G., Gardiner, B., Hauf, Y., Jasinevičius, G., Labonne, S., Linkevičius, E., Mahnken, M., Milanovic, S., Nabuurs, G.J., Nagel, T.A., Nikinmaa, L., Panyatov, M., Bercak, R., Seidl, R., Ostrogović Sever, M.Z., Socha, J., Thom, D., Vuletic, D., Zudin, S., Schelhaas, M.J., 2023: Significant increase in natural disturbance impacts on European forests since 1950. Global Change Biology 29(5): 1359–1376. https://doi.org/10.1111/gcb.16531
Popa, I., Badea, O., Silaghi, D., 2017: Influence of climate on tree health evaluated by defoliation in the ICP level I network (Romania). iFor. Biogeosci. For. 10(3): 554–560. https://doi.org/10.3832/ifor2202-009
Potočić, N., Seletković, I., Medak, J., Jakovljević, T., Marjanović, H., Indir, K., Marušić, M., Zorić, N., Bogdanić, R., Lovrić, V., 2025: Oštećenost šumskih ekosustava Republike Hrvatske. Izvješće za 2024. godinu. Hrvatski šumarski institut: 1–86 p.
Senf, C., Sebald, J., Seidl, R., 2021: Increasing canopy mortality affects the future demographic structure of Europe's forests. One Earth 4(5): 749–755. https://doi.org/10.1016/j.oneear.2021.04.008
Shifley, S.R., 2002: Oak Growth and Response to Thinning. In Proceedings of the Upland Oak Ecology Symposium: History. Current Conditions and Sustainability, Asheville, NC, USA, 7–10 October.
Sönmez, T., Gencal, B., Çağatay Çankaya, E., 2022: Single- and Double-Entry Volume Equations for Turkey Oak (Quercus cerris L.) Stands in Bursa Regional Directorate of Forestry. Forestist 20(10): 1–12. https://doi.org/10.5152/forestist.2022.22010
Spiecker, H., 2000: Growth of Norway Spruce (Picea abies (L.) Karst.) under Changing Environmental Conditions in Europe. EFI Proceedings 33: 11–26.
Šušnjar, M., Krpan, A.P.B., Pentek, T., Horvat, D., Poršinsky, D., 2006: Influence of Knots on Classification of Timber Assortments of Silver Fir Into Quality Classes. Wood Research 51(1): 51–58.
Tomczak, K., Mederski, P.S., Naskrent, B., Tomczak, A., 2024: Accuracy of Photo-Optical Timber Measurement Using a Stereo Camera Technology. Croat. J. For. Eng. 45(1): 157–167. https://doi.org/10.5552/crojfe.2024.2268
UNECE, 2024: Forest Products – Annual Market Review 2023–2024. United Nations and the Food and Agriculture Organization of the United Nations: 52 p.
Ursić, B., Dinko, V., 2025: Pedunculate Oak (Quercus robur L.) Crown Defoliation as an Indicator of Timber Value. Forests 16(7): 1111. https://doi.org/10.3390/f16071111
Ursić, B., Zečić, Ž., Vusić, D., 2025: Quantity and Quality of Narrow-Leaved Ash (Fraxinus angustifolia Vahl) Wood Forest Products in Relation to Tree Crown Defoliation. Forests 16(1): 147. https://doi.org/10.3390/f16010147
Whiteman, A., Brown, C., Bull, G., 1999: Factors influencing the supply and demand for wood and wood products. In the Forest products market developments: the outlook for forest products markets to 2010 and the implications for improving management of the global forest estate. FAO, Forestry Policy and Planning Division, Rome, Italy; 5–12 p.
Zečić, Ž., Stankić, I., Vusić, D., Bosner, A., Jakšić, D., 2009: Iskorištenje obujma i vrijednost drvnih sortimenta posušenih stabala jele obične (Abies alba Mill.). Šumarski list 133(1–2): 27–37.
Zhang, S.Y., 1997: Wood quality: its definition, impact and implications for value-added timber management and end uses. In Timber Management Toward Wood Quality and End-Product Value. S.Y., Zhang, R., Gosselin and G., Chauret (eds). Proceedings of the CTIA/IUFRO International Wood Quality Workshop, Quebec City. Part I, 17–39 p.
© 2025 by the authors. Submitted for possible open access publication under the
terms and conditions of the Creative Commons Attribution (CC BY) license (http://creativecommons.org/licenses/by/4.0/).
Branko Ursić, MSc *
e-mail: bursic@sumfak.unizg.hr
Assoc. prof. Dinko Vusić, PhD
e-mail: dvusic@sumfak.unizg.hr
University of Zagreb
Faculty of Forestry and Wood Technology
Institute of Forest Engineering
Svetošimunska cesta 23
10 000 Zagreb
CROATIA
* Corresponding author
Received: July 16, 2025
Accepted: October 10, 2025
Original scientific paper