
CAN Bus Joystick Data to Assess Operator Workload: A Forwarder Loading Case Study
doi: https://doi.org/10.5552/crojfe.2026.3915
volume: issue, issue:
pp: 11
- Author(s):
-
- Humphrey Patrick
- Harvey Campbell
- Visser Rien
- Best Trevor
- Hooper Brionny
- Article category:
- Original scientific paper
- Keywords:
- CANbus, forwarder, joystick, J1939, operator workload, forestry, New Zealand
Abstract
HTML
Modern forest harvesting machinery generate an abundance of underutilised data in their control systems. The Controller Area Network (CAN) bus data stream offers the opportunity to investigate the operation of the machinery in detail while in real-world harvesting scenarios. This study uses CAN data to assess a component of operator workload in forwarder operations, by introducing a method to interpret forwarder joystick movements. The data was captured in a clearfell logging operation case study in Canterbury, New Zealand. The joystick data was then analysed to determine the time and number of operator input movements per load cycle (»grab«) totalling 418 grabs. This, combined with video analysis, identified independent variables that describe the grab cycle such as time of day, number of logs per grab, log grade, and the activities of »pencilling« (vertical drop of logs in grab to align large ends) and »dropping« (releasing logs from the grab before loading). Factors that significantly affected the operators' time taken to complete the grab and the number of required joystick movements included number of logs, pencilling and dropping. For example, the average load cycle was 18-seconds for four logs, and this increased by 6.1-seconds and 14.4-seconds per grab when pencilling or dropping, respectively. Average total joystick movements were ~108 per grab. This case study demonstrated that CAN bus data can be used to improve our understanding of the operation of harvesting equipment such as forwarders. An example use of the result is to share and compare this with the harvester operator (who crosscuts and sets out the logs for forwarder-collection) as the need for pencilling and dropping is a consequence of misalignment or debris caught in the piles. The method used also presents an opportunity for human factors research, particularly in operator fatigue management and training through the measurement of joystick movements with a genuine possibility of real-time performance feedback.
CAN Bus Joystick Data to Assess Operator Workload: A Forwarder Loading Case Study
Patrick Humphrey, Campbell Harvey, Rien Visser, Trevor Best, Brionny Hooper
https://doi.org/10.5552/crojfe.2026.3915
Abstract
Modern forest harvesting machinery generate an abundance of underutilised data in their control systems. The Controller Area Network (CAN) bus data stream offers the opportunity to investigate the operation of the machinery in detail while in real-world harvesting scenarios. This study uses CAN data to assess a component of operator workload in forwarder operations, by introducing a method to interpret forwarder joystick movements. The data was captured in a clearfell logging operation case study in Canterbury, New Zealand. The joystick data was then analysed to determine the time and number of operator input movements per load cycle (»grab«) totalling 418 grabs. This, combined with video analysis, identified independent variables that describe the grab cycle such as time of day, number of logs per grab, log grade, and the activities of »pencilling« (vertical drop of logs in grab to align large ends) and »dropping« (releasing logs from the grab before loading). Factors that significantly affected the operators' time taken to complete the grab and the number of required joystick movements included number of logs, pencilling and dropping. For example, the average load cycle was 18-seconds for four logs, and this increased by 6.1-seconds and 14.4-seconds per grab when pencilling or dropping, respectively. Average total joystick movements were ~108 per grab. This case study demonstrated that CAN bus data can be used to improve our understanding of the operation of harvesting equipment such as forwarders. An example use of the result is to share and compare this with the harvester operator (who crosscuts and sets out the logs for forwarder-collection) as the need for pencilling and dropping is a consequence of misalignment or debris caught in the piles. The method used also presents an opportunity for human factors research, particularly in operator fatigue management and training through the measurement of joystick movements with a genuine possibility of real-time performance feedback.
Keywords: CANbus, forwarder, joystick, J1939, operator workload, forestry, New Zealand
1. Introduction
In New Zealand, forwarders are commonly used in ground-based timber harvesting operations, accounting for approximately eight percent of extraction machines (Visser 2023). They are used in cut-to-length operations where trees are delimbed, cut into logs at the stump, and extracted to the landing. This system offers several advantages by minimising road construction, reducing soil disturbance, and damage to logs compared to skidding (Proto et al. 2018a, Tiernan et al. 2004).
There have been numerous time and motion studies exploring the factors that influence forwarder productivity globally. In New Zealand, Proto et al. (2018b) showed that distance and payload were significant contributors to productivity. Similarly, a case study in Ireland showed that extraction direction (uphill or downhill) also impacts productivity (Tiernan et al. 2004). Furthermore, in Croatia, Stankić et al. (2012) found that forwarder class, load characteristics, terrain, and stand conditions were contributing factors. Gagliradi et al. (2020) emphasised these factors as key contributors to productivity in their study of South African Plantation forestry. The literature shows a well-versed understanding of the critical factors affecting the productivity of forwarders; however, these are mainly focused on the entire forwarder cycle. There is limited research examining factors within individual elements of each cycle, understanding that each load cycle is the sum of a number of loading and unloading movements.
As technology advances, research of forestry operations has increasingly transitioned from traditional time and motion studies to automated data logging approaches, offering greater accuracy and resolution when analysing machine and operator performance in greater detail. For example, Manner (2015) uses John Deere's TimberLink system to investigate productivity per loading grab. The log concentration and number of assortments in a load were found to significantly affect the time taken per grab. Manner et al. (2016) used TimberLink to examine over 15,000 forwarder cycles, computing fuel and time consumption. Suvinen (2006) used Controller Area Network (CAN) data to assess the fuel consumption related to wheel chains and bogie tracks on forwarders, providing an indication of their economic viability during the forwarders driving cycle elements.
Systems like TimberLink or directly accessing the machine's CAN bus network allow for more accurate analyses of forwarding operations. CAN is a serial communication protocol developed by Bosch in the mid-1980s and standardised as ISO 11898 (Spencer and Torres 2022). A message-based communication protocol connects electronic control units (ECUs) in harsh environments where electrical noise and other electromagnetic disturbances may cause communication failures. It has seen widespread adoption, from automotive controls to industrial systems and heavy machinery controls. Forest harvesting machinery is one of these adopters. Spencer et al. (2020) stated that tapping into this system for data acquisition unveils significant opportunities for advancing the knowledge base within harvesting operations. It allows the machine inner workings, including engine and hydraulics parameters and joystick movements, to be recorded in detail.
Modern forestry machines are now extensively controlled by joysticks, offering ergonomic advantages (Sokolov et al. 2023). CAN bus joystick data could be used to analyse the operator working patterns, and the effects operating conditions may have on those behaviours. Current human factors research in forestry focuses on attaching sensors to the operator to measure muscle load and air temperature, and using tools like eye trackers and echocardiogram devices. For example, Škvor et al. (2022) measured the heart rate and muscle load of timber truck drivers to assess the effect of different road types on them. They found that drivers operating on lower-grade roads experienced higher stresses, with a 21.9% increase in difficulty on lower-grade roads than on roads of higher quality. O'Connor (2023) examined the potential of using electromyography biofeedback to minimise work-related musculoskeletal disorders. The interactive tool developed encouraged operators to learn how to reduce muscle engagement and relax during their operational activities. Häggström (2015) investigated felling machine operators' eye movements in cut-to-length operators. The study found that operators conducted their joystick movements without visual representation, meaning they did not need to look at their joysticks when operating the machine. Instead, the operator focused on the actions of the harvesting head and the bucking monitor and aspects of the forest work site, which provided an overview while allowing them to organise the next cycle of work. These studies show that technology can effectively measure the operator patterns of work while also capturing the operator planning and thought process during the operations.
Utilising joystick data from the CAN bus offers a non-obtrusive approach to monitoring operational performance. Sorrento et al. (2011) is one of the earliest studies investigating operator performance using joystick data. They focused on assessing the joystick control of powered wheelchair driving tasks using joystick displacement, number of joystick movements, and direction. This allowed the authors to discern novice and expert powered wheelchair drivers. Gacem et al. (2019) expanded on this work to compute the driving style of wheelchair operators by including joystick velocity and acceleration to capture a more complete picture of operator actions. They showed that novice users were able to stabilise their driving style after learning. Rabreau et al. (2019) build on Sorrento's work to assess user behaviour during powered wheelchair driving tasks, allowing for a driver profile to be created and performance to be monitored. In turn, these findings allowed their therapists to provide data-driven feedback on their patients' progress.
Joystick movement is defined as joystick displacement that exceeds a threshold, commonly 5–10% of the total joystick movement calculated as the Euclidean distance (Gacem et al. 2019, Sorrento et al. 2011). Using the joystick displacement alone is an appropriate method for simple joystick manoeuvres. However, other variables are needed to capture the complex joystick manoeuvres in forwarder operation. Laurikkala et al. (2016) showed that it is possible to predict cognitive and motion skills of forest harvester operators from joystick inputs. Their simulation game uses joystick movements and positions of the crane and head to predict an operator skill level based on a Neural Network. These studies show that analysing joystick data to measure the characteristics of operators in working conditions is possible, potentially providing an indication of operator performance and allowing for data-based feedback.
Cycle time (loading and unloading logs) is a gross measure of forwarder operator productivity. Detailed movements of the joystick could give insights into the operator style of work and their changes throughout the workday. Performance (speed and accuracy of movements) and fatigue (cumulative increase in tiredness) are influenced by many factors in the environment, such as windthrow (Szewczyk et al. 2020). Modern forestry machines take the heavy physical load away from the operator but can replace it with mental workload, as partially automated work can generate a significant cognitive and psychological load (Heinimann 2007, Szewczyk et al. 2020). CAN bus data and analysis could support measuring this mental workload, particularly through analysis of joystick movements. This may allow for real-time feedback to operators about fatigue levels throughout the day.
The literature shows clear motivation for developing innovative techniques to deeper understand operator performance during operations, particularly, using joystick analysis. However, there remains limited research in applying these techniques in real working operations. This study aims to build upon existing joystick analysis techniques to investigate factors affecting operator performance and workload. The study further aims to use CAN bus data to determine factors affecting the productivity and utilisation of forwarders during loading operations. Specifically:
provide a method for measuring the joystick movements of forwarder operators during loading cycles and demonstrate the application in a case study
using the case study, show factors affecting operator workload as determined by the number of joystick movements.
2. Materials and Methods
2.1 Site Description and Machine Used
The forwarder (Fig. 1) used for data collection was a John Deere 1910E (with intelligent boom control); the specifications are given in Table 1. The forwarder was working in Balmoral Forest, Canterbury, New Zealand, planted in Pinus radiata. The forest terrain is flat, and the conditions were dry. Data collection took place from 5 am to 2 pm on the 15th of May 2024, totalling 418 individual grabs captured during 15 completed forwarder load cycles.
Table 1 John Deere 1910E Forwarder specifications
|
Specification |
Value |
|
Load rating |
21 tonne |
|
Boom reach |
7.2 / 8.5 m |
|
Engine power |
186 kW (249 hp) |
|
Tractive effort |
220 kN |
|
Operating weight |
21.8 tonne |
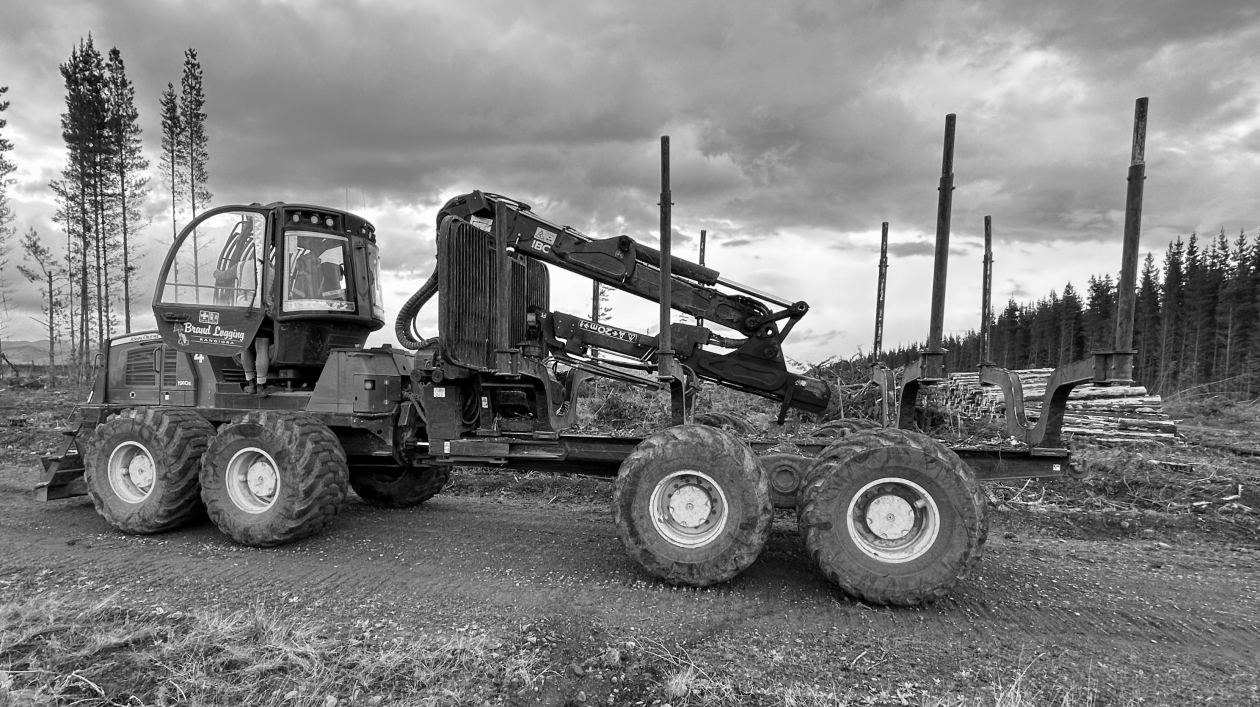
Fig. 1 John Deere 1910E in Balmoral Forest
2.2 Data Collection
CAN data was collected from the forwarder using the CANEdge2 data logger connected to the machine through its diagnostic port using the standard J1939 Type-2 connector. The data was captured at an average rate of 333 Hz and stored in 50 MB MDF4 format files, a standard for time series data in the automotive industry. After the study period, the SD Card was removed, and the files were uploaded to a desktop computer. The raw CAN data was transformed into a human-readable form (CSV files) using Python 3.10 scripts, the ASAMMDF library (Hrisca 2024), and the SAE J1939 DBC file (Database CAN).
To link the CAN data to the operations carried out by the forwarder, a video of the operation was also recorded on an Insta360 video camera. The camera was mounted to the inside of the cab, always facing the grapple due to the automatically rotating cabin. The resulting video files were edited and cut into individual grabs from each loading cycle. A total of 418 grabs were recorded over 15 cycles. The video footage was then used to determine the unique factors associated with each grab, including the number of logs and their grade, whether the logs were dropped, and whether the pile was pencilled (the operator butts up the logs during the grab by pressing them into the ground). The CAN data was then spliced to match the video footage.
After reviewing the video footage from each grab, it was evident that there were three types of starting positions, depending on the ending position from the previous grab. The first type was when the operator moved from one pile to the next. This meant the crane was stationary, and the starting point was defined as the first joystick movement other than grapple rotation or open/close. The second type was when an operator immediately slewed the boom to the next grab after dropping the previous one. Due to the limitations of not having the load cell data, there was no clear point in the data to show when the logs were dropped. Therefore, the next grab starting point was when the grapple trigger was released by the operator after dropping the load. The final but unusual case was when the operator started the grab after butting the logs up from the back of the log bolsters. Here, the video had to be reviewed to determine the first movement that occurred after the butting procedure, which, in most cases, was the boom slew.
2.3 Data Processing
In total, ten joystick parameters were captured and decoded from the forwarder's CAN bus network, the five relevant parameters are shown in Table 2. Fig. 2 shows the inside of the cab of the machine, where joystick1 refers to the arm on the left and joystick2 to the arm on the right. With intelligent boom control, manual control of the squirt/jib boom was unnecessary, so Joystick1ThetaAxis was omitted from the dataset. The other four joystick parameters related to the machines steering and control of the blade were irrelevant to the analysis and were therefore removed. Taking these parameters and their associated binary joystick direction variables, which show what quadrant the joystick is in, the true values for each joystick were calculated. For example, Joystick2XAxis Lever Left Negative Position Status having a value of 1 indicates that Joystick2XAxis is on the left side of the x-axis and in a negative position. Therefore, it is transformed by multiplying by negative one to get its true value.
Table 2 Joystick variables used in analysis
|
Variable Name |
Description |
|
Joystick1XAxis |
Controls the slew (left and right) of the boom |
|
Joystick2XAxis |
Controls the rotation (clockwise and counter clockwise) of the grapple head |
|
Joystick1YAxis |
Controls the outer boom in and out |
|
Joystick2YAxis |
Controls the inner boom up and down |
|
Joystick2ThetaAxis |
Controls the opening and closing of the grapple head |
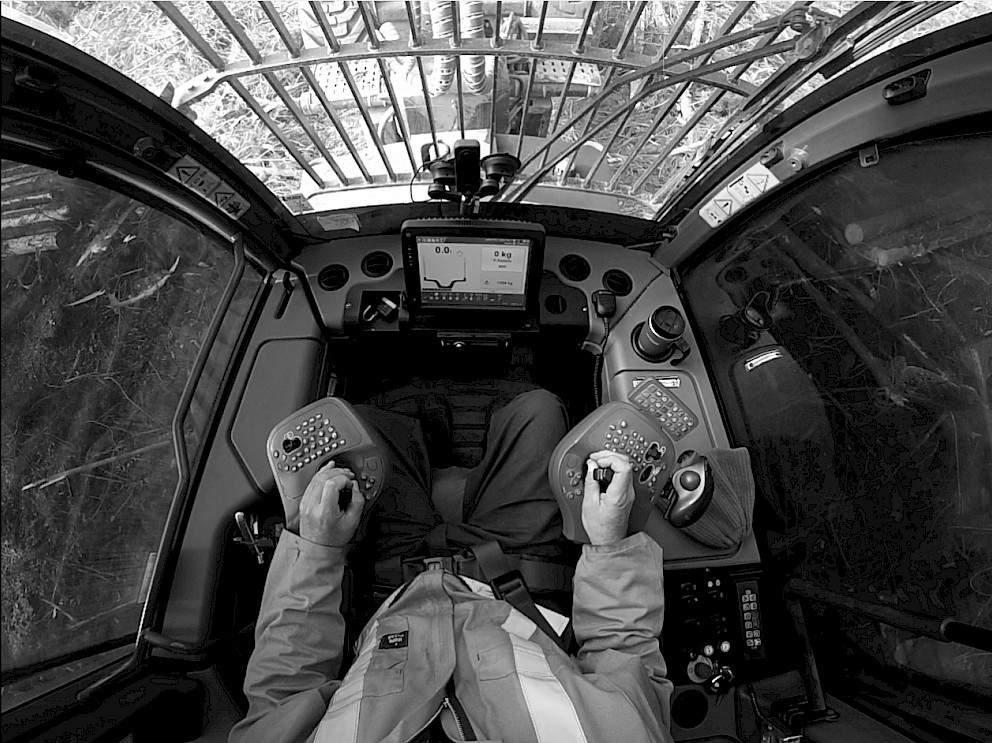
Fig. 2 Forwarder cabin the with the operator handling joystick1 on the left and joystick2 on the right
Vector direction used in defining a joystick movement by combining the x and y joystick coordinates as defining joystick movements based on displacement was deemed inappropriate. Vector direction was computed in Python 3.10 using the acrtan2 function, which accounts for positive and negative values and handles division by zero (Eq. 1). The angle differences had to be corrected due to the errors occurring where there were angle discontinuities near the boundaries [-π, π]. For the trigger movements (Joystick2ThetaAxisPosition), simple state change logic was applied to define capture, a push and release on the trigger.

Where:
∆xt and ∆yt represent the change in the x and y coordinates between t-1 and t, respectively
θt direction of the vector (angle) at point t.
2.4 Statistical Analysis
Five regression models were developed using Generalised Least Squares (GLS) to analyse the factors influencing forwarder loading cycles. These models focused on grab completion time, joystick1, joystick2 and trigger movements as well as the total number of joystick movements. GLS was employed to develop the regression models, as it accounts for heteroscedasticity and autocorrelation in the residuals, which violate the Ordinary Least Squares (OLS) assumptions. The representative equation for all models is seen in Eq. 2. For each model, an F-test was performed to evaluate the overall goodness-of-fit, and the significance of each coefficient was tested individually using t-tests. A significance level of p<0.05 was applied to determine statistically significant factors, which are represented in the final model (Eq. 2).

Where:
y is the dependant variable (completion time, joystick1movements, joystick2movements, trigger movements, and total joystick movements)
P is a pencilling movement, where the operator butts up the logs during the grab by pressing them into the ground
D is a dropping movement, where the operator initially grabs the log pile but drops it and releases the grapple, freeing the logs momentarily. This is done to either pile logs together or remove slash from the grab
L represents the log grade of each cycle; refer to Table 3 for their specifications
T refers to the time of day, derived from the cycles and ranges from one to 15 (5 am to 2 pm)
N denotes the number of logs in the grapple during the grab
ϵ represents the residuals (assumed to be identical and independently normally distributed).
Table 4 presents the descriptive statistics of the independent variables.
Table 3 Log grade specifications
|
Grade |
# of grabs |
SED, cm |
Length, m |
Maximum knot size, cm |
|
KX |
186 |
10 |
3.94 |
No Restriction |
|
UA |
49 |
10 |
2.2–6.0 |
No Restriction |
|
M20 |
107 |
20 |
4.09 |
10 |
|
M30 |
25 |
30 |
4.09 |
12 |
|
R11 |
51 |
12 |
5.5+ |
5 |
3. Results
3.1 Establishing Joystick Movement
The original sampling from the data logger (333 Hz) meant the points were too close together, resulting in thousands movements for most angle thresholds (Fig. 3). Therefore, the data had to be resampled to ensure the number of movements predicted were appropriate, previous joystick studies showing that 100 ms was a common resampling rate for joystick data (Mavridis et al. 2015, Sorrento et al. 2011). However, sampling rate and θ_t threshold had to be analysed simultaneously against the number of joystick movements to ensure accuracy. Nicholls et al. (2024) showed that an average operator reaction time was 191 ms, suggesting that an operator can make a maximum of five deliberate joystick movements per second. An average grab completion time of ~22 seconds meant that the total possible number of movements would reasonably be 110.
It was found that 200 ms resampling rate and a 45-degree threshold for θ_t provided the most consistent and accurate movement count, significantly reducing the number of micro-movements that are unlikely to be deliberate decisions by the operator, or a result of machine vibrations affecting hand movements. For joystick1 and 2 one extra move was added at the start to account for the first movement. The average total movement count was 107.8 (Table 4) consistent with the theoretical number of possible movements based on reaction time.
Fig. 4 illustrates the different number of significant movements for joystick2 at different threshold angles at a sampling rate of 200 ms. The 25-degree threshold includes too many insignificant movements that are unlikely to be consciously inputted by the operator. In the ~23 second segment shown it records 57 movements. Whereas at the 70-degree threshold, significant smaller movements are missed – in the same 23 seconds, only 30 movements are recorded. Hence, an operator movement was defined as a change in angle greater than 45 degrees – which was 40 movements for this sample.
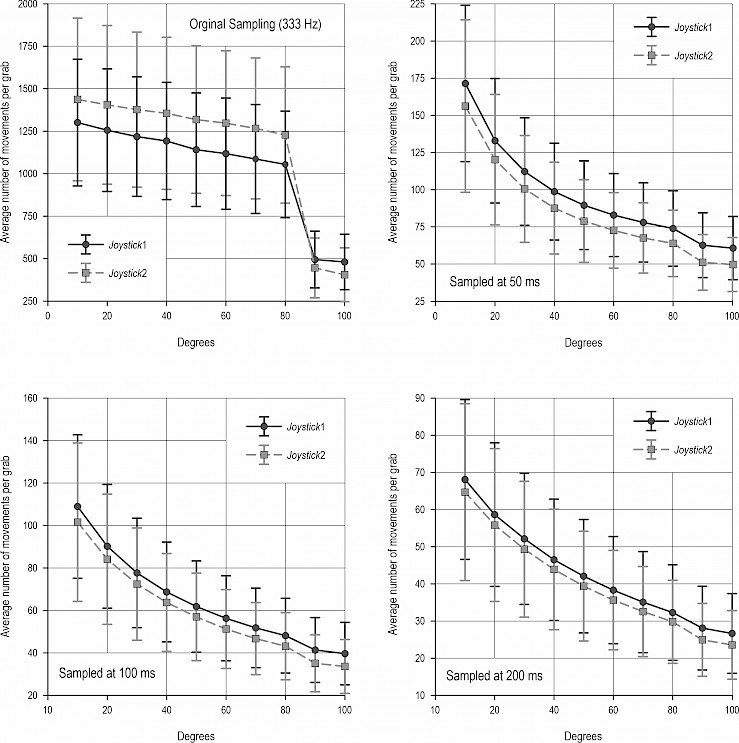
Fig. 3 Comparison of the number of joystick movements calculated at different angles and resampling methods
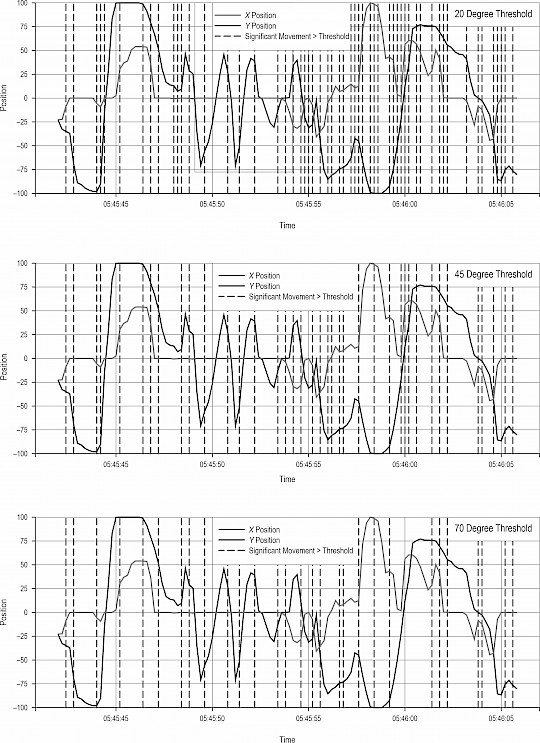
Fig. 4 Significant movement detection at different degree thresholds
3.2 Grab Time and Motion
Table 4 Descriptive statistics of the dataset
|
Time, sec |
# of logs |
Pencil |
Drops |
Joystick1 movements |
Joystick2 movements |
Trigger movements |
Total movements |
|
|
Mean |
21.8 |
4.1 |
0.4 |
0.2 |
44.2 |
41.7 |
21.9 |
107.8 |
|
STD |
7.0 |
2.3 |
0.5 |
0.5 |
15.8 |
15.5 |
10.4 |
38.7 |
|
Minimum |
10.7 |
1.0 |
0.0 |
0.0 |
14.0 |
12.0 |
6.0 |
41.0 |
|
25% |
16.6 |
2.0 |
0.0 |
0.0 |
32.0 |
30.0 |
14.0 |
78.3 |
|
50% |
20.4 |
4.0 |
0.0 |
0.0 |
41.5 |
40.0 |
20.0 |
100.0 |
|
75% |
26.1 |
6.0 |
1.0 |
0.0 |
52.0 |
51.8 |
28.0 |
129.8 |
|
Maximum |
50.6 |
12.0 |
2.0 |
3.0 |
97.0 |
95.0 |
71.0 |
253.0 |
A grab completion time equation (Eq. 3) showed the significant factors influencing completion time. The number of logs, pencilling and dropping were found to be highly significant factors (p<0.001), as expected, due to the extra required movements needed to execute a drop and a pencil. The model shows that for every log in the grab, total completion time increases by that same amount. Notably, the time of day had no significant impact on the completion time. This shows that the operator performs consistently throughout the day.

(F=107.3)
Eq. 4 shows the regression model for joystick1movements (crane slew, and in and out) during a grab. Similarly to the previous model, pencilling, dropping and number of logs significantly affect the number of joystick1movements per grab (p<0.001). Time of day was found to increase the number of joystick1movements by 4.7 from the first cycle to the last.

(F=86.61)
Eq. 5 shows the regression model for joystick2movements (crane up and down, grapple rotation) during a grab. Much like the previous two models pencilling, number of logs and dropping are consistently highly significant variables (p<0.001). However, joystick2 is significantly affected by the UA log grade, decreasing joystick movements by 3.4.

(F=82.14)
Eq. 6 provides the regression model for trigger movements (grapple open and close). Again, like all previous models, pencilling and dropping are highly significant variables. However, for this model, the number of logs showed no significance. This makes sense as the number of trigger movements is unlikely to change as the number of logs increases, as there are no extra requirements for the grapple. This is likely the same for the log grade variable. Time of day also had no significant impact on the number of trigger movements.

(F = 30.35)
Eq. 7 shows the regression model for the combined joystick and trigger movements. As expected, number of logs, pencilling and dropping are again highly significant variables increasing the number of movements by approximately 114 movements. The UA log grade was also found to be significant reducing the number of movements by 7.8.

(F=87.95)
4. Discussion
The five regression models produced analyse the completion time and joystick movements during forwarder loading grabs, all showing a common trend. Number of logs, pencilling and dropping are the key factors affecting forwarder loading operations. Pencilling and dropping are often not the result of forwarding operations but stem from the harvesting process. The results show that, if the processor leaves the log piles covered in a slash or not evenly butted up, there is significant impact on the workload of the forwarder operator in terms of joystick movements, increasing the grab completion time by up to 21 seconds and the total number of movements by ~112. This clearly shows downstream effects from one part of the harvesting operation to the next, in this case, from the harvester to the forwarder. By introducing this type of analysis, operators can see how their individual activities can affect up and downstream processes. This leads to self-driven optimisation of each activity in the harvesting process, potentially improving productivity. Here, CAN bus data can offer accurate and real-time feedback for crews during live operations, allowing them to make timely adjustments.
Detailed movements of the joysticks give insights into the operator style of work and their changes throughout the workday. In this study, the regression models showed limited signs of change in operator performance through the day, only slightly present in joystick1movements model. An increase in the number of joystick movements could be attributed to operator fatigue, among other things. This could suggest that loading cycles are not impacted by operator fatigue. However, this may not be applicable to all operators as data collection was carried out over a single day and only one operator. Increasing the study period and including multiple operators could have yielded more realistic insights into operator fatigue over the course of a working day. CAN bus data and introducing a standardised approach to measure fatigue and performance from joystick movements could offer a unique solution: to provide operators with real-time feedback on their performance and levels of fatigue. This would allow them to adjust in real-time without having to rely on feedback from others at a later stage. Combining these methods and current technologies used in human factors research previously discussed could potentially enhance our understanding of operator-machine interaction.
In Eq. 5 and 7, the UA log grade (Pulp) was shown to reduce the number of joystick2 and total joystick movements by 3.4 and 7.8, respectively. Referring to Table 3, KX and UA are both pulp logs with similar diameter and knot restrictions. However, UA is the only grade that has a length range. The equations show that having a log grade with a range of lengths can reduce operator's workload by up to about seven percent in terms of joystick movements. However, UA was found to have no significant effect on the grab completion time. A larger sample size is needed to come to a definitive conclusion as in this study there were only 49 instances of UA log grabs, although it does show that there is potential for a reduction in joystick movements by introducing log grades with a length range.
This study shows that introducing CAN bus data into analyses rather than relying on traditional time and motion studies offers a more accurate and comprehensive dataset. Using the data from the CAN bus, highly accurate grab completion times were captured at a rate of 333 Hz. This, combined with the additional information on Joystick movements, allows for a more in-depth analysis than previous studies. This study is a pilot for future work into forestry operator inputs in controlling harvesting machinery. It provides a benchmark on how bus data can be collected, processed, and analysed to determine the effects of environmental and working conditions on forest harvesting operators. Future studies should focus on introducing algorithms to accurately detect grabs within a loading cycle like that seen in Bae et al. (2019), who implemented it on excavator activities. This is because the current manual method is time- and labour-intensive and has potential errors. Implementing grab identification allows for larger sample sizes in future studies and real-time feedback to the operator. This would allow more specific answers around the effects of log grade, performance, and harvesting machinery shown in this study. There would also be the opportunity to fine-tune how an operator's movement is defined. There is little previous research on defining forestry machinery joystick operator movements, so this study introduced a method based on an extension of work done in health research. Though the authors believe this method is relatively accurate, it has limitations. For instance, the arctan method relies on changes in angle, but an operator may continue along the same path while accelerating or decelerating. Defining this and other attributes may be needed to capture the entire movement profile and count.
5. Conclusions
Capturing CAN bus data from forest harvesting machines introduces the opportunity for more in-depth analysis of harvesting operations compared to traditional time and motion studies. The joystick inputs and completion time for each grab in a loading cycle of John Deere 1910E were analysed to determine if other environmental impacts not considered in previous studies influenced forwarder performance. Pencilling, dropping, and number of logs significantly affect efficiency and operator input in loading grabs. Interestingly, time of day had little effect on the operator performance.
The data and analysis in this study present a clear implementation for CAN bus data in monitoring operator performance and potentially enhancing operator training. The methodology provided should help other researchers investigate similar effects in their forwarding operations or adapt it to suit other machines in harvesting operations. With advances in machine learning and artificial intelligence, it may also be possible to introduce this methodology on a large scale and in real-time.
Acknowledgments
The authors wish to thank Keith Raymond and Forest Growers Research for their support, Simon Brand, Shane Hubbard and Brand Logging Ltd for their help with data acquisition, and Dr. Richard Parker from Scion for his expertise.
6. References
Bae, J., Kim, K., Hong, D., 2019: Automatic Identification of Excavator Activities Using Joystick Signals. Int. J. Precis. Eng. Manuf. 20(12): 2101–2107. https://doi.org/10.1007/s12541-019-00219-5
Gacem, A., Monacelli, E., Wang, T., Rabreau, O., Al-ani, T., 2020: Assessment of Wheelchair Skills Based on Analysis of Driving Style. Cogn. Tech. Work 22(1): 193–207. https://doi.org/10.1007/s10111-019-00563-6
Gagliardi, K., Ackerman, S., Ackerman, P., 2020: Multi-Product Forwarder-Based Timber Extraction: Time Consumption and Productivity Analysis of Two Forwarder Models Over Multiple Products and Extraction Distances. Croat. J. For. Eng. 41(2): 231–242. https://doi.org/10.5552/crojfe.2020.736
Häggström, C., 2015: Human Factors in Mechanized Cut-to-Length Forest Operations. PhD Thesis, Department of Forest Biomaterials and Technology, Swedish University of Agricultural Sciences: Umeå, 1–77.
Heinimann, H., 2007: Forest Operations Engineering and Management – The Ways behind and Ahead of a Scientific Discipline. Croat. J. For. Eng. 28(1): 107–121.
Hrisca, D., 2024: Asammdf [Computer software]. https://github.com/danielhrisca/asammdf?tab=readme-ov-file
Laurikkala, M., Suzuki, S., Vilkko, M., 2016: Predicting Operator's Cognitive and Motion Skills from Joystick Inputs. Proceedings of the IECON 2016 – 42nd Annual Conference of the IEEE Industrial Electronics Society, Florence, Italy, 5935-5940. https://doi.org/10.1109/IECON.2016.7792994
Manner, J., 2015: Automatic and Experimental Methods to Studying Forwarding Work. PhD Thesis, Department of Forest Biomaterials and Technology, Swedish University of Agricultural Sciences: Umeå, 1–71.
Manner, J., Palmroth, L., Nordfjell, T., Lindroos, O., 2016: Load Level Forwarding Work Element Analysis Based on Automatic Follow-up Data. Silva Fenn. 50(3): 1546. https://doi.org/10.14214/sf.1546
Mavridis, N., Pierris, G., Gallina, P., Moustakas, N., Astaras, A., 2015: Subjective Difficulty and Indicators of Performance of Joystick-Based Robot Arm Teleoperation with Auditory Feedback. Proceedings of the 2015 International Conference on Advanced Robotics (ICAR); Istanbul, Turkey, 91–98. https://doi.org/10.1109/ICAR.2015.7251439
Nicholls, A., Bren, L., Humphreys, N., 2004: Harvester Productivity and Operator Fatigue: Working Extended Hours. Int. J. For. Eng. 15(2): 57–65. https://doi.org/10.1080/14942119.2004.10702497
O'Connor, B., 2023: Biofeedback on Forestry Machine Operators. MSc Thesis, University of Waikato, New Zealand, 1–71.
Proto, A.R., Macrì, G., Visser, R., Harrill, H., Russo, D., Zimbalatti, G., 2018a: A Case Study on the Productivity of Forwarder Extraction in Small-Scale Southern Italian Forests. Small-Scale For. 17(1): 71–87. https://doi.org/10.1007/s11842-017-9376-z
Proto, A.R., Macrì, G., Visser, R., Harrill, H., Russo, D., Zimbalatti, G., 2018b: Factors Affecting Forwarder Productivity. Eur J Forest Res 137(2): 143–151. https://doi.org/10.1007/s10342-017-1088-6
Rabreau, O., Chevallier, S., Chassagne, L., Monacelli, E., 2019: SenseJoy, a Pluggable Solution for Assessing User Behavior during Powered Wheelchair Driving Tasks. J Neuroeng Rehabil 16(1): article number 134. https://doi.org/10.1186/s12984-019-0613-x
Škvor, P., Jankovský, M., Natov, P., Dvořák, J., Zlatuška, K., 2022: The Effect of Different Road Types on Timber Truck Drivers by Assessing the Load Environment of Drivers by Monitoring Changes in Muscle Tension. Forests 13(10): 1565. https://doi.org/10.3390/f13101565
Sokolov, A., Seliverstov, A., Sukhanov, Y., 2023: Forest Machine Automation and Ergonomics. E3S Web of Conf. 389: 03002, https://doi.org/10.1051/e3sconf/202338903002
Sorrento, G.U., Archambault, P.S., Routhier, F., Dessureault, D., Boissy, P., 2011: Assessment of Joystick Control during the Performance of Powered Wheelchair Driving Tasks. J Neuroeng Rehabil 8(1): article number 31. https://doi.org/10.1186/1743-0003-8-31
Spencer, G., Mateus, F., Torres, P., Dionísio, R., Martins, R., 2021: Design of CAN Bus Communication Interfaces for Forestry Machines. Computers 10(11): 144. https://doi.org/10.3390/computers10110144
Spencer, G., Torres, P., 2022: New Can Bus Communication Modules for Digitizing Forest Machines Functionalities in the Context of Forestry 4.0. In IEEE Access 11: 9058–9066. https://doi.org/10.1109/ACCESS.2022.3232286
Stankić, I., Poršinsky, T., Tomašić, Ž., Tonković, I., Frntić, M., 2012: Productivity Models for Operational Planning of Timber Forwarding in Croatia. Croat. J. For. Eng. 33(1): 61–78.
Suvinen, A., 2006: Economic Comparison of the Use of Tyres, Wheel Chains and Bogie Tracks for Timber Extraction. Croat. J. For. Eng. 27(2): 81–102.
Szewczyk, G., Spinelli, R., Magagnotti, N., Tylek, P., Sowa, J., Rudy, P., Gaj-Gielarowiec, D., 2020: The Mental Workload of Harvester Operators Working in Steep Terrain Conditions. Silva Fenn. 54(3): 10355. https://doi.org/10.14214/sf.10355
Tiernan, D., Zeleke, G., Owende, P.M.O., Kanali, C.L., Lyons, J., Ward, S.M., 2004: Effect of Working Conditions on Forwarder Productivity in Cut-to-Length Timber Harvesting on Sensitive Forest Sites in Ireland. Biosyst. Eng. 87(2): 167–177. https://doi.org/10.1016/j.biosystemseng.2003.11.009
Visser, R., 2023: Cost and Productivity Benchmarking Update 2022. Harvesting Technical Note, Forest Growers Research Ltd, Rotorua, New Zealand.
© 2025 by the authors. Submitted for possible open access publication under the
terms and conditions of the Creative Commons Attribution (CC BY) license (http://creativecommons.org/licenses/by/4.0/).
Authors' addresses:
Patrick Humphrey, *
e-mail: patrick.humphrey@pg.canterbury.ac.nz
Campbell Harvey, PhD
e-mail: campbell.harvey@canterbury.ac.nz
Prof. Rien Visser, PhD
e-mail: rien.visser@canterbury.ac.nz
Trevor Best, PhD
e-mail: trevor.best@canterbury.ac.nz
University of Canterbury
School of Forestry
Forest Engineering
20 Kirkwood Avenue
8041, Christchurch
NEW ZEALAND
Brionny Hooper
e-mail: brionny.hooper@scionresearch.com
Scion
Human Factors
10 Kyle Street
8011, Christchurch
NEW ZEALAND
* Corresponding author
Received: November 19, 2024
Accepted: June 09, 2025
Original scientific paper