Manipulating Chain Type and Flail Drum Speed for Better Fibre Recovery in Chain-Flail Delimber-Debarker-Chipper Operations
doi: https://doi.org/10.5552/crojfe.2020.632
volume: 41, issue: 1
pp: 12
- Author(s):
-
- Spinelli Raffaele
- Mitchell Rick
- Brown Mark
- Magagnotti Natascia
- McEwan Andrew
- Article category:
- Original scientific paper
- Keywords:
- harvesting, eucalyptus, comminution, fuel, efficiency
Abstract
HTML
A chain-flail delimber-debarker-chipper (CFDDC) was adapted for treating smaller trees than normal by replacing the standard flails with lighter ones, and by reducing flail drum rotation speed. The machine produced 16 full containers (24 t each) for the standard configuration and 24 full containers for the innovative one. For each container the researchers measured: original tree mass, chip mass, time consumption and fuel use. Results indicated that the innovative setting accrued a 12% improvement on fiber recovery compared with the standard setting (control). At the same time, productivity increased by 20% and fuel consumption was reduced by 30%. Product quality was largely unaffected, with bark content remaining below the 1% threshold specification. If at all, product quality was improved through the reduction of fine particles, possibly derived from less diffused fraying. These results have triggered the real scale adoption of the new setting by contractors who participated in the study. The success of the innovative treatment is likely explained by its better alignment with the weaker structure of small trees from low-yielding stands.
Manipulating Chain Type and Flail Drum Speed for Better Fibre Recovery in Chain-Flail Delimber-Debarker-Chipper Operations
Raffaele Spinelli, Rick Mitchell, Mark Brown, Natascia Magagnotti, Andrew McEwan
Abstract
A chain-flail delimber-debarker-chipper (CFDDC) was adapted for treating smaller trees than normal by replacing the standard flails with lighter ones, and by reducing flail drum rotation speed. The machine produced 16 full containers (24 t each) for the standard configuration and 24 full containers for the innovative one. For each container the researchers measured: original tree mass, chip mass, time consumption and fuel use. Results indicated that the innovative setting accrued a 12% improvement on fiber recovery compared with the standard setting (control). At the same time, productivity increased by 20% and fuel consumption was reduced by 30%. Product quality was largely unaffected, with bark content remaining below the 1% threshold specification. If at all, product quality was improved through the reduction of fine particles, possibly derived from less diffused fraying. These results have triggered the real scale adoption of the new setting by contractors who participated in the study. The success of the innovative treatment is likely explained by its better alignment with the weaker structure of small trees from low-yielding stands.
Keywords: harvesting, eucalyptus, comminution, fuel, efficiency
1. Introduction
Chain-flail delimber-debarker-chippers (CFDDC) are large industrial machines, specifically designed for producing bark-free chips from whole trees in one single pass (Sessions and Kellogg 1994). To this purpose, CFDDCs integrate two functional elements: a chain-flail delimber-debarker and a disc chipper (Thompson and Sturos 1991). The former knocks off branches and bark from whole trees by using hardened chain links mounted on fast-rotating drums, while the latter turns bark-free stem wood into clean pulp chips (McEwan et al. 2019). These machines are specifically designed for handling relatively small trees (0.1–0.4 m3), because they can handle multiple trees per cycle and can turn them into a usable product, even those tree portions that are too small or too malformed for recovering with any other processing systems (Ghaffariyan and Sessions 2012).
The high productivity of CFDDC units has been documented by many studies over time, including a very recent long-term experiment based on 60,000 individual load records (Spinelli and De Arruda Moura 2019). Taken together, these studies confirm that the productivity of industrial CFDDCs varies from 35 to over 80 fresh tons per productive machine hour (PMH), excluding delays (Spinelli et al. 2002, Spinelli and Hartsough 2006). Most interestingly, none of these studies was able to produce a strong relationship between productivity and stem size, since the strongest models yet estimated have a coefficient of determination R2 around 0.30 (McEwan et al. 2019, Hartsough et al. 2002, Ghaffariyan et al 2013). The low explanatory power of CFDDC productivity functions is the best witness to the capacity of these machines to compensate for the effect of small tree size through mass-handling: as tree size gets smaller, more trees are gathered in a load, in order to stabilize throughflow (Mooney et al. 2000). As a result, such systems will tend to produce even-sized loads, thus reducing the range of variation that can be explored in a load-level study and dampening the effect of tree size on productivity, at the same time (McEwan et al. 2017).
Many other studies document the high value recovery obtained when deploying CFDDCs, which is generally attributed to the capacity of using trees (Markham 1995) and tree portions (Favreau 1993) that would be discarded with traditional roundwood systems. In particular, CFDDCs can use tree tops down to very small diameters (Buggie 1991), they can recover large branches (Rodden 1994) and they incur no cross-cutting losses (Favreau 1997), contrary to most roundwood systems. With CFDDCs, fibre recovery rate may soar to over 95% (Favreau 1992, Flanders 1994, Hartsough et al. 2000), with a 25% improvement over conventional roundwood systems (Rodden 1991, Stephenson 1989). In fact, CFDDC operations seem to have better fibre recovery compared with conventional full tree operations, where roundwood is produced at the landing, instead of clean chips (Stokes and Watson 1991). Of course, some fibre still turns up in the residue pile, and this amount has been variously quantified around 5% (Raymond 1989, Raymond and Franklin 1990). Losses are higher when dealing with small trees (Araki 1996), and the growing interest towards small-tree harvesting motivates focused improvement efforts specifically addressing the case of small trees. Fibre losses incurred when using CFDDCs on small trees derive mostly from flailing rather than chipping (Hartsough et al. 2000), and therefore any attempts to further increase fibre recovery should focus on the chain flail component. In that regard, one may reasonably assume that losses are caused by high breakage rates derived from a poor match between the resistance offered by smaller stems and the energy applied through the flails. Standard flails may apply more energy than required for knocking off the relatively thin branches of small trees, breaking part of the stems in the process. If so, the obvious solution would be to reduce flailing force by decreasing drum rotational speed and/or installing lighter chains. In turn, applying less energy for the same throughput should result in higher fuel efficiency, while increasing volume recovery should have a positive impact on productivity (i.e. more usable product in the same time). These would be some of the main benefits of machine optimization. One possible drawback would be a decay of product quality, if flailing energy became so low that unacceptable amounts of bark and small branches would end up in the clean chip pile.
Therefore, the goal of this study was to determine if the installation of new lighter chains operated at a slower speed would result in a measurable increase of fibre recovery, productivity and fuel efficiency without incurring any significant decay of product quality. In particular, the null hypothesis was that of no significant differences in the mean recovery rate, productivity, fuel efficiency and product quality between the standard setting or control treatment (heavy chains operated at full speed) and the new setting (light chains operated at reduced speed).
2. Materials and Methods
2.1 Operation
The trial was conducted from August 16th to August 24th, 2018 in a low-yield E. globulus (bluegum) plantation near Albany in Western Australia (Table 1). The trial site had a long-term annual average rainfall of 602 mm (nearest weather station in Frankland Vineyards, 34.44°S 116.99°E). The study area was 21.1 ha. Soil had contrasting texture (duplex gravely) and was relatively flat (slope less than 7%).
Table 1 Description of the site and operation
|
Location |
Albany (WA) |
|
Plantation |
Tomkins |
|
Compartment |
9 |
|
Surface area |
21.1 ha |
|
Latitude |
34.38360°S |
|
Longitude |
117.23340°E |
|
Slope gradient |
< 7% |
|
Soil |
Duplex gravely |
|
Mean rainfall |
602 mm year-1 |
|
Species |
E. globulus Labill. |
|
Age |
12 years |
|
Rotation |
Second |
|
Stocking |
64 t ha-1 |
|
Mean stem size |
0.01 m3 ub |
|
Treatment |
Clearcut |
|
Felling |
1 x Tigercat 726 |
|
Extraction |
2 x Tigercat 630 |
|
Chipping |
1 x Peterson 5000H |
|
Notes: Stocking in fresh mass of bark-free chips m3 ub = cubic meter under bark |
|
The plantation was a second rotation, originally harvested in 2006 (12 years old). Two years after harvest, the coppice was thinned with the purpose of releasing the best stem(s). At the time of harvest, the total stocking was 64 t ha-1 (fresh mass of bark-free chips). Trees had an average stem size of 0.01 m3 under bark, which was smaller than normally expected from fast-growing industrial plantations of this type, and well represented the case of small trees that was the main subject of the study.
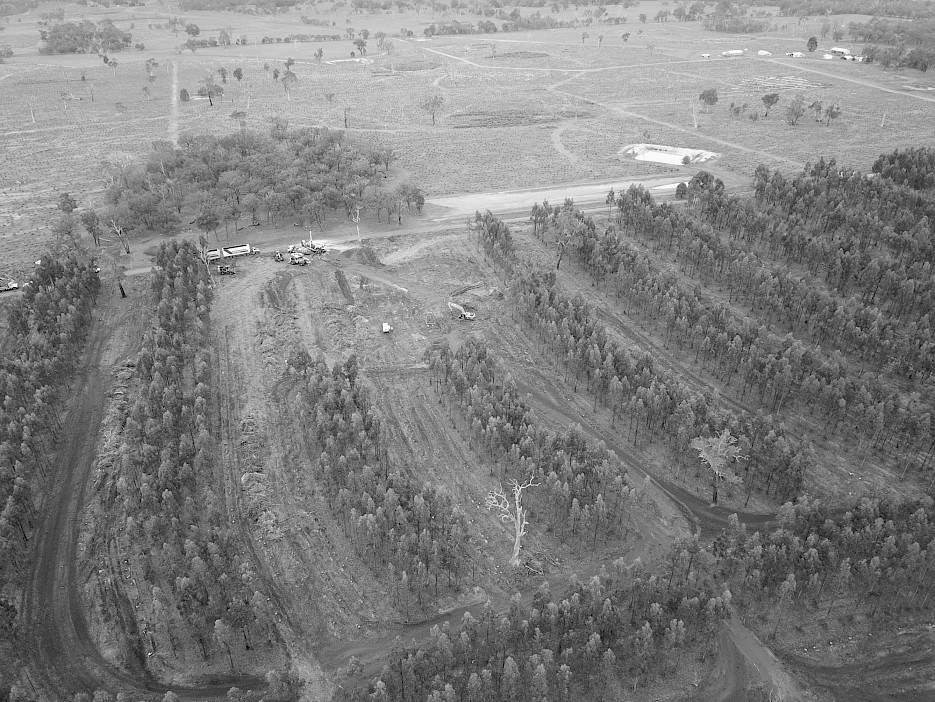
Fig. 1 A bird's eye view of the operation
The plantation was harvested for clean pulp chips, using a fully-mechanized full-tree system (Fig. 1). In particular, trees were cut with a Tigercat 726 drive-to-tree feller buncher, which took three-rows swaths (gullets) and accumulated cut trees into large bunches, each corresponding to a skidder load. Bunches were collected by two Tigercat 630 grapple-skidders and moved to a Peterson Pacific Model 5000H CFDDC, powered by a 840 kW diesel engine. The CFDDC operator had over 3 years experience using this or similar machines.
The flail component in the CFDDC consisted of three drums: two delimber-debarkers proper, and a sweeper positioned downstream from them. Each of the two delimber-debarker drums carried 60 chain flails, while the sweeper only carried 42 chain flails. After passing through the flail apparatus, clean stems were moved to a four-pocket chipper disc with a diameter of 1.67 m, which chipped the stems and accelerated the chips through a spout and into the chip trucks. All chip trucks consisted of truck tractors with semi-trailers pulling drawbar trailers (i.e., Pocket road trains). These vehicles were 27 m long, with a maximum loaded mass of 79 t and a tare mass of 25 t, resulting in a payload of ca. 50 t.

Fig. 2 Standard square chain flails (left) and new lightweight oval chain flails (right)
For the purpose of the study, the CFDDC was operated under the following three treatments:
Þ Control – this was the standard setting normally used by most contractors processing bluegum, with flail drums turning at 661 revolutions per minute (rpm) or 69 rad s-1. Flails consisted of 17 mm diameter chain segments, with five square links and three oval links at the end, which fit into the drum (Fig. 2 left). The mass of the single flail was 2492 g, when new
Þ Light – in this case the standard flails were replaced with light flails. These were constructed from 15 mm diameter chain, all eight links being oval (Fig. 2 right). Drum speed remained unchanged at 661 rpm. The mass of the single flail was 1919 g, when new – that is 20% lighter than the standard 17 mm flail
Þ Light Slow – flail selection was the same as for Light, but drum speed was reduced to 450 rpm (47 rad s-1).
2.2 Measurements
The research consisted of three main components: a productivity and fuel efficiency study, a fibre recovery study and a chip quality study.
Productivity and fuel efficiency were estimated by associating chip mass output with time and fuel inputs. To this purpose, chip mass was obtained from the certified weighbridge available at the receiving mill, the time required to fill a chip truck was recorded with a stopwatch and the fuel consumed during chipping was measured by using a metering pump for refilling the tank to the same level after each chip truck had been loaded full with chips. The observation unit was the single load, weighing approximately 50 t. The study was based on eight observations (loads) for Control, six observations for the Light treatment and 12 observations for the Light Slow treatment.
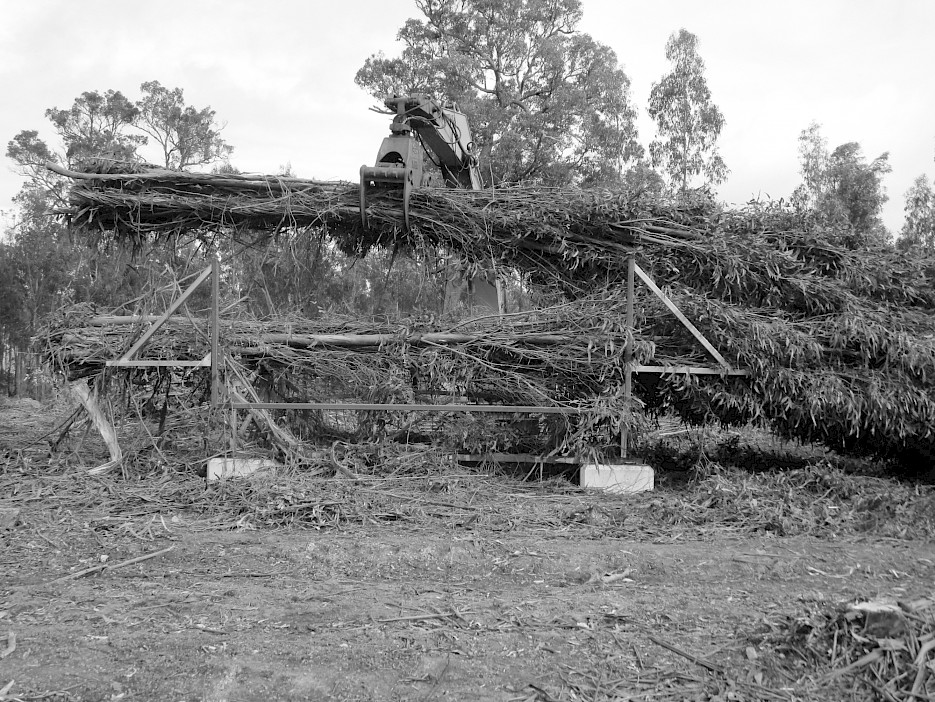
Fig. 3 Loading incoming tree bunches on portable scale
Fibre recovery was estimated by matching the mass of a chip load with the raw mass of the trees fed to the CFDDC in order to produce that same chip load. The latter was obtained from the certified weighbridge at the mill, while the former was determined with a portable scale directly at the landing, before feeding the tree bunches to the chipper. Here the challenge was to avoid that the trees touched the ground during weighing. To that end, researchers used a purpose-built locally-manufactured steel frame (MCB Construction – Albany WA) with a 6 m long base, 3 m wide horizontal members and 2 m wide uprights (Fig. 3). This was mounted on a steel platform bolted to four solid 250 kg concrete blocks. Two-meter extensions were bolted at each end of the frame to assist in keeping branches and crowns from touching the ground. A trench was excavated by the skidders at the crown end of the frame as a precaution to prevent some longer tree crowns from touching the ground. Platform and frame were connected to four MT412 load cells, each with a capacity of 3 t (total = 12 t). The four load cells were fitted to a junction box with a 15 m extension cord and connected to a Millennium Mechatronics model MI102S digital weight indicator readout for displaying tree pack weights. All tree packs going into a load were kept separate, so that one could safely associate the weights of the original trees with those of the clean chips produced from them. In this instance, it was possible to separate the weights of each trailer (two trailers per chip truck), so that the number of observations doubled to 16 for Control, 12 for the »Light« treatment and 24 for the »Light Slow« treatment. All trees were weighed and chipped fresh the same day when they were cut down: no trees were left on the ground overnight so that drying could not bias the comparison.
Table 2 Specifications used in the study for the required percentage of chips in each size class and the maximum allowable percentage of bark
|
>28.6 mm % |
4.8 – 28.6 mm % |
9.5 – 22.2 mm % |
<4.8 mm % |
Bark % |
|
<5 |
>92 |
>55 |
<3 |
<1.0% |
Chip quality was determined at the receiving plant, where 2 kg samples were collected from the trucks upon arrival during the unloading process. Samples were taken to the plant lab for determining bark content and particle size using a Kazon automatic vibration separator with circular screens, according to classes in Table 2. Accepts were all those particles with a size included between 28.6 mm and 4.8 mm, except for bark that was always undesirable, regardless of particle size. The plant lab processed 12 samples each for the Control and the Light Slow treatments. Only one sample was analysed for the Light treatment, which was therefore excluded from the chip quality data base. For better clarity, Table 3 shows a summary of the experimental design described above.
Table 3 Main characteristics of the experimental design
|
Study focus |
Observation |
n° observations per treatment |
||
|
type |
Control |
Light |
Light slow |
|
|
Productivity and fuel efficiency |
50 t full load |
8 |
6 |
12 |
|
Fibre recovery |
25 t half load |
16 |
12 |
24 |
|
Chip quality |
2 kg sample |
12 |
1 |
12 |
|
Notes: The single observation for chip quality in the »Light« treatment was later removed from the study and chip quality comparisons were only made between the »Control« and the »Light slow« treatments |
||||
2.3 Data Analysis
The dataset was analyzed with SAS StatView 5.1 advanced statistics software, in order to extract descriptive statistics and to check the statistical significance of any differences between the mean and median values of the main parameters characterizing the three treatments on trial. Before analysis, the data were tested for normality using Ryan-Joyner's test, and for homoscedasticity using Bartlett’s test. The distribution of most of the original dataset violated the normality assumption and, therefore, centrality was described through median values rather than mean values. For the same reason, the significance of any eventual differences was tested with Kruskal–Wallis non-parametric test, which is robust against violations of the parametric assumptions, and can easily accommodate for unequal numbers of observations. In all analyses, the elected significance level was α<0.05.
The study covered 27 h of effective work time, during which the CFDDC produced 1348 t of clean chips and used 4231 l of diesel fuel.
3. Results
3.1 Productivity and Fuel Efficiency
Table 4 Results of productivity and fuel efficiency study
|
Treatment |
Mean |
Median |
SD |
min |
max |
n |
MR |
|
|
Productivity |
Control |
45.7 |
42.0 |
13.4 |
31.5 |
76.7 |
8 |
7.4 |
|
t PMH-1 |
Light |
50.4 |
47.6 |
7.5 |
43.6 |
62 |
6 |
13.2 |
|
p = 0.0120 |
Light slow |
59.7 |
51.7 |
18.8 |
47.4 |
101.7 |
12 |
17.8 |
|
Fuel use |
Control |
3.8 |
3.9 |
0.6 |
2.5 |
4.7 |
8 |
20.4 |
|
l t-1 |
Light |
3.2 |
3.3 |
0.3 |
2.8 |
3.5 |
6 |
16.0 |
|
p = 0.0009 |
Light slow |
2.6 |
2.5 |
0.4 |
2.2 |
3.7 |
12 |
7.7 |
|
Notes: SD = Standard deviation n = number of observations MR = Mean Rank returned by Kruskal-Wallis non parametric test PMH = Productive machine hours, excluding delays p = p-Value returned by Kruskal-Wallis non-parametric test |
||||||||
Median productivity varied from 42 to almost 52 t PMH-1, depending on treatment (Table 4). Mean fuel consumption also varied with treatments, and ranged between 2.5 and 3.9 l t-1. The best performance was obtained with the Light Slow treatment, which was 20% more productive than the Control treatment, and used over 30% less fuel per ton. The Light treatment also offered a margin of improvement over the Control treatment, although smaller. Differences were statistically significant at the 5% level. Table 4 also reports the P-value and the Mean rank values associated with each treatment, according to the Kruskal-Wallis test. An immediate visual representation of the data spread and of the differences between treatments is shown in the form of box plots (Fig. 4).
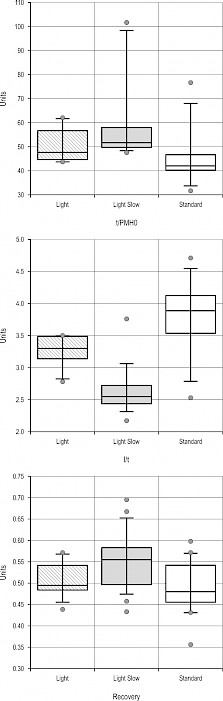
Fig. 4 Box plot of Productivity (top), Fuel consumption (middle) and Fibre recovery data (bottom)
3.2 Fibre Recovery
Median fibre recovery varied from 48 to 55%, depending on treatment (Table 5). Implementation of the Light slow treatment resulted in a 7 points increase of fibre recovery over the Control treatment, with a 14% improvement in relative terms. This difference was statistically significant. In contrast, differences between the Light treatment and the other two treatments had no statistical significance, further confirming the transitional significance of this intermediate treatment.
Table 5 Results of fibre recovery study
|
Treatment |
Mean |
Median |
SD |
min |
max |
n |
MR |
|
|
Fibre |
Control |
49 |
48 |
6.1 |
36 |
60 |
16 |
19.2 |
|
Recovery |
Light |
51 |
49 |
4.2 |
44 |
57 |
12 |
22.7 |
|
% Mass |
Light slow |
55 |
55 |
6.8 |
43 |
70 |
24 |
33.3 |
|
Notes: SD = Standard deviation n = number of observations MR = Mean Rank returned by Kruskal-Wallis non parametric test p = p-Value returned by Kruskal-Wallis non-parametric test |
||||||||
3.2 Chip Quality
Median bark content was 0.3 and 0.4% for the Control treatment and the Light slow treatment, respectively (Table 6). Statistical analysis did not detect any significant differences between the two treatments. In both treatments, two out of twelve samples exceeded the 1% threshold specification - but again there was no difference between treatments. No significant difference was found for the proportion of accepts, which averaged 88%. The only significant difference between treatments concerned the proportion of fines and of small-size particles (9.5 mm and below), which was lower for the Light slow treatment - possibly the result of less fraying at the small ends of the flailed stems.
Table 6 Results of chip quality study (% of sample weight)
|
Particle |
Mean |
Median |
MW test |
||
|
size class |
Control |
Light slow |
Control |
Light slow |
P-Value |
|
>28 mm |
9.2 |
10.0 |
8.8 |
9.0 |
0.3261 |
|
28 to >22 |
21.6 |
22.4 |
20.8 |
22.5 |
0.2481 |
|
22 to >9 |
60.6 |
60.1 |
60.6 |
60.3 |
0.8173 |
|
9 to >5 |
6.7 |
5.9 |
6.8 |
5.7 |
0.0179 |
|
Fines |
1.4 |
1.0 |
1.3 |
1.0 |
0.0010 |
|
Bark |
0.5 |
0.7 |
0.3 |
0.4 |
0.3863 |
|
Accepts |
88.9 |
88.4 |
88.2 |
88.5 |
0.6033 |
|
Notes: MW = non-parametric Mann-Whitney test Fines = ≤5 mm Accepts = sum of particles with length between 28 mm and >5 mm |
|||||
4. Discussion
4.1 Limitations of the Study
First of all, one must disclose and address the main limitations of this study, which are essentially two: the unbalanced observation numbers and the imperfect experimental design.
The dataset for productivity, fuel efficiency and fibre recovery contained an uneven number of observations for the three treatments on test, which may have affected the results of an analysis performed with parametric techniques. For this reason, these data were analysed with non-parametric techniques, which used rankings and were quite robust against violations of the standard assumptions, including datapoint unbalance.
Concerning the experimental design, the main concerns were the absence of a treatment covering the case of standard 17 mm chains run at reduced speed, and the lack of sufficient chip quality data for the Light treatment. Without a fourth treatment covering the use of standard chains at reduced speed, one could not implement a full factorial design that included all combinations of the two chain types (17 mm and 15 mm) and the two speed regimes (661 rpm and 450 rpm). However, the heavier 17 mm chains were unlikely to gain sufficient momentum if rotated at the slower speed setting, which was the main reason why this combination was not tried. While a full factorial design would have allowed exploring the relative contributions of chain type and rotational speed, renouncing this benefit would not otherwise invalidate the comparison between treatments, which still included the main three options actually available.
As to the lack of sufficient chip quality data for the Light treatment, that was very unfortunate and it prevented a comprehensive evaluation of this treatment – one that would include the possible effects on chip quality. However, there is every reason to believe that the chip quality figures obtained for the Light treatment would likely place somewhere between those obtained for the other two treatments, since that is what occurred for all other indicators. If so, one may postulate the case of no significant difference between the chip quality obtained with the Light treatment and that obtained with the other treatments, since the latter did not differ significantly between themselves. In any case, it is worth mentioning that the contractors involved with the study shifted to the Light slow setting as their new standard setting, which contributed to define the Light treatment as a transitional adjustment of relatively little consequence in real practice.
Finally, it is worth mentioning that small branches may have occasionally touched the ground, despite the use of a purpose-built frame and the attention paid by the research team to make sure that no contact was established between the loads being weighed and the ground. However, if such instances occurred, they were few and concerned very small elements only, making it very unlikely that measurement accuracy was affected in any meaningful way. Furthermore, occasional contact with the ground would represent a random error that would equally affect both treatments and would not invalidate the comparative character of this study.
4.2 Comparison with Literature Figures
The productivity figures obtained from this study were deep within the bracket defined by earlier studies, and spanned from 35 to 80 t PMH-1 (Spinelli et al. 2002, Acuna et al. 2009, Spinelli and De Arruda Moura 2019). In fact, the most frequent mean values reported in the abundant literature on CFDDC productivity were 45–55 t PMH-1, which were almost an exact match for the figures obtained from this experiment. That alone may prove the absence of any gross errors in the study, together with its potential for generalization.
In contrast, fuel consumption levels estimated in this experiment were higher than those reported in the few recent studies that specifically addressed fuel consumption of a CFDDC unit of the same type deployed on eucalyptus (Spinelli et al. 2018, Strandgard et al. 2019). The 2019 study estimated fuel consumption at 2.3 l per green ton, which is at the lowest end recorded in the present experiment. Difference was even higher for the 2018 study, which estimated fuel consumption between 1.3 and 1.6 l m-3 half as high as recorded in this study. Inflating this figure by ca. 10% to account for the density of fresh eucalypt wood (Spinelli et al. 2004) could not bridge the wide gap between the two estimates. A partial explanation could be obtained from the fact that the two studies represented the two opposite extremes of CFDDC operations: the present study described the case of a failed plantation, offering unfavourable work conditions that resulted in a relatively low net productivity level; in contrast, the study by Spinelli et al. (2018) represented a best case scenario, where tightly managed operations were deployed on high-yielding plantations and achieved some of the highest productivity levels yet recorded in the existing literature. Under such variable circumstances, one would expect proportionally variable results. Nevertheless, the difference is quite large and one may presume that part of that difference may derive from the rather crude method used in this study for estimating fuel consumption: it is known that the refill method is relatively inaccurate when used on small work batches, with the size of one or few loads (Fathollahzadeh et al. 2011). In any case, the eventual error would affect all treatments equally, and therefore it could not invalidate the comparison in this study.
Few studies are available for fibre recovery, and they tend to indicate higher figures than reported in this article (Wiedemann and Ghaffariyan 2010, Mitchell and Wiedemann 2012). In particular, two studies conducted on hybrid poplar estimated actual fibre recovery at 70% of the total tree mass (Hartsough et al 2000, 2002). The higher fibre recovery reported in those studies may depend on different species, or on better work conditions offered by higher yielding plantations, or on the combination of these two factors. In fact, a stronger effect may have resulted from the different bark content specifications, which were 3% for the mentioned literature studies and 1% for the present experiment. Obviously, pushing bark content below 1% requires a more aggressive flailing action than needed for matching a 3% specification, which must lead to higher fibre losses. Therefore, there is no shortage of good explanations for the marked difference in fibrerecovery, although there is little direct evidence to substantiate any of them. But again, even if there were errors in the measurements, such errors would have equally impacted all treatments with no prejudice against the comparative value of this study.
However, if the recovery values reported in this study were reasonably accurate – as we believe they were – then the fact that they were much lower than reported in the mentioned literature would point at the urgent need for improvement, giving special value to this study and to the innovative solution it presented. As far as one can tell, conventional machine settings are poorly suited to small trees from low-yielding stands and a large margin exists for optimization measures, such as those presented here.
4.3 Product Yield and Quality
It was reasonable to expect that a reduction of flailing energy would result in lower fuel consumption and higher product recovery – the latter also leading to higher productivity, since a larger proportion of the input material would end in the product bin. Therefore, no great surprise came from the results of this study, which yielded a largely predictable outcome. The crux of the matter was rather the effect of a reduction in flailing energy on product quality, and namely if such reduction would result in an acceptable increase of bark content. Hence, the fundamental importance of the chip quality analyses. These indicated that bark content was indifferent to treatment, confirming the viability of the new setting in actual practice – which was indeed adopted by the contractors as their standard setting at the conclusion of the experiment. The combination of lighter flails and slower drum rotation may have made delimbing and debarking more efficient, not less effective. This new setting was likely better adapted to the weaker structure of small trees from low-yielding stands, and for that reason one may exercise much caution before implementing the new setting on standard operations that handle large full-size trees. Not that the new setting may not offer benefits in that case, too; however, these benefits should not be taken for granted in all cases, and further verification may be needed before applying the new setting to other cases. While discussing product quality, it is also worth commenting on particle size distribution, and on the general absence of any significant differences between the treatments except for fine particles. Again, one may have expected this result, since particle size is largely determined by the chipper rather than the flail component, and chipper settings were not different between treatments. However, particle size is also affected – at least in part – by wood characteristics (Spinelli et al. 2011), which may have been altered by the different flailing modes. In particular, a less aggressive flailing action may result in a less diffused stem fraying, which could explain the significantly lower proportion of small chips and fines in the samples produced with the new setting. Therefore, the new setting may not only guarantee the same good product quality obtained with the older standard setting, but could actually offer some improvements in that domain, too.
5. Conclusions
All indicators point at a significantly better performance of the innovative treatment, where the drum is fitted with lighter chains and run at reduced speed. Compared with the standard setting (control), this innovative setting accrues a 12% improvement on fibre recovery. At the same time, productivity is increased by 20% and fuel consumption is lowered by 30%. Product quality is largely unaffected, with bark content remaining below the 1% threshold specification. If at all, product quality is improved through the reduction of fine particles, possibly derived from less diffused fraying. These results have determined the real scale adoption of the new setting by the contractors who participated in the study. The success of the innovative treatment is likely explained by its better alignment with the weaker structure of small trees from low-yielding stands. For that reason, one may exercise much caution before implementing the new setting on standard operations that handle large full-size trees. In fact, fibre recovery is generally higher for large trees, which may reduce the need for improvements in such operations. Nevertheless, there might still be some margin for improvement, which could be tapped by tweaking machine settings: that could be the subject of future studies aimed at improving CFDDC performance.
Acknowledgments
The authors would like to thank LV Dohnt & Co Pty Ltd, Albany Plantation Forests Ltd, Albany Plantation Export Company, without whose assistance this study would not have been possible.
This project has been partly supported by the Bio Based Industries Joint Undertaking under the European Union’s Horizon 2020 research and innovation program under grant agreement No 745874 »Dendromass4Europe«
6. References
Acuna, M., Wiedemann, J., Strandgaard, M., 2009: Evaluation of an in-field chipping operation in Western Australia. CRC for Forestry Bulletin 4: 4 p.
Araki, D., 1996: Recovery of wood chips from low grade fiber sources. Special Report SR-115. FERIC, Vancouver, BC. 2 p.
Buggie, W.J., 1991: Flail chippers can improve fibre utilization in small softwoods. Canadian Forest Industries Magazine, August/September, 28–31.
Favreau, J., 1992: Peterson-Pacific DDC 5000 delimber-debarker-chipper: new observations. Field note: Processing 29. Forest Engineering Research Institute of Canada, Pointe-Claire, Quebec.
Favreau, J., 1993: Chipping in the woods: Is it for you? Canadian Forest Industries Magazine (June): 26–29.
Favreau, J., 1997: A comparison of fibre loss during full-tree and cut-to-length harvesting. Technical report 118. Forest Engineering Research Institute of Canada, Pointe-Claire, Quebec.
Flanders, L., 1994: Tomorrow’s woodyard will be different – if there will be one at all. Pulp and Paper (July): 53–55.
Fathollahzadeh, H., Mobli, H., Jafari, A., Mahdavinejhad, D., Tabatabaie, S.M.H., 2011: Design and calibration of a fuel consumption measurement system for a diesel tractor. Agricultural Engineering International: the CIGR Journal 13(2): manuscript No. 1408.
Ghaffariyan, M.R., Sessions, J., 2012: Comparing the efficiency of four harvesting methods in a blue gum plantation in south-west Western Australia. CRC for Forestry. Bulletin 29: 4 p.
Ghaffariyan, M., Brown, M., Spinelli, R., 2013: Evaluating efficiency, chip quality and harvesting residues of a chipping operation with flail and chipper in Western Australia. Croatian Journal of Forest Engineering 34(2): 189–199.
Hartsough, B., Spinelli, R., Pottle, S., Klepac, J., 2000: Fiber recovery with chain flail delimbing/debarking and chipping of hybrid poplar. International Journal of Forest Engineering 11(2): 59–65.
Hartsough, B.R., Spinelli, R., Pottle, S.J., 2002: Delimbing hybrid poplar prior to processing with a flail/chipper. Forest Products Journal 52(4): 85–93.
Markham, R., 1995: Making the switch: Avenor’s move to the bush. CPPA Woodlands Paper Magazine (June): 35–37.
McEwan, A.M., Brink, M., Spinelli, R., 2017: Factors affecting the productivity and work quality of chain flail delimbing and debarking. Silva Fenn. 51(2): 1–14. https://doi.org/10.14214/sf.1599
McEwan, A., Brink, M., Spinelli, R., 2019: Efficiency of Different Machine Layouts for Chain Flail Delimbing, Debarking and Chipping. Forests 10(2): 126. https://doi.org/10.3390/f10020126
Mitchell, R., Wiedemann, J., 2012: Volume recovery comparison for four different harvesting systems in short-rotation bluegum plantations. CRC for Forestry. Bulletin 27: 5 p.
Mooney, S., Boston, K., Greene, D., 2000: Production and costs of the chambers delimbinator in first thinning of pine plantations. For. Prod. J. 50(4): 81–84.
Raymond, K., 1989: Fibre loss during debarking. Field Note No. Processing-9. FERIC. Pointe Claire, PQ, 2 p.
Raymond, K., 1990: Peterson-Pacific DDC 5000 delimber-debarker-chipper. Field Note No. Processing-16. FERIC. Pointe Claire, PQ, 2 p.
Raymond, K.A., G.S. Franklin., 1990: Chain flail delimber-debarkers in eastern Canada: a preliminary assessment. Technical Note TN-153. FERIC. Pointe Claire, PQ, 8 p.
Rodden, G., 1991: Flailers find a home with CPFP. Canadian Forest Industries Magazine (August/September): 9–11.
Rodden, G., 1994: Whither Woodyards? Pulp and Paper Canada 95(11): 14–15.
Sessions, J., Kellogg, L. eds., 1994. Proceedings of the meeting on advanced technology in forest operations: applied ecology in action. 17th annual meeting of the Council on Forest Engineering. Corvallis, Oregon 24–29 July. Oregon State University, Corvallis.
Spinelli, R., Hartsough, B., Owende, P., Ward, S., 2002: Productivity and cost of mechanized whole-tree harvesting of fast-growing eucalypt stands. International Journal of Forest Engineering 13(2): 49–60. https://doi.org/10.1080/14942119.2002.10702462
Spinelli, R., Owende, P.M.O., Ward, S.M., Tornero, M., 2004: Comparison of short-wood forwarding systems used in Iberia. Silva Fennica 38(1): 85–94.
Spinelli, R., Hartsough, B.R., 2006: Harvesting SRF poplar for pulpwood: Experience in the Pacific Northwest. Biomass and Bioenergy 30(5): 439–445.
Spinelli, R., Magagnotti, N., Paletto, G., Preti, C., 2011: Determining the impact of some wood characteristics on the performance of a mobile chipper. Silva Fennica 45(1): 85–95.
Spinelli, R., de Arruda Moura, A.C., Manoel da Silva, P., 2018: Decreasing the diesel fuel consumption and CO2 emissions of industrial in-field chipping operations. J. Clean Prod. 172: 2174–2181. https://doi.org/10.1016/j.jclepro.2017.11.196
Spinelli, R., de Arruda Moura, A.C., 2019: Productivity and Utilization Benchmarks for Chain Flail Delimber-Debarkers-Chippers Used in Fast-Growing Plantations. Croatian Journal of Forest Engineering 40(1): 65–80.
Stephenson, E.H., 1989: Flail debarking: a historical perspective and review of current technology. In: B.J. Stokes. ed., Proceedings of the International Energy Agency/Bioenergy Agreement Task VI, activity 3 symposium Harvesting small trees and forest residues. Auburn, Alabama 5–7 June, Auburn, AL: USDA Forest Service, Southern Forest Experiment Station, 162–169 p.
Stokes, B.J., Watson, W.F., 1991: Wood recovery with in-woods flailing and chipping. Tappi Journal 74(9): 109–113.
Strandgard, M., Mitchell, R., Wiedemann, J., 2019: Comparison of productivity, cost and chip quality of four balanced harvest systems operating in a Eucalyptus globulus plantation in Western Australia. Croatian Journal of Forest Engineering 40(1): 39–48.
Thompson, M.A., Sturos, J.A., 1991: Performance of a portable chain flail delimber/debarker processing Northern hardwoods. Research paper NC 297. St. Paul, MN: USDA Forest Service, North Central Forest Experimental Station.
Wiedemann, J., Ghaffariyan, M.R., 2010: Preliminary results: volume recovery comparison of different harvesting systems in short-rotation hardwood plantations. CRC for Forestry, Bulletin 9: 4 p.
© 2018 by the authors. Submitted for possible open access publication under the
terms and conditions of the Creative Commons Attribution (CC BY) license (http://creativecommons.org/licenses/by/4.0/).
Authors’ addresses:
Raffaele Spinelli, PhD *
e-mail: spinelli@ivalsa.cnr.it
Natascia Magagnotti, PhD
e-mail: magagnotti@ivalsa.cnr.it
CNR IVALSA
Via Madonna del Piano 10
I-50019 Sesto Fiorentino
ITALY
Rick Mitchell, MSc
e-mail: rmitchel@usc.edu.au
Mark Brown, MEng
e-mail: mbrown2@usc.edu.au
AFORA
University of the Sunshine Coast
35 Shorts Place Albany, 6330, Western Australia
AUSTRALIA
Andrew McEwan, PhD
e-mail: Andrew.McEwan@nmmu.ac.za
Nelson Mandela University
University Way
Summerstrand, Port Elizabeth, 6019
SOUTH AFRICA
* Corresponding author
Received: March 28, 2019
Accepted: October 15, 2019
Original scientific paper