Time Consumption Analysis of Forwarder Activities in Thinning
doi: https://doi.org/10.5552/crojfe.2020.615
volume: 41, issue: 1
pp: 12
- Author(s):
-
- Hildt Eduardo
- Leszczuk Andrés
- Mac Donagh Patricio Miguel
- Schlichter Tomás Miguel
- Article category:
- Original scientific paper
- Keywords:
- logging, productivity, loading, log size, log concentration, payload, Cut-to-Length
Abstract
HTML
Forwarding can be divided into separate work elements. These are affected by several factors: forwarding distance, load volume, and types of assortments harvested. For a detailed planning of thinning, productivity models should include these factors. This study analysed the time consumption of forwarder thinning operations in five pine plantations in the north-east of Argentina, determining how the log size and log concentration affect each work element. Time-and-motion studies were carried out, recording the activities with digital video cameras, and tracking the forwarder movements with global navigation satellite system (GNSS) receivers. Different linear mixed models were fitted to estimate the time consumption of each work element in relation to different predictive factors. When driving on the road, the forwarders had an average speed of 71.6 m min-1 empty and 75.7 m min-1 loaded. When driving in the stand, the average speed was 56.9 m min-1 empty and 52.2 m min-1 loaded. These speeds did not correlate with the forwarder size or load volume. For the loading and unloading elements, the linear mixed model explained 56% and 49% of the variability considering only the fixed effect of the logs size and the load volume. For driving while loading, the total volume loaded, and the log concentration of the assortment loaded explained 50% of the time consumption variability, with 17% being explained by random effects. The general time and productivity model developed can be applied to support accurate decisions in the process of thinning planning.
Time Consumption Analysis of Forwarder Activities in Thinning
Eduardo Hildt, Andrés Leszczuk, Patricio Mac Donagh, Tomás Schlichter
Abstract
Forwarding can be divided into separate work elements. These are affected by several factors: forwarding distance, load volume, and types of assortments harvested. For a detailed planning of thinning, productivity models should include these factors. This study analysed the time consumption of forwarder thinning operations in five pine plantations in the north-east of Argentina, determining how the log size and log concentration affect each work element. Time-and-motion studies were carried out, recording the activities with digital video cameras, and tracking the forwarder movements with global navigation satellite system (GNSS) receivers. Different linear mixed models were fitted to estimate the time consumption of each work element in relation to different predictive factors. When driving on the road, the forwarders had an average speed of 71.6 m min-1 empty and 75.7 m min-1 loaded. When driving in the stand, the average speed was 56.9 m min-1 empty and 52.2 m min-1 loaded. These speeds did not correlate with the forwarder size or load volume. For the loading and unloading elements, the linear mixed model explained 56% and 49% of the variability considering only the fixed effect of the logs size and the load volume. For driving while loading, the total volume loaded, and the log concentration of the assortment loaded explained 50% of the time consumption variability, with 17% being explained by random effects. The general time and productivity model developed can be applied to support accurate decisions in the process of thinning planning.
Keywords: logging, productivity, loading, log size, log concentration, payload, Cut-to-Length
1. Introduction
Thinning operations of fast-growing pine plantations in the northeast Argentina are carried out with the Cut-to-Length system. In these operations, generally thinning from below, 40–50% of trees with smaller diameter or deficient shape are removed. The average size of the extracted trees does not exceed 0.4 m³, and the volume of wood harvested is around 100–200 m³ ha-1. Up to three assortments are bucked (two sawlogs and one pulpwood) and the share of pulpwood logs is more than 40% (Hildt et al. 2019). The margins of the harvesting contractors depend on a constant increase in productivity and a decrease in production costs (Mac Donagh et al. 2017). In this scenario, the understanding of the forwarding operation is decisive for good planning of the thinning operation in different sites. Forwarding is a complex activity, consisting of several work elements, each of them affected by several factors (Nieminstö et al. 2012, Manner et al. 2016a, Berg et al. 2017). The theoretical analysis and operation planning are intrinsically dependent on the existence of precise time and productivity models (Nurminen et al. 2006, Lindroos and Wästerlund 2014). These models must be situation-independent and must consider the impact of the most important stand and operational characteristics: forwarding distance, harvest intensity, and types of assortments. In general, most of the time and productivity models available were developed in Europe. However, forwarders are common in forest plantations of the Southern Cone and, therefore, it is necessary to develop and adjust models to understand how these factors affect these operations.
The productivity of forest extraction with forwarders depends on timber volume by load and the cycle time consumption (Nurminen et al. 2006). For the purpose of the analysis, the forwarding cycle can be divided into five work elements: driving empty, loading, driving while loading, driving loaded and unloading (Manner et al. 2016a). Other activities can be considered, including driving empty on the road and driving loaded on the road. Based on their loading capacity, forwarders have been classified as light (<10 t), medium (10–14 t) and heavy (>14 t) equipment (Stankić et al. 2012). Around seventy-five per cent of the time is spent on loading, driving while loading and unloading (Manner et al. 2013, Manner et al. 2016a). Therefore, the forwarding distance is not the main productivity explicative factor, requiring an analysis of the factors that affect load formation and unloading (Stankić et al. 2012, Eriksson and Lindroos 2014, Manner et al. 2016a).
Load formation can be divided into two individual activities: crane work while loading and driving while loading (Stankić et al. 2012, Strandgard et al. 2017). The time consumption for driving while loading depends on the timber density on the strip road, also known as log concentration (m3 (100 m)-1) (Nurminen et al. 2006, Manner et al. 2013). The total log concentration is determined by the growing-stock volume of the forest and by the harvest intensity. This variable may be calculated dividing the removal of timber [m3 ha-1] by the total length of the strip road network [m ha-1] (Nurminen et al. 2006). Forwarder log concentration refers to the load-specific log concentration, which depends on the bucking instruction, the assortment distribution at a harvesting site, and the number of assortments forwarded together in a load (Manner et al. 2013). Further, Manner et al. (2013) showed that, in load formation work, the time consumption of driving between piles decreased when increasing the log concentration of the forwarded assortment. This time also decreased when increasing the number of assortments forwarded together in a load. Also, Manner et al. (2016a) found that the driving distance while loading explained 57.2% of the total cycle time variation. By contrast, forwarding distance only explained 49.5% of the total cycle time variation.
Time consumption for loading is affected by assortment loading (sawlog and pulpwood of different length), by timber volume at the loading stop, number of assortments loaded simultaneously and volume loading in each forwarder cycle (Nurminen et al. 2006, Ghaffarian et al. 2007, Stankić et al. 2012). Väätäinen et al. (2006) found that loading time decreases with increasing log pile volume, with a positive effect on productivity. On the other hand, load volume is conditioned by the diameter and length of forwarded assortments (Stankić et al. 2012). Nurminen et al. (2006) found that the time required for loading 1 m3 of wood is 55% lower for sawlogs than for pulpwood. Also, 42% less time is required for loading a single assortment than for loading a combination of two or more assortments.
Productivity models are useful to estimate how productivity is affected by timber removal, number of assortments, log size, density of strip roads and forwarding distance. Most recent approaches to this issue developed general productivity and time models through extensive follow-up data analysis or by time and movement studies of many forwarders working in thinnings and final cuttings (Nurminen et al. 2006, Stankić et al. 2012, Eriksson and Lindroos 2014, Manner et al. 2016b). These have incorporated the effect of the number of logs carried, average log volume, and distance driving while loading, as predictors of the loading time and forwarding productivity, explaining up to 60% of the variability. Now, a combination of tracking with global navigation satellite systems (GNSS) and onboard video recording can result in high precision time studies, with a more detailed analysis of each activity and more explanatory models (Strandgard et al. 2017). Extending these studies to thinning operations in the Southern Cone can help to improve the understanding of the harvesting of fast-growing forests.
This study developed a general model for a group of forwarders working in pine plantations in the north-east of Argentina, to contribute to the understanding of how the forwarded log concentration and log size affected timber forwarding productivity.
2. Materials and Methods
2.1 Study Sites and Machines
This study was conducted in the second thinning of Pinus taeda L. forests, located in the north-east of the Republic of Argentina. The five situations analysed were selected as a representative sample of the mechanized thinning operations performed by harvesting contractors in the northeast of Argentina. Two different sites were evaluated in the department of Santo Tome (Province of Corrientes) and three sites in the departments of Iguazú and Eldorado (Province of Misiones). The thinning was conducted in 11- and 12-years old pine stands managed to produce sawlogs and pulpwood. Climate was subtropical without a dry season. The terrain had a gently rolling relief, with a good bearing capacity. There were no rains during the development of this study. Site 2 had a distance between lines of 4 m, and the forwarder travelled through this place, with 20 m between strip roads. Instead, the other sites only had 3 m between the planting lines, and the thinning implied the cutting of an entire line to make a strip road each 15 m. The road network was formed by consolidated secondary roads where the trucks accessed up to the landings located close to the stands. The distance that the forwarder had to travel from the strip-road to the roadside landing changed along different areas of the stand, with an average of 150 m. This driving took place on consolidated roads or over temporary roads opened to improve the access to the roadside landings (Fig. 1). The aim of the intervention was to extract 50% of the trees, combining the opening of strip roads and thinning of smaller trees. Table 1 presents dasometric characteristics of the stands before and after thinning.
Table 1 Dasometric characteristics of the stands evaluated in each site, before and after thinning
|
Site 1 |
Site 2 |
Site 3 |
Site 4 |
Site 5 |
|
|
Before intervention |
|||||
|
Density, n ha-1 |
600 |
600 |
735 |
933 |
787 |
|
Basal Area, m2 ha-1 |
32.9 |
35 |
37.8 |
44 |
36.8 |
|
Stem size, m3 |
0.515 |
0.5 |
0.383 |
0.449 |
0.433 |
|
After intervention |
|||||
|
Density, n ha-1 |
276 |
300 |
368 |
426 |
409 |
|
Basal Area, m2 ha-1 |
15.5 |
16.5 |
21.7 |
22.9 |
28.36 |
|
Stem size, m3 |
0.553 |
0.55 |
0.290 |
0.523 |
0.686 |
|
Removal of timber, m3 ha-1 |
156 |
135 |
175 |
196 |
60 |
|
Stem size of removed trees, m3 |
0.48 |
0.45 |
0.48 |
0.34 |
0.16 |
|
Assortments |
Sawlog 2.5 m Sawlog 3.15 m Pulpwood |
Sawlog 2.5 m Sawlog 3.15 m |
Sawlog 3.15 m Sawlog 3.75 m Pulpwood |
Sawlog 2.5 m Sawlog 3.15 m |
Sawlog 2.5 m Sawlog 3.15 m Pulpwood |
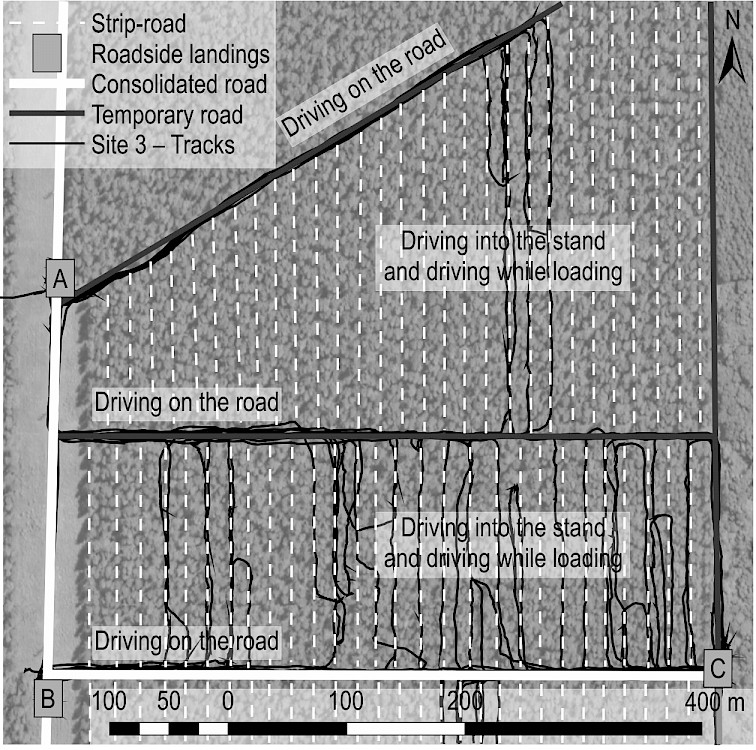
Fig. 1 Example of the structure of roads, landings and strip-roads, together with data generated by GNSS tracking during thinning. This partial sample corresponds to Site 3
In different situations, the harvesting system consisted of a harvester cutting and bucking the trees, and a forwarder hauling the assortments to the roadside. In Site 1, a John Deere 1510E (heavy forwarder) was evaluated. In Site 2, a medium forwarder (John Deere 1410D) was used. In Sites 3 and 4, Bertotto 160TH light forwarders manufactured in Argentina performed the extraction. Finally, logs at Site 5 were transported by a light forwarder Timberjack 230D. Technical characteristics of the forwarders and stands evaluated are shown in Table 2. Different assortments were extracted from each site. However, a combination of assortments in the same load was never used. In all sites, forwarders worked only during the day shift, with a duration of 12 hours, interrupted by a 1-hour break for lunch. The operators who drove the forwarders were experienced workers in performing this task, and previously operated other forwarders and forestry tractor-trailers.
Table 2 Characteristics of forwarders evaluated
|
Site 1 |
Site 2 |
Site 3 |
Site 4 |
Site 5 |
|
|
Forwarder size |
Heavy |
Medium |
Light |
Light |
Light |
|
Forwarder model |
John Deere 1510E |
John Deere 1410D |
Bertotto 160TH |
Bertotto 160TH |
Timberjack 230D |
|
Crane model |
CF785 |
CF785 |
PenzSaur 5.53W |
Guerra 67A |
Kesla 305 |
|
Engine power, kW |
155.8 |
129 |
119.3 |
119.3 |
119.3 |
|
Traction |
8x8 |
8x8 |
4x4 |
4x4 |
4x4 |
|
Mass, kg |
18,630 |
17,500 |
11,700 |
11,700 |
10,718 |
|
Payload, kg |
15,000 |
14,000 |
9000 |
9000 |
7250 |
2.2 Time Study
A time-and-motion study was conducted in each situation. It did not interfere with the operator’s working style or the instructions received by the contractors. Forwarders activities were recorded by a Genius DVR FHD590 digital camera, mounted on the cab. This captured the movements made by the crane when loading and unloading logs (Strandgard et al. 2017). The analysis of the video material was made with a tool developed according to Niemistö et al. (2012) specifications. This allowed accurate determination of the time consumption of each activity in the forwarding cycle (Table 3). In this study, only productive times were considered. Each delay or unproductive activity was identified and isolated from the data before the analysis (Berg et al. 2017). The movements of the forwarders were registered with a GNSS portable receiver (Garmin MAP 62s) located inside the machine cab (Strandgard and Mitchell 2015, Apǎfǎian et al. 2017, Proto et al. 2018). This was configured to record the forwarder position every 3-seconds and was synchronised with the camera. The distance travelled by the forwarders in each activity was calculated as the sum of the distance between the points registered. For the driving while loading, the total distance travelled was measured directly by a GIS (geographic information system) to avoid random deviations accumulated in the GNSS track when the forwarder was stopped or moved at a lower speed.
The number of logs loaded in each cycle was counted from the video recording of the grapple movements during the loading. The load volume or payload (Pl) was estimated with the number of logs loaded and the average assortment log volume (Vi). For each site and assortment, the Vi was calculated from the harvester production report, using the Smalian formula (Apǎfǎian et al. 2017). The log concentration on the strip-road for each assortment (Lconc) was calculated as the quotient between the payload and the distance driven by the forwarder while loading. The log concentration was expressed in m3 (100 m)-1 of strip-road (Nurminen et al. 2006, Manner et al. 2013).
Table 3 Definitions of work elements of forwarding
|
Work element |
Abbreviation |
Definition |
|
Driving empty on the road |
TDER |
Begins when the empty forwarder starts the movement from the roadside landing and ends when the forwarder leaves the road and crosses the stand border |
|
Driving empty into the stand |
TDES |
Begins when the empty forwarder enters the stand and ends when the grapple loader begins to move to load a pile |
|
Loading |
TLOAD |
Begins when the operator starts to move the grapple loader to load a pile and ends when the logs are dropped and loaded into the bunk. This work element includes all loading cycles made by the grapple |
|
Driving while loading |
TDWL |
Begins when the forwarder starts to drive towards a new pile of logs and ends when the grapple loader begins to move |
|
Driving loaded into the stand |
TDLS |
Begins when the loaded forwarder starts to drive towards the road and ends when the forwarder crosses the stand border |
|
Driving loaded on the road |
TDLR |
Begins when the loaded forwarder starts to drive on the road and ends when it reaches the roadside landing |
|
Unloading |
TUNLOAD |
Begins when the loaded forwarder reaches the roadside landing and ends when all logs have been unloaded in a pile or over a truck |
|
Study durations |
days |
17 |
|
Time recorded |
hours |
116 |
|
Number of loads |
loads |
136 |
2.3 Data Analysis
The statistical analysis was oriented to the development of a single predictive model for the total effective time consumption of the forwarding cycle. This model combines the estimations of different sub models for each work element that conform to the forwarding cycle (Table 3) (Nurminen et al. 2006, Stankić et al. 2012). The four driving phases were analysed assuming that driving speed was constant throughout each activity (Stankić et al. 2012). Thus, an average speed was calculated for each work element (Manner et al. 2016a). Time consumptions will be estimated by the quotient between the distances travelled and the driving speed (Niemistö et al. 2012, Stankić et al. 2012).
For other work elements, linear mixed models were fitted. In these models, the time consumption (min cycle-1) was explained by some independent variables, namely the payload, the average log volume, and the log concentration of the forwarded assortment. The site was included as a random factor, the combined effect of machine and operator. This helped to explain the nested structure of the data (Niemistö et al. 2012). These models were fitted with the method of maximum likelihood (ML), using the function »lme« of R (Bates et al. 2015). Only the significative predictor factors (p<0.05) were retained in the models. The marginal R2 (based on the fixed effects only) and the conditional R2 (based on fixed and random effects) were calculated with the package »piercewiseSEM« for structural equations (Lefcheck 2016). The time consumptions were logarithmically transformed to meet homoscedasticity and normality requirements of linear mixed models.
The total effective time consumption (TET) of the forwarding cycle was estimated summing the time consumption predictions for each work element (Eq. 1). An antilogarithmic transformation was applied to the estimations of the models. The effective productivity (PEF) was estimated as the quotient between the payload and the total effective time consumption (Nurminen et al. 2006). To assess the accuracy and lack of bias of the final model for the TET and PEF, predictions were contrasted against the real values, and the results were presented on a validation chart.
(1)
Where:
TET total effective time consumption, min cycle-1
Dor distance driving on the road, m
Fd forwarding distance into the stand, m
derspeed speed forwarding empty on the road, m min-1
desspeed speed forwarding empty in the stand, m min-1
dlsspeed speed forwarding loaded in the stand, m min-1
dlrspeed speed forwarding loaded on the road, m min-1
TLOAD time consumption for loading, min cycle-1
TDWL time consumption driving while loading, min cycle-1
TUNLOAD time consumption for unloading, min cycle-1
e Napier’s constant (e≈2.71828)
ln(...) natural Logarithm
3. Results
Time studies covered a total of 116.1 h, with 70 h of effective activities and 29.6 h of delays or unproductive activities, resulting in an average efficiency of 70%. Of this, 25.6 h of effective activities were recorded for the heavy forwarder (Site 1), 8.9 h for the medium forwarder (Site 2) and 35.5 h for the light forwarders (Sites 3, 4 and 5). Delays and unproductive activities represented 12.6 h for the heavy forwarder, 6 h for the medium forwarder and 11 h for the light forwarders, comprising short rest stops, interaction with drivers and supervisors, displacements between harvest zones, refuel, etc. Other downtimes, like lunchtime or stops due to lack of harvested logs, were not considered in the time study. Within this time, the forwarders completed a total of 136 forwarding cycles and extracted a total volume of 1684 m³. Of this volume, 83.5% were sawlogs. Table 4 presents the average time consumption for each work element, classified by forwarder size.
Table 4 Time study summary for different work elements and forwarder size
|
Forwarder size |
Heavy |
Medium |
Light |
||||
|
Mean±SD |
% |
Mean±SD |
% |
Mean±SD |
% |
||
|
Work element time min cycle-1 |
TDER |
1.04±1.09 |
2.7 |
0.57±0.44 |
3.0 |
2.47±1.51 |
7.7 |
|
TDES |
4.26±3.49 |
11.1 |
2.2±1.43 |
11.4 |
1.6±1.34 |
5.0 |
|
|
TDWL |
4.9±2.87 |
12,8 |
1.54±0.8 |
8.0 |
3.4±2.2 |
10.6 |
|
|
TLOAD |
12.95±3.02 |
33.7 |
6.64±1.48 |
34.4 |
12.53±6.74 |
39.1 |
|
|
TDLS |
3.3±2.96 |
8.6 |
2.89±1.88 |
15.0 |
2.17±1.49 |
6.8 |
|
|
TDLR |
1.07±1.07 |
2.8 |
0.59±0.21 |
3.1 |
2.43±1.37 |
7.6 |
|
|
TUNLOAD |
10.9±2.74 |
28.4 |
4.83±1.43 |
25.1 |
7.45±3.41 |
23.2 |
|
|
Total effective time (TET), min cycle-1 |
38.21±8.97 |
– |
19±4.91 |
– |
31.3±9.67 |
– |
|
|
Efficiency, % |
0.67 |
– |
0.60 |
– |
0.76 |
– |
|
|
Effective productivity (PEF), m³ h-1 |
30.49±6.22 |
– |
44.02±10.42 |
– |
17.22±6.7 |
– |
|
|
Payload (Pl), m³ cycle-1 |
19.06±4.43 |
– |
13.59±3.11 |
– |
8.28±2.66 |
– |
|
|
Distance on the road (Dor), m |
85.7±104.0 |
– |
43.1±41.1 |
– |
198.4±154.1 |
– |
|
|
Forwarding distance (Fd), m |
227.3±204.5 |
– |
186.1±137.1 |
– |
104.9±87.8 |
– |
|
|
Assortment |
Lconc m3 (100 m)-1 |
Vi m3 log-1 |
Lconc m3 (100 m)-1 |
Vi m3 log-1 |
Lconc m3 (100 m)-1 |
Vi m3 log-1 |
|
|
Sawlog 2.5 m |
17.68±3.85 |
0.10 |
22±7.05 |
0.11 |
5.08±1.81 |
0.10 |
|
|
Sawlog 3.15 m |
16.65±4.44 |
0.15 |
23.87±5.16 |
0.15 |
7.07±3.82 |
0.12 |
|
|
Sawlog 3.75 m |
– |
– |
– |
– |
10.5±3.91 |
0.13 |
|
|
Pulpwood |
5.95±0.92 |
0.05 |
– |
– |
9.32±5.12 |
0.04 |
|
The average time consumption of driving empty on the road (Tder) was 1.61 minutes, for an average driving distance of 130 m (Table 4). These values changed between situations because of different distances at the roadside landing. The average speed of empty forwarders on the road was 71.6 m min-1, varying between 51.2 and 92.8 m min-1 for the different situations. The average time consumption of driving loaded on the road (Tdlr) was 1.58 min. In this work element, the average speed was 75.7 m min-1, varying between 61.2 and 90 m min-1 for the different situations, but without significant differences depending on forwarder size. Activities related to both types of driving on the road represented together around 10.8% of the total effective time consumption.
2.64 min were required, on average, for driving empty into the stand (Tdes), for a mean forwarding distance of 166 m. Forwarders travelled at an average speed of 56.9 m min-1, varying from 46.4–69.2 between situations, without significant differences depending on the machine size. 2.68 min were required for driving loaded in the stand (Tdls), with an average speed of 52.2 m min-1. This speed did not show significant differences between forwarder sizes and was not correlated with the payload. The empty and loaded driving in the stand represented together 16.6% of the total effective time consumption.
During loading, the grapple loader movements represented an average of 11.3 min for each cycle. This was the main activity, taking on average 35.4% of the TET and varying from 25–41% between situations. In relation to the volume of timber loaded, the loading took an average of 0.91 minutes per cubic meter, varying from 0.5–1.8 min m-3 between situations. The time consumption for loading increased by 96% when the payload went from 7 to 14 m³. This was decreased when Vi increased, reaching a minimum value for the largest logs loaded (0.17 m³). In this sense, the Vi of sawlogs exceeded 0.1 m³, while the pulpwood logs reached a maximum of 0.05 m³ (Table 4). In the model fitted for this work element, the time consumption for loading explained 56% of the variability . This was logarithmized to correct the lack of normality of the residuals. Also, the random effect of the site explained 0.42 min of the intercept variability, increasing the explanation level of the model to 97% (Table 5 – Model 1). The time consumption for loading was explained by the log size and the payload. A minor part of the variability was explained by site-specific conditions (forwarder characteristics, operator skills) (Fig. 2a).
Driving while loading (Tdwl) required an average of 3.45 min per cycle, representing 10.8% of the total effective time. This activity took a mean of 0.28 min m-3, varying from 0.11–0.71 min m-3 for the different situations. The forwarders travelled a mean of 117.8 m to complete load formation. However, this distance was different for each situation and assortment forwarded, in relation to the log concentration of each stand. In the thinnings studied, sawlog assortments had the highest log concentration, varying from 5.1–23.8 m3 (100 m)-1. Pulpwood had a minor log concentration (Table 4). The Tdwl decreased when the log concentration of the forwarded assortment was higher. However, this relationship was not linear and the Tdwl increased rapidly under 5 m3 (100 m)-1 (Fig. 2b). The fitted model (Table 5 – Model 2) explained 50% of the time consumption variability, considering only the fixed effects of the distance driving while loading as the quotient between the payload and the log concentration of the forwarded assortment. In addition, the random effect of the site explained 0.25 min of the variability in the intercept of the model, raising the explanation of the model to 67%.
The average time consumption for unloading was 8.4 min, being 26.4% of the total effective time. This activity included both the unloading to the roadside landing and the unloading into a truck. This activity took a mean of 0.68 min/m³. The fitted model explained 49% of the unloading time consumption variability (Table 5 – Model 3). The unloading time was linked with the load volume and inversely related to the log volume. The explanation rate of the model rose to 91% when the random effect of the site was included. The random effect of the site explained a deviation of 0.29 min in the model intercept.

Fig. 2 Variation in time consumption and effective productivity for different forwarder sizes, log size, log concentration and forwarding distance
Table 5 Time consumption mixed models for loading, driving while loading and unloading work elements. The standard error of the parameter estimate is presented in parenthesis
|
Model parameter |
Model 1 |
Model 2 |
Model 3 |
|
Dependent variable |
ln(TLOAD) |
Ln(TDWL) |
Ln(TUNLOAD) |
|
Fixed |
– |
– |
– |
|
Intercept |
–1.4260 (0.2597) |
–2.5239 (0.3962) |
0.7263 (0.1778) |
|
ln(Pl) |
0.9726 (0.0504) |
– |
0.6240 (0.0590) |
|
Vi |
– |
– |
–3.5094 (0.6203) |
|
ln(Vi) |
–0.5955 (0.0392) |
– |
– |
|
ln(Pl/(Lconc/100)) |
– |
0.7698 (0.0816) |
– |
|
Random effects |
– |
– |
– |
|
Situation effect, SD |
0.4173 |
0.2529 |
0.2927 |
|
Residual, SD |
0.1161 |
0.3501 |
0.1392 |
|
Random intercept |
– |
– |
– |
|
Site 1 |
–1.7761 |
–2.3909 |
0.8728 |
|
Site 2 |
–1.9096 |
–2.8235 |
0.3568 |
|
Site 3 |
–0.972 |
–2.5419 |
1.1771 |
|
Site 4 |
–1.5749 |
–2.7123 |
0.4846 |
|
Site 5 |
–0.8975 |
–2.1511 |
0.7402 |
|
R²M |
0.56 |
0.50 |
0.49 |
|
R²C |
0.97 |
0.67 |
0.91 |
|
AIC |
–54.69 |
198.16 |
18.39 |
|
BIC |
–28.61 |
221.34 |
44.20 |
|
n |
134 |
134 |
130 |
The forwarding cycle had an average total effective time consumption of 30.9 min, varying from 19.1–37.4 min between situations (Fig. 2c). This represented a mean of 2.5 min m-3 of forwarded timber. TTE can be estimated by Eq. 1, combining the time consumption estimations of each work element. Eq 2. presents the general TTE model of fixed effects. When the intercept of each sub-model included the random effect of the site (Table 5), the predictions obtained were not biased and reached an explanation level of 79% (Fig. 3).
(2)
The effective productivity was a mean of 27.8 m3 h-1, varying between 15-44 m3 h-1 for the different situations. This depended on the payload and the total effective time consumption during the forwarding cycle. When the payload changed from 7 m3 (light forwarder) to 14 m3 (medium forwarder), the productivity increased by 40%. However, when the log size increased between 0.04-0.13 m3 (forwarding pulpwood and sawlogs, respectively), productivity increased by 44%. Log concentration had a minor effect: a change in the log concentration from 5–10 m3 (100 m)-1 was associated with a productivity increase of 8.4% for sawlogs and 5.9% for pulpwood. This was because the increase in the log concentration caused a reduction of 41% in the TDWL. Effective productivity can be estimated as the quotient between payload and TTE (Proto et al. 2018). The estimations obtained in this way - when including the random effect of the site - was not biased and explained the 90% of the observed variability (Fig. 3).
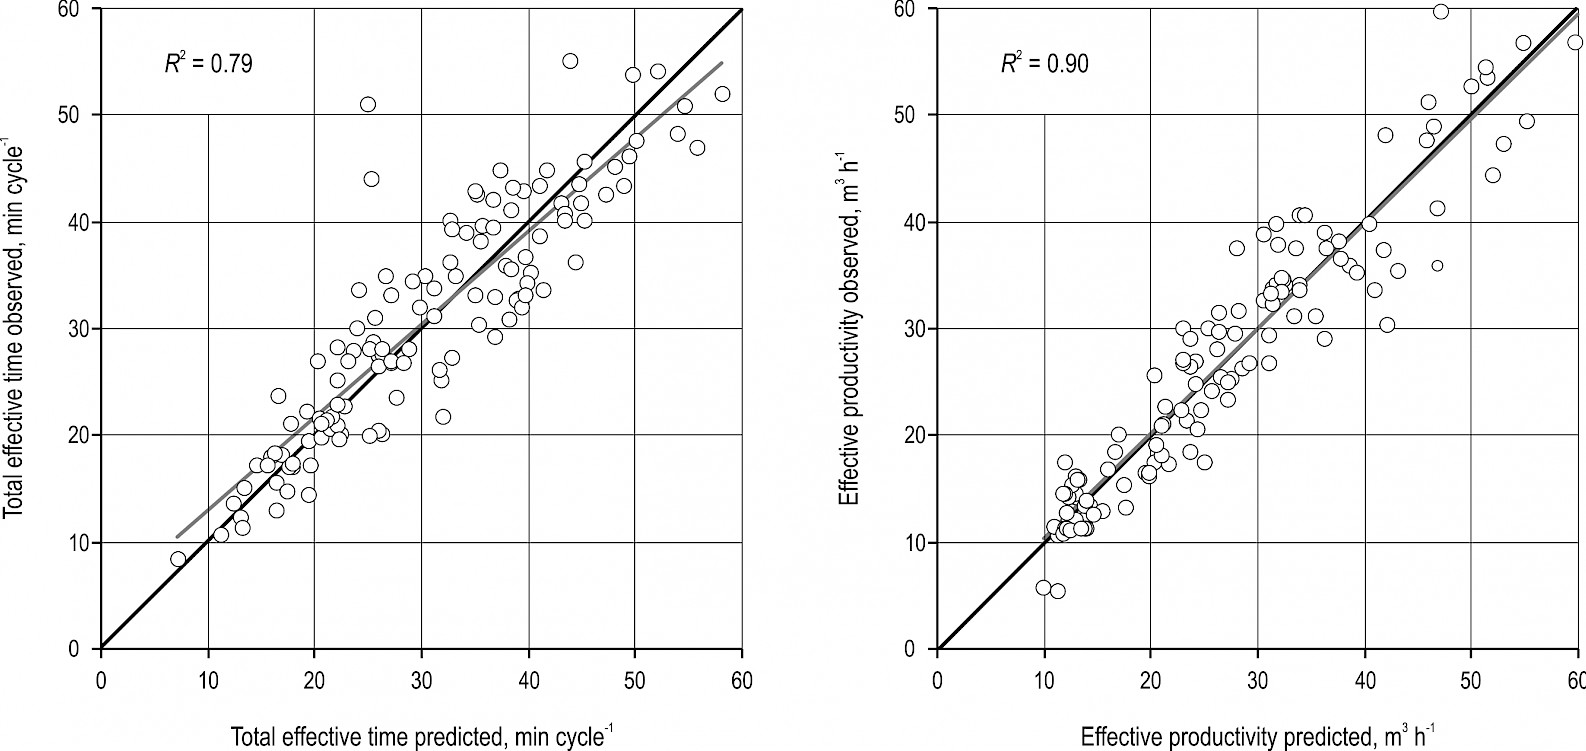
Fig. 3 Comparison between total effective time consumption and effective productivity (values observed and predicted). The predictions included the random effect of the site over the intercept in each individual work element model
4. Discussion
The study was conducted in five thinning operations, with a set of forwarders representing mechanized thinnings carried out in the north-east of Argentina. The results have shown that the effect of the factors studied was consistent in different situations. The video recording and GNSS tracking of the operations have proven to be an efficient technique, making it possible to provide safe and effective fieldwork while obtaining great precision in the determination of the duration of activities and distances travelled. This methodology was useful to determine the time consumption of the effective activities that conform to the forwarding cycle. However, the design and extension of the study were not intended to capture and analyse the broad set of delays and unproductive activities that occur during the forwarding (Berg et al. 2017).
Forwarder speed on the road was similar when the forwarder was empty and loaded. The lack of correlation between the speed and the load volume for the loaded travel showed that the weight of the load was not limiting under the conditions of this study. Forwarder speed driving in the stand was also similar for empty and loaded movements, and 26% lower than the speed on the forest road. This was not correlated with the load volume (Proto et al. 2018). Similar speed of empty and loaded travel could be due to a good soil bearing capacity, and a soft relief with low slope and with no rocks that would make difficult the movement of any forwarder size (Stankić et al. 2012).
The time consumption of the crane work during the loading represented a smaller proportion of the cycle than found by Manner et al. (2013). The loading time for a mean log volume of 0.1 m3 (0.86 min m-3) was similar to that shown by Apǎfǎian et al. (2017) with logs of 0.075 m3 in clearcutting. Moreover, heavy forwarders needed 9.4% less time than reported by Manner et al. (2016a) for heavy forwarders in an extensive study conducted in Sweden. The relation between the time consumption of loading and the volume of logs followed the »Piece-Size Law«, according to which the crane time increases proportionally to the number of logs loaded and inversely proportional to the piece size of these logs (Stankić et al. 2012, Holzfeind et al. 2018). In this sense, time consumption of a medium forwarder (14 m3) loading 2.5 m sawlogs (Vi=0.11 m3) was 20% higher than when loading 3.15 m sawlogs (Vi=0.15 m3). In the same way, the loading of pulpwood (Vi=0.05 m3) required 92% more time, similarly as 0.15 m3 sawlogs (Fig. 2a). Extraction of a single assortment in each cycle allowed these differences to be observed. In this study, the effect of the pile size on the loading time has not been considered. Although no significant effect of the log concentration on the time consumption of loading has been observed, this factor may condition the size of the piles formed by the harvester (Väätäinen et al. 2006). The study of the effect of the thinning intensity and the way of the harvester work on forwarding productivity must be further researched in the future.
The time consumption for driving while loading was 48% lower than that reported by Manner et al. (2016a) and 18% higher than shown by Apǎfǎian et al. (2017). This was related to the distance driven while loading, estimated by the quotient between the load volume and the log concentration in 100 m of strip road (Nurminen et al. 2006, Manner et al. 2013). This time increased exponentially when log concentrations decreased below 10 m3 (100 m)-1 (Fig. 2b) (Stankić et al. 2012, Manner et al. 2013). For this work element, the effect of log concentration was increased by loading only one assortment in the same load (Manner et al. 2013). In this study, decreasing the log concentration from 15 m3 (100 m)-1 to 10 m3 (100 m)-1 increased the driving time by 36.6%. Further, when the log concentration was 5 m3 (100 m)-1, the increase of driving time was 133%, highlighting the effect of lower log concentrations (Fig. 2b).
Unloading was affected by the same factors as loading but needed, on average, 35% less time for sawlogs, and 52% less time for pulpwood. This was because, when unloading, the operator was not limited by the availability of logs in the forwarder load and was able to get a full grapple load easily in each crane cycle. Moreover, as only one assortment was forwarded, there was no need to classify the logs (Stankić et al. 2012). The unloading time was around 25% lower than shown by Apǎfǎian et al. (2017) and Proto et al. (2018). The time proportion of these work elements (26.4%) followed the general proportion for other forwarding operations (Manner et al. 2013). The fitted model explained 49% of the time consumption variability for all situations. Other studies reached higher levels of explanation, but usually for individual situations (Proto et al. 2018, Holzfeind et al. 2018). In other cases, only a mean unloading time for each assortment was calculated (Niemistö et al. 2012, Nurminen et al. 2006).
The total effective time consumption was determined by the time consumption of each work element (Table 4). For the same forwarder size, this was similar as obtained by Apǎfǎian et al. (2017), who worked in a final harvest in Norway, with a harvested volume and mean stem size similar as in these thinning situations. The TTE increased when the distance driving on the road and the forwarding distance increased. However, as empty and loaded driving represented just 27.4% of the cycle, the effective productivity only decreased by 12% when the forwarding distance was doubled from 100 to 200 m. Eriksson and Lindroos (2014) saw a similar effect in an extensive productivity study in thinning.
The forwarder size was not significantly correlated with the speed reached in the empty and loaded travel. However, this factor largely determines the average payload reached in each situation, affecting loading and unloading and varying the relative weight of other work elements. In this sense, an increase of 100 m in the forwarding distance affects more a forwarder loaded with 8 m3 (15% less productivity) than a forwarder loaded with 19 m3 (10% less productivity). Moreover, medium and heavy forwarders allow reaching productivities greater than 20 m3 h-1 at forwarding distances of 450 m (Fig. 2d). Instead, a light forwarder falls below this productivity when the forwarding distance reaches 200 m. In the region, this productivity is considering a threshold below which the extraction is not cost-effective, also limiting the potential productivity of the harvester (Mac Donagh et al. 2017).
On the other hand, log size had a greater effect on productivity, regardless of log concentration. For a change between the pulpwood log size (0.05 m3) and 2.5 m sawlog (0.11 m3), the productivity increased by 27%. Also, this variation reached 40% for 3.15 m sawlog (0.15 m3). For light forwarders, the extraction of pulpwood limits productivity under 20 m3 h-1. The effect of log size on loading and unloading is considerable, together accounting for 62% of the cycle time.
The effect of log concentration on productivity was limited by the relatively minor importance of the driving while loading element (10.8% of the cycle time). For a mean load volume of 14 m3, a variation in the log concentration of 5 m3 (100 m)-1 to 10 m3 (100 m)-1 only caused a reduction of 7% in cycle duration and an increase of 8% in productivity. This variation was in concordance with the results of Manner et al. (2013), who found that the cycle duration increased exponentially only for log concentrations lower than 5 m3 (100 m)-1.
5. Conclusions
This research was conducted to analyse the factors that affected different work elements of forwarding operations. This study focuses on a group of forwarders of different sizes working in pine thinning operations in the northeast of Argentina to produce general time consumption and productivity models.
The models fitted proved that log size and log concentration affected in the same way all forwarders studied. The main differences in the volume of timber loaded for each forwarder was explained by the payload factor. The incorporation of the site random effect allowed the analysis of each factor, independently of the absolute differences between situations. The general TTE and PEF model obtained reflected the incidence of changes in the main factors that affect thinning operations.
The log size of each forwarded assortment was the most crucial factor analysed and together with log concentration affected the loading and unloading. These highlight the need to study better how the bucking instruction and decisions made by the harvester operator affect the time consumption and productivity of the forwarder operation. In a forest with a certain stem size, the bucking instruction applied can condition the cost of forwarding and the result of thinning.
In this sense, the models developed will allow to perform simulations that are sensitive not only to the forwarding distance, but also to the payload, log size and log concentration. This can be used to support accurate decisions of thinning intensity and bucking instructions applicable to different situations. Therefore, the general model must be combined with a bucking simulation system to estimate the log size and log concentration of each assortment forwarded.
Acknowledgements
This study was developed and financed as part of the Project PIA BID 2853/OC-AR Nº 14062 and the Project ANR 3500/16 129, a student grant from CONICET, and in collaboration with the companies Forestal Bosques del Plata S.A, Selva S.R.L and Pindó S.A. The authors would like to thank Prof. Mónica Fortmann and Prof Giménez Rocio, for their assistance in editing the English text.
6. References
Apăfăian, A.I., Proto, A.R., Borz, S.A., 2017: Performance of a mid-sized harvester-forwarder system in integrated harvesting of sawmill, pulpwood and firewood. Ann. For. Res. 60(2): 227–241. https://doi.org/10.15287/afr.2017.909
Bates, D., Mächler, M., Bolker, B., Walker, S., 2015: Fitting Linear Mixed-Effects Models Using lme4. J. Stat. Softw. 67: 1–48. https://doi.org/10.18637/jss.v067.i01
Berg, S., Yoshida, M., Sakurai, R., Sakai, H., 2017: Comparison of productivity and cost depending on slope when forwarding short length logs with small Japanese forwarders. Int J For Eng 28(3): 176–185. https://doi.org/10.1080/14942119.2017.1358550
Eriksson, M., Lindroos, O., 2014: Productivity of harvesters and forwarders in CTL operations in northern Sweden based on large follow-up datasets. Int. J. For. Eng. 25(3): 179–200. https://doi.org/10.1080/14942119.2014.974309
Ghaffarian, M.R., Stampfer, K., Sessions, J., 2007: Forwarding productivity in Southern Austria. Croat. j. for. eng. 28(2): 169–175.
Hildt, E., Leszczuk, A., Schlichter, T., Mac Donagh, P.M., 2019: Efecto de la densidad de las forestaciones y la intensidad de cosecha en raleos mecanizados con harvester. Sci. For. 47: 1–11. https://doi.org/10.18671/scifor.v47n123.06
Holzfeind, T., Stampfer, K., Holzleitner, F., 2018: Productivity, setup time and costs of a winch-assisted forwarder. J. Forest Res.-Jpn. 23(4): 196–203. https://doi.org/10.1080/13416979.2018.1483131
Lefcheck, J.S., 2016: PiecewiseSEM: Piecewise structural equation modeling in R for ecology, evolution, and systematics. Methods. Ecol. Evol. 7(5): 573–579. https://doi.org/10.1111/2041-210X.12512
Lindroos, O., Wästerlund, I., 2014: Theoretical Potentials of Forwarder Trailers with and without Axle Load Restrictions. Croat. J. For. Eng. 35(2): 211–219.
Mac Donagh, P., Botta, G., Schlichter, T., Cubbage, F., 2017: Harvesting contractor production and costs in forest plantations of Argentina, Brazil, and Uruguay. Int. J. For. Eng. 28(3): 157–168. https://doi.org/10.1080/14942119.2017.1360657
Manner, J., Palmroth, L., Nordfjell, T., Lindroos, O., 2016a: Load level forwarding work element analysis based on automatic follow-up data. Silva Fennica 50(3): 1–19. https://doi.org/10.14214/sf.1546
Manner, J., Nordfjell, T., Lindroos, O., 2016b: Automatic load level follow-up of forwarders’ fuel and time consumption. Int J For Eng 27(3): 151–160. https://doi.org/10.1080/14942119.2016.1231484
Manner, J., Nordfjell, T., Lindroos, O., 2013: Effects of the number of assortments and log concentration on time consumption for forwarding. Silva Fennica 47(4): 1–19. https://doi.org/10.14214/sf.1030
Niemistö, P., Korpunen, H., Laurén, A., Salomäki, M., Uusitalo, J., 2012: Impact and productivity of harvesting while retaining young understorey spruces in final cutting of downy birch (Betula pubescens). Silva Fennica 46: 81–97. https://doi.org/10.14214/sf.67
Nurminen, T., Korpunen, H., Uusitalo, J., 2006: Time consumption analysis of the mechanized cut-to-length harvesting system. Silva Fennica 40(2): 335–363. https://doi.org/10.14214/sf.346
Proto, A.R., Macrì, G., Visser, R., Harrill, H., Russo, D., Zimbalatti, G., 2018: A Case Study on the Productivity of Forwarder Extraction in Small-Scale Southern Italian Forests. Small-scale Forestry 17(1): 71–87. https://doi.org/10.1007/s11842-017-9376-z
Stankić, I., Poršinsky, T., Tomašić, Ž., Tonković, I., Frntić, M., 2012: Productivity Models for Operational Planning of Timber Forwarding in Croatia. Croat. J. For. Eng. 33(1): 61–78.
Strandgard, M., Mitchell, R., Mauricio, A., 2017: Time consumption and productivity of a forwarder operating on a slope in a cut-to-length harvest system in a Pinus radiata D. Don pine plantation. J. For. Sci. 63(7): 324–330. https://doi.org/10.17221/10/2017-JFS
Strandgard, M., Mitchell, R., 2015: Automated Time Study of Forwarders using GPS and a vibration sensor. Croat. J. For. Eng. 36(2): 175–184.
Väätäinen, K., Ala-Fossi, A., Nuutinen, Y., Röser, D., 2006: The Effect of Single Grip Harvester’s Log Bunching on Forwarder Efficiency. Baltic Forestry 12(1): 64–69.
© 2019 by the authors. Submitted for possible open access publication under the
terms and conditions of the Creative Commons Attribution (CC BY) license (http://creativecommons.org/licenses/by/4.0/).
Authors’ addresses:
Prof. Eduardo Hildt, Eng. *
e-mail: eduardohildt@gmail.com
Est. Andrés Leszczuk, Eng.
e-mail: leszczukandresalejandro@gmail.com
Prof. Patricio Miguel Mac Donagh, Sc.D.
e-mail: patricio.macdonagh@gmail.com
National University of Misiones/CONICET
Forestry Faculty
Forest Harvesting Chair
Bertonni 124
3380 Eldorado, Misiones
ARGENTINA
Prof. Tomás Miguel Schlichter, Sc.D.
e-mail: tomasschlichter@gmail.com
University of Buenos Aires (UBA)
School of Agriculture
Chair of Forestry
San Martin 4453
C1417DSE Buenos Aires Autonomous City
ARGENTINA
* Corresponding author
Received: December 22, 2018
Accepted: September 19, 2019
Original scientific paper