
Actual and Mathematical Bucking: Evaluation of Mechanized Hardwood Cut-To-Length Operations
doi: https://doi.org/10.5552/crojfe.2026.4475
volume: issue, issue:
pp: 23
- Author(s):
-
- Bennemann Caroline
- Labelle Eric R.
- Lussier Jean-Martin
- Havreljuk Filip
- Borchert Herbert
- Article category:
- Original scientific paper
- Keywords:
- optimization, product recovery, value recovery, sawlog maximization, BuckR
Abstract
HTML
Fully mechanized hardwood operations usually rely on manual bucking, which may decrease potential volume and value recovery as compared to automatic bucking. This study aimed at evaluating bucking done in cut-to-length (CTL) operations, hypothesizing a possible increase of value recovery by using a bucking optimizer. Evaluation of bucking was done by a comparison of actual bucking with a mathematical solution – BuckR – a bucking optimizer based on dynamic programming. Results showed that the mathematical approach significantly outperformed manual bucking when quality was not considered, and only main stem products were included. Throughout 315 study trees (Acer saccharum, Acer rubrum, and Betula alleghaniensis) located in the Acadian forests of Eastern Canada, a mean increase of 112% in value and 84% in volume recovery per tree was reached through mathematical optimization. Contributions of mathematical bucking can be summarized by 1) a significantly higher number of sawlogs and a greater mean log length of sawlogs and pulp logs, 2) a two-fold increase in processed height, and 3) a considerable reduction in minimal diameters as compared to actual bucking. Those results illustrate the possibility to increase value and volume recovery in mechanized CTL operations and therefore to utilize the wooden resource more efficiently.
Actual and Mathematical Bucking: Evaluation of Mechanized Hardwood Cut-To-Length Operations
Caroline Bennemann, Eric R. Labelle, Jean-Martin Lussier, Filip Havreljuk, Herbert Borchert
https://doi.org/10.5552/crojfe.2026.4475
Abstract
Fully mechanized hardwood operations usually rely on manual bucking, which may decrease potential volume and value recovery as compared to automatic bucking. This study aimed at evaluating bucking done in cut-to-length (CTL) operations, hypothesizing a possible increase of value recovery by using a bucking optimizer. Evaluation of bucking was done by a comparison of actual bucking with a mathematical solution – BuckR – a bucking optimizer based on dynamic programming. Results showed that the mathematical approach significantly outperformed manual bucking when quality was not considered, and only main stem products were included. Throughout 315 study trees (Acer saccharum, Acer rubrum, and Betula alleghaniensis) located in the Acadian forests of Eastern Canada, a mean increase of 112% in value and 84% in volume recovery per tree was reached through mathematical optimization. Contributions of mathematical bucking can be summarized by 1) a significantly higher number of sawlogs and a greater mean log length of sawlogs and pulp logs, 2) a two-fold increase in processed height, and 3) a considerable reduction in minimal diameters as compared to actual bucking. Those results illustrate the possibility to increase value and volume recovery in mechanized CTL operations and therefore to utilize the wooden resource more efficiently.
Keywords: optimization, product recovery, value recovery, sawlog maximization, BuckR
1. Introduction
In 2020, Canada was the fourth-largest sawlog producer in the world and exported 40.2 million m³ (67% of its production) (FAO 2022). Even though hardwood stands and mixed forest stands represent a minority of Canadian forests with 12% and 14% of the forest cover, respectively (NRCan 2022), these hardwood-dominated areas play an essential role in the supply chain. This is especially true for high-value appearance products such as cabinet, veneer, or furniture, as well as lower value products including pulp, paper, and viscose staple fibre (Wiedenbeck and Smith 2018).
From all decisions taken during harvest and supply operations, bucking, thus the task of cross-cutting stems into logs of varying assortments, is considered the tactical decision with the highest impact on value creation (Faaland and Briggs 1984, Lembersky and Chi 1986, Kärhä et al. 2017). Bucking decisions must consider tree, market, and transportation variables to maximize value recovery. At the tree level, bucking decisions must consider species, dimensions, and quality (Wang et al. 2004) as well as market specifications for log size for each mill destination (Faaland and Briggs 1984).
Poor bucking can lead to waste and misutilization of wood and fibre, which in turn translates into inefficiency and loss of value for both the forest owner and the rest of the value chain. Factors such as complex product specifications, lack of incentives in a context of payment by productivity, insufficient training of the operators or incorrect bucking strategies can restrain value recovery from bucking (Twaddle and Goulding 1989, Pickens et al. 2006).
Evaluation of bucking and research on bucking optimization have been conducted since the 1960s to explore ways to improve the value of bucking (Kivinen 2004). Methods have been developed both at tree-level (for instance Faaland and Briggs 1984) and stand-level (as done by Sessions et al. 1989, Laroze 1994) by using different mathematical approaches such as linear programming, dynamic programming, network analysis, shortest path algorithms or heuristic approaches (Laroze and Greber 1997).
Gains from optimized bucking are documented in many case studies: In softwood operations, the mathematical optimization of bucking provided an increase in value ranging from 1% to 26% (Twaddle and Goulding 1989, Boston and Murphy 2003, Corneau and Fournier 2005, Akay 2017, Labelle and Huß 2018). In hardwoods, increase in value recovery is generally higher, ranging from 14% to 55 % in operations conducted either motormanually or mechanically in a log yard (Pickens et al. 1992, 2006, Wang et al. 2004, 2009). The most notable results are from the industrial application of bucking optimization performed in the 1980s, which tripled the revenues of softwood operations from a large forest company (Lembersky and Chi 1986). A recent study investigated the inclusion of LiDAR data into bucking optimization in pine stands and highlighted the potential of the use of such data for bucking optimization (Prendes et al. 2023). Studies exploring shortwood systems in hardwoods could not be found.
Nowadays, 75% of harvesting operations in Eastern Canada are done using harvesters in cut-to-length (CTL) method (Lundbäck et al. 2021), including an increasing share of hardwood operations. The use of harvesters is more common in softwoods but is also increasing in hardwoods. Harvesters, initially developed to reduce costs of forest operations and replace costly workforce (Silversides 1984), lead to a significant increase of productivity (Skogforsk 2008) as well as work safety and health (Gellerstedt and Dahlin 1999). Scarce workforce is the main reason for the recent transition to this harvesting system for hardwoods in Eastern Canada. Even though harvesting using the CTL method requires fewer operators, those need to have several months of training in order to reach satisfactory productivity (Purfürst 2010, Purfürst and Erler 2011, Pagnussat et al. 2021). This duration of training is particularly crucial, as labour shortage tends to facilitate turnover of employees and may lead to fewer trained harvesting operators.
When developing current harvesters, the focus laid on softwoods. Therefore, current bucking algorithms implemented by machine manufacturers are not adapted to hardwoods. In comparison with softwoods, bucking of hardwoods is more challenging due to the diverse and complex list of log specifications, the inclusion of quality factors, and often high differences in value between high- and low-quality grades. Bucking of hardwoods is further complicated due to the fact that trees have a more complex architecture, including large branches which may be merchandized and forks with limited commercial usage. Up to recently, bucking in hardwoods was done either at the roadside, in a sorting yard or at the mill by a slasher with a specialized operator, on trees harvested using feller-bunchers, with delimbing done either at the stump or at the roadside. Hardwood bucking relies on the visual assessment of the tree from the operator’s cabin and thereby does not allow a full representation of the bole. The need of visual identification of stem defects by harvester operators to choose bucking pattern requires particularly experienced and well-trained operators. This additional need of judgment can lead to higher mental workload for operators as well as to fluctuations of bucking results, depending on daily form of the operator (Spinelli et al. 2020).
A potential solution would integrate defect-detection sensors into the harvesting head, allowing real-time optimization of bucking decisions. However, such technology is not yet commercially available. An alternative could be to limit CTL processing to producing long logs for subsequent bucking at the landing using advanced slashers equipped with defect-detection systems. This approach, however, may introduce logistical challenges in handling and transporting longer logs.
In the meantime, this study investigates whether the automatic bucking algorithms currently embedded in harvesters – designed primarily for softwoods – can be effectively used for hardwood CTL operations. Specifically, it evaluates whether bucking based solely on dimensional criteria (log length and diameter), followed by quality sorting at the landing, could improve value recovery compared to traditional operator-based bucking. We hypothesize that mathematical bucking optimization, even without defect detection, can outperform manual bucking in hardwood CTL harvesting by improving the allocation of logs based on price lists that only consider dimensions.
2. Materials and Methods
2.1 Study Area and Operational Considerations
Study sites were located in the Acadian forests of New Brunswick, Canada (Fig. 1). In the province, forests occupy 83% of the land (NBDNRED n.d.), and present a high diversity of commercial tree species, climate, and geology (Loo and Ives 2003). Common hardwood species can be divided into those with a high value, such as sugar maple (Acer saccharum Marsh.) and yellow birch (Betula alleghaniensis Britt.), and those with a moderate value such as red maple (Acer rubrum L.), white birch (Betula papyrifera Marsh.). Beeches (Fagus grandifolia Ehrh.) in Acadian forests are often affected by the beech bark disease (Taylor et al. 2013) and do not generally generate roundwood. Plots included in this study were located either on public (Crown) or on private land found in ecoregion 2 (Northern Uplands), ecoregion 3 (Central Uplands), and ecoregion 5 (Valley Lowlands) with altitudes ranging from 206 m to 476 m above sea level. Pieces of information related to specific silvicultural treatments, past land-use or possible calamities, which occurred in the plots are not known. Harvesting of the study sites was done with fully mechanized operations, using harvesters in CTL operations. Study trees were marked during pre-harvest inventory, and operations were conducted between August and March following a two shift per day approach, with data collected between 2018 and 2022.
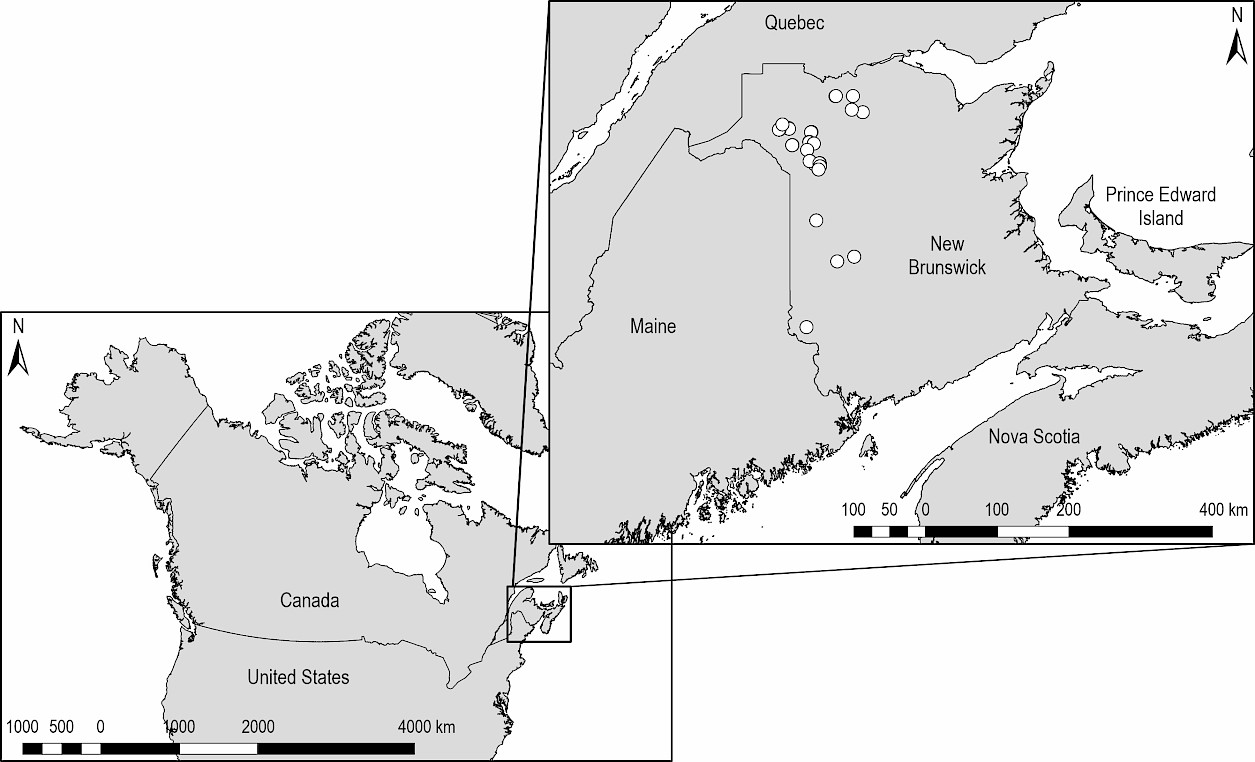
Fig. 1 Localization of study sites in the province of New Brunswick, Canada
2.2 Data Collection
Datasets provided by the Northern Hardwoods Research Institute (NHRI) and the New Brunswick Department of Natural Resources and Energy Development (NBDNRED) were collected between 2018 and 2022 (Table 1). A total of 160 variable radius plots, using a prism with a basal area factor of 2 m2/ha, were randomly established in seven hardwood-dominated harvesting blocks. A total of nine plots were setup per hectare and three study trees were selected per plot (Hennigar et al. 2018, Pelletier 2020). Before harvesting, these study trees were inventoried and species, DBH, height, as well as form and risk classes were assessed. The form and risk classification of New Brunswick refers to an assessment of a tree physical characteristics (multiple trees, forks and curvature, and inclination) as well as its vigor (risk of losing value) (Pelletier et al. 2020). During harvesting, operators were instructed to operate on a business-as-usual approach. After harvesting, log dimensions (bottom and top diameters and length), as well as their origin (main stem or branches), their order in the tree (sequence of numbers starting at one for the butt log), and the height of the stump were tallied.
Table 1 Overview of datasets (DB1 to DB4) included in this study
|
Database |
Number of plots |
Number of trees |
Number of products in the main stem |
Years of data collection |
|
DB1 |
35 |
103 |
337 |
2018–2019 |
|
DB2 |
74 |
116 |
375 |
2020–2021 |
|
DB3 |
26 |
39 |
132 |
2020–2022 |
|
DB4 |
25 |
57 |
203 |
2020–2022 |
2.3 Data Processing and Analysis
Data was processed and analyzed using R (Core Team 2023) with R Studio version 4.4.3 (2025-02-28). Due to the scope of the study, only hardwoods (red maple (RM), sugar maple (SM) and yellow birch (YB)) were considered.
During harvesting operations, products were bucked in the main stem as well as in the branches whenever possible. However, as the exact position of branches in the trees was not known for all trees, only products in the main stem were considered. The use of the New Brunswick form and risk classification did not allow to evaluate quality aspects of stems greater than 5 m in height; therefore, it was decided to focus only on dimensional aspects of stems. Thus, study trees were handled similarly as softwood or during mechanized CTL operations. In total, 315 trees bearing 1047 products in the main stem were included in this study (Table 2). Those trees originated from seven harvesting blocks.
Table 2 Number of trees and products in the main stem depending on tree species
|
Abbreviation |
Number of trees |
Number of products in the main stem |
|
|
Red maple |
RM |
31 |
104 |
|
Sugar maple |
SM |
209 |
708 |
|
Yellow birch |
YB |
75 |
235 |
|
Total |
tot |
315 |
1,047 |
To discriminate between datasets and improve the quality of analysis, ANOVAs were performed to identify potential grouping of variables, thus leading to an analysis depending on harvesting block and not depending on database. Assumptions of ANOVA were tested and a significance level was set at p<0.05.
2.4 Product Specifications
Since precise product specifications used during harvesting could not be retraced, two approaches were used to make an informed reconstruction. Approach one consisted of accessing product specifications of wood marketing boards in New Brunswick (SNBFPMB 2022). Then, licensees were contacted to obtain the dates of wood transportation per block and the destination of each logging truck including specifications at the target processing facilities.
For this study, the following values were attributed to different products: 60 value units/m3 for pulp logs and 100 value units/m3 for main sawlogs products. However, in the case where specifications were differentiated between three types of sawlogs (harvesting block G), values of 120 and 150 value units/m3 were included. The choice of values was based on an analysis of relations between prices published by marketing boards in New Brunswick (SNBFPMB 2025).
Product specifications for each harvesting block and each tree species are described in Table A1 of the supplementary material.
2.5 Determination of Mathematical Bucking Solution
Mathematical bucking of the study trees describes the bucking solution that could be reached by using a bucking optimizer. In this study, BuckR, an open-source program based on dynamic bucking, was used (Bennemann et al. 2025). BuckR allows generating a bucking solution for each study tree with a maximization of value recovery. Calculation of all possible logs in each study tree and a valuation of each log allowed to identify the highest value sequence of logs in each stem. Fig. 2 gives an overview of the workflow followed.
The tree diameter profiles of the 315 study trees were used with the Canadian national taper equations proposed by Ung et al. (2013) as input into BuckR. In addition, product specifications with associated prices were also imported into BuckR. Prices were indicated for one cubic metre and applied to the actual volume of each log. Due to the availability of data, only quantitative aspects were used in this study. Therefore, only sawlogs and pulp logs were considered as merchantable products. Volume of logs was determined by using the Smalian formula (Kershaw et al. 2017).
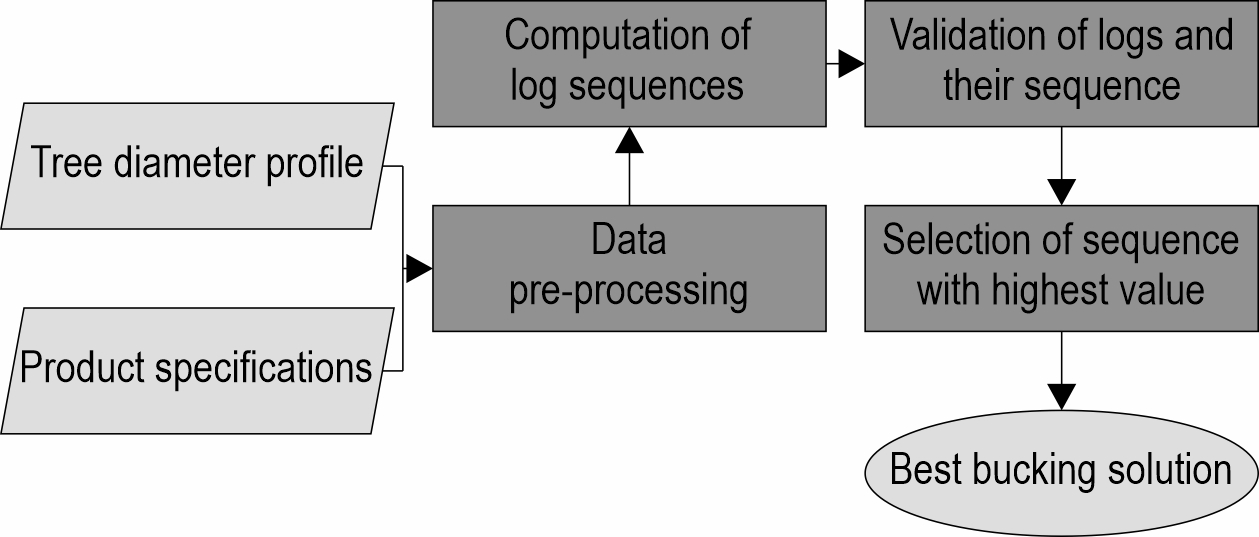
Fig. 2 Workflow of BuckR with two input files required to generate best bucking solution
2.6 Evaluation of Actual Bucking and Comparison with Mathematical Bucking
To evaluate bucking done during harvesting operations, BuckR was modified as part of this project to include post-harvest inventory databases. The classification of logs with BuckR ensures comparability between mathematical and actual bucking. Bottom and top diameter of logs as well as their length were used to classify logs based on product specifications used for the determination of mathematical bucking. A prediction accuracy of 1 was reached; therefore, different tree species were handled separately.
After the classification, all products generated that were shorter than the shortest possible log anticipated within the specifications were labelled as »waste« and given a value of 0. Products not having the exact requested product length were shortened to the next shorter target length, and shortened lengths were identified. The small-end diameter of the shorter log was determined using the taper equation used previously. Volume was calculated for all logs and associated value was determined based on the classification. The merchantable volume and the value generated were summarized per tree.
2.7 Statistical Analysis
Having generated both mathematical and actual bucking using BuckR, a comparison between each bucking scenario was done, considering the performance indicators in Table 3. Beside differences in value and volume generated between both scenarios, the cumulative length of the merchantable logs and the top merchantable diameter were used as indicators of the degree of utilization of trees.
Table 3 Performance indicators used to compare actual and mathematical bucking
|
Indicator |
Units |
|
Difference in value per tree |
Value units/tree |
|
Difference in volume per tree for all logs, sawlog and pulpwood |
m3 |
|
Difference in number of logs per tree for all logs, sawlog and, pulpwood |
logs |
|
Log length for all logs, sawlog and pulpwood |
m |
|
Difference in cumulative merchantable length per tree |
m |
|
Difference in top merchantable diameter per tree |
cm |
For discrete indicators (number of logs), Poisson distribution was assumed. For continuous variables (all indicators except numbers), a Gamma distribution (Thom 1958) with a log link transformation was assumed. This distribution was left skewed and represented indicators in the best way. To meet distribution requirements, an adjustment of values was done, when necessary, transforming values to strictly positive values. Adjustments made for each variable are specified in Table 6.
To understand factors driving differences between several aspects of bucking results, generalized linear models (GLM) were adjusted for each indicator and for each tree species (Table 4). Models including both DBH and height were not tested, as it was assumed that the variables are not independent.
Table 4 Tested models for different indicators
|
Tested models for all indicators |
Tested models for log length |
|
Harvesting block |
Harvesting block |
|
DBH |
DBH |
|
Height |
Height |
|
Scenario |
|
|
Harvesting block + DBH |
Harvesting block + DBH |
|
Harvesting block + DBH + Harvesting block x DBH |
Harvesting block + DBH + Harvesting block x DBH |
|
Harvesting block + Height |
Harvesting block + Height |
|
Harvesting block + Height + Harvesting block x Height |
Harvesting block + Height + Harvesting block x Height |
|
– |
Scenario + Harvesting block |
|
– |
Scenario + Harvesting block + Scenario x Harvesting block |
|
– |
Scenario + DBH |
|
– |
Scenario + DBH + Scenario x DBH |
|
– |
Scenario + Height |
|
– |
Scenario + Height + Scenario x Height |
|
Null |
Null |
The fit of the models was evaluated using the Akaike Information Criterion (AIC) (Akaike 1974). For each performance indicator, the model with the lowest AIC was evaluated with a likelihood-ratio-based R2 (rsq.lr in the rsq package (Zhang 2024)). This R2 was chosen because it ranges between 0 and 1, comparable to a classical R2. A significance threshold of 0.05 was used.
3. Results
3.1 Sample Description
Sample size varied by harvesting block depending on the species, with, for example, harvesting block G having the highest number of study trees and sugar maple being the most represented as compared to other tree species (Table 5).
Table 5 Number of observations depending on species and harvesting block
|
Harvesting block |
Red maple |
Sugar maple |
Yellow birch |
|
A |
– |
22 |
– |
|
B |
3 |
29 |
20 |
|
C |
– |
1 |
– |
|
D |
1 |
21 |
7 |
|
E |
10 |
4 |
5 |
|
F |
11 |
8 |
– |
|
G |
6 |
124 |
43 |
|
Total |
31 |
209 |
75 |
The DBH of trees ranged from 11.6 cm to 69.5 cm with a mean of 35.9 cm. It was significantly influenced by species and harvesting block (ANOVA, p<0.05, Fig. 3A). Tree heights ranged from 12.2 m to 28.7 m with a mean of 20.9 m. Heights varied significantly between tree species and harvesting block (ANOVA, p<0.05, Fig. 3B). The majority of study trees (80%) had a straight stem below 5 m as expressed by the New Brunswick form and risk classification system (Pelletier et al. 2020), and were thus classified as good form (F1 or F2).
As there was a significant variability of DBH and height depending on harvesting block and species, differentiation between databases were not necessary and trees were instead analyzed depending on harvesting block. This justifies the inclusion of tree size (DHB or height) as a co-variable in our analyses.
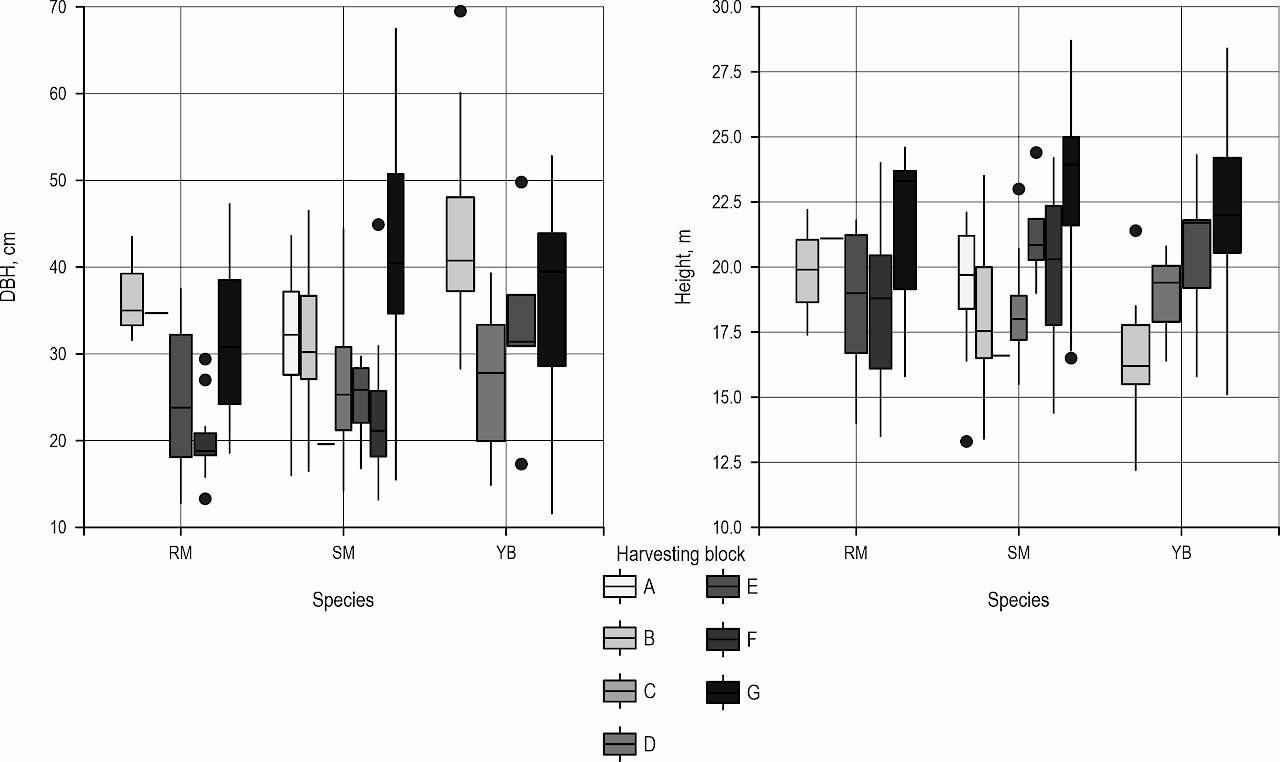
Fig. 3 Variability of DBH (A) and height (B) depending on species (red maple: RM, sugar maple: SM, yellow birch: YB) and harvesting block (A to G)
3.2 Comparison of Actual and Mathematical Bucking
The 315 study trees bucked in the field were classified and compared to a mathematical bucking solution, in both cases using BuckR. Models tested are listed in Table 4 and best models for each performance indicator and tree species are given in Table 6. Results summarized in Table 6 will be explained in the following sections.
Table 6 Best models fit statistics for identified performance indicators for red maple, sugar maple and yellow birch. Variables separated by a + indicate no interactions; when variables are separated by a *, there is interaction between both variables. A Poisson distribution was assumed for discrete variables; continuous variables were best represented by a Gamma distribution with a log link transformation. »Adjustment« indicated the adjustment of values done to meet requirements of distribution. »db« refers to the harvesting block, »dbh« to DBH of trees, »ht« to tree height, »s« to bucking scenario (actual or mathematical)
|
Red maple |
Sugar maple |
Yellow birch |
Distribution |
|||||||||
|
Best model |
Pseudo R² |
Adjustment |
Best model |
Pseudo R² |
Adjustment |
Best model |
Pseudo R² |
Adjustment |
||||
|
Difference in value |
dbh |
0.72 |
2.00 |
db+dbh |
0.87 |
20.00 |
db+dbh |
0.76 |
NA |
Gamma log link |
||
|
Difference in number of logs |
Total |
dbh |
0.17 |
1.00 |
db+ht |
0.40 |
1.00 |
ht |
0.32 |
2.00 |
Poisson |
|
|
Sawlogs |
dbh |
0.24 |
1.00 |
db+dbh |
0.37 |
2.00 |
db+dbh |
0.77 |
NA |
Poisson |
||
|
Pulp |
ht |
0.14 |
1.00 |
db*dbh |
0.17 |
1.00 |
db |
0.33 |
1.00 |
Poisson |
||
|
Difference in merchantable volume |
Total |
dbh |
0.69 |
0.04 |
db*dbh |
0.84 |
0.11 |
db+dbh |
0.80 |
NA |
Gamma log link |
|
|
Sawlogs |
dbh |
0.62 |
0.05 |
db*dbh |
0.80 |
0.70 |
db*dbh |
0.75 |
0.17 |
Gamma log link |
||
|
Pulp |
ht |
0.24 |
0.10 |
db*dbh |
0.19 |
1.50 |
db |
0.21 |
1.30 |
Gamma log link |
||
|
Log length * |
s*db |
0.63 |
NA |
s*db |
0.24 |
NA |
s*db |
0.42 |
NA |
Gamma log link |
||
|
Difference in merchantable length |
ht |
0.31 |
1.70 |
db+ht |
0.54 |
11.00 |
db*ht |
0.74 |
NA |
Gamma log link |
||
|
Difference in top diameter |
dbh |
0.42 |
27.00 |
db*dbh |
0.65 |
52.00 |
dbh |
0.55 |
44.00 |
Gamma log link |
||
|
* log length was compared on a log scale; therefore, the scenario (actual or mathematical) was included as response variable |
||||||||||||
3.3 Value per Tree
The value of a tree was calculated by summing the value of individual logs. Therefore, sawlogs and pulp logs had a value associated depending on their volume. As some trees did not generate merchantable volume and hence had no associated value, the number of observations can be smaller when value differences are expressed in percentage as compared to absolute values (Table A2).
Mean gain in value obtained by mathematical approach ranged from 60% to 169%, with mean differences of 112% as compared to actual bucking (Table A2). Mean differences were particularly high in yellow birches with more than a two-fold increase in mean values. Smallest value gains were observed for red maples. Differences of value were influenced by the dimension (DBH and height) of trees (ANOVA, R2=0.79).
Models best representing these differences of value for tree species are listed in Table 6. Differences in value were driven by different variables depending on tree species. While DBH and harvesting blocks influenced value difference in sugar maple and yellow birch, only DBH influenced value differences in red maple (Table 6). Value differences for each species are presented in Fig. 4.
For red maple, sugar maple and yellow birch, differences in value increased with increasing DBH (Fig. 4 RM, SMa, YBa). For sugar maple and yellow birch, value differences varied depending on the harvesting block (Fig. 4 SMb, YBb).
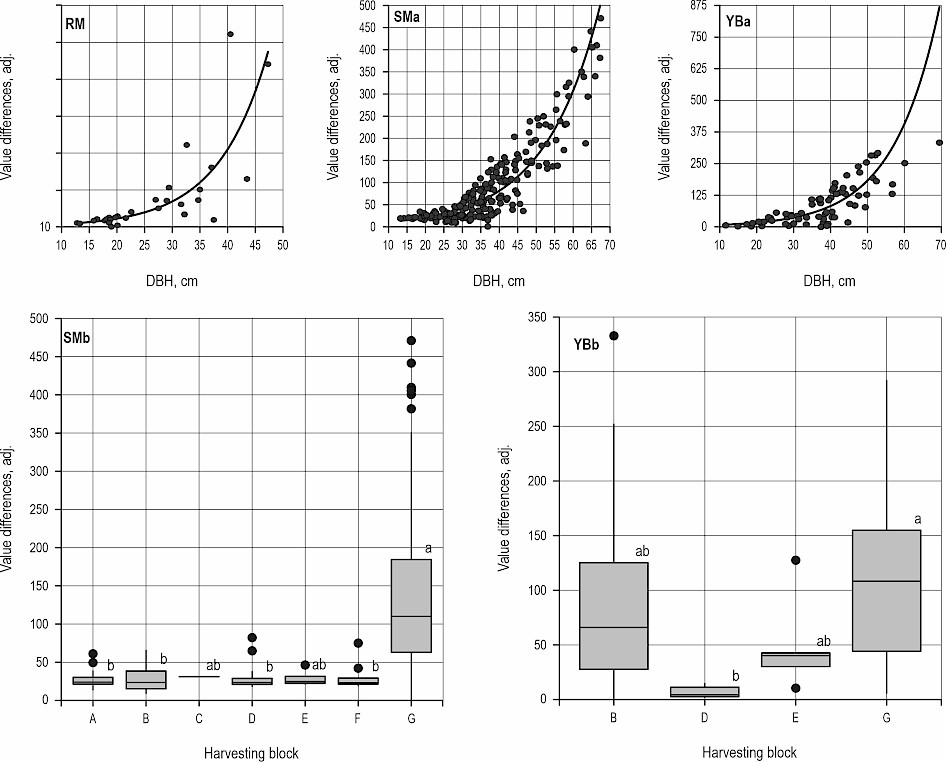
Fig. 4 Difference in value generated through actual and mathematical bucking for red maple (RM), sugar maple (SMa and SMb) and yellow birch (YBa and YBb). Values were adjusted to be strictly positive
3.4 Number of Logs per Tree
Trees bucked in the field produced between 2 and 8 logs, with a mean of 3.32 logs per tree (Table A3). Optimized bucking generated between 2 and 9 logs, with a mean of 5.51 logs per tree. The mean number of merchantable logs increased throughout all tree species, with different intensities of gains depending on tree species. When considering only sawlogs in all trees, mathematical bucking allowed to generate more than twice as much sawlogs as in actual bucking, except for red maple, where gains in sawlogs were smaller (Table A3, Fig. 5).
As the use of BuckR maximized value recovery for each tree, mathematical bucking did not produce waste logs, as those logs do not generate value. Therefore, waste logs were created in actual bucking (0.00 m³ to 2.23 m³ per tree, in average 0.12 m³ per tree), while none were created in mathematical bucking (Table A3, Fig. 5). In most of the harvesting blocks and species combinations, waste was transformed into pulp logs by mathematical bucking (Fig. 5). Gains in the number of logs was particularly pronounced in red maples in harvesting blocks B and E, as well as in sugar maple in harvesting blocks D, E and G as well as in harvesting blocks E and G for yellow birch. The impact of dimension (DBH and height) on the total number of logs was small (ANOVA, R2=0.42).
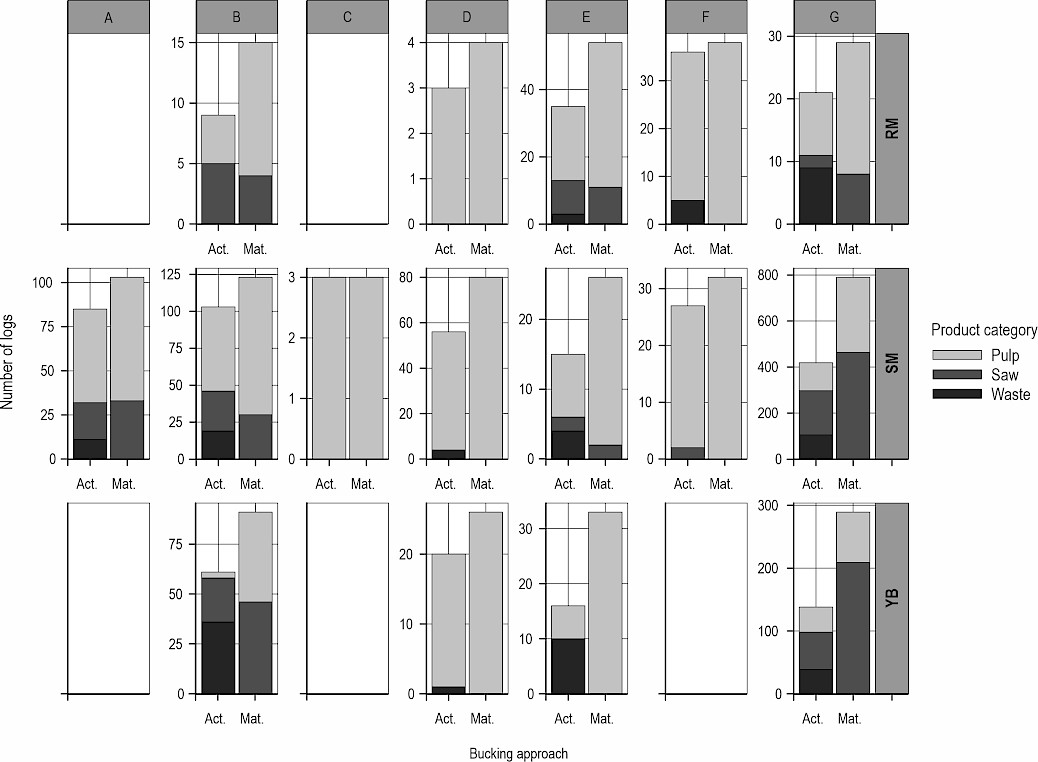
Fig. 5 Mean number of logs generated in trees in actual (Act.) and mathematical (Mat.) bucking in different harvesting blocks and tree species. Product categories are differentiated by different shades of grey
The number of sawlogs generated in actual bucking ranged from 0 to 4, with a mean of 1.09 per tree. In optimized bucking solution, the count of sawlog ranged from 0 to 8, with a mean of 2.56 per tree. While actual bucking generated 0 to 4 pulp logs with a mean of 1.46, optimal solution generated 0 to 8 pulp logs, with a mean of 2.95 per tree.
The difference of logs generated was particularly high in yellow birch, with a mean of 1.8 times more with mathematical bucking. More specifically, mathematical bucking generated at least three times more sawlogs for yellow birches, while maple showed, on average, less gains in sawlog recovery (Table A3).
When comparing the total number of logs depending on harvesting block and species (Fig. 6), all combinations, except sugar maple in harvesting block C, showed an increase of total number of logs generated in mathematical bucking.
Differences of total logs included sawlogs, pulp logs as well as logs classified as waste. Factors explaining these differences are listed in Table 6 and are represented in Fig. 6, Fig. A1 and Fig. A2.
Differences of total logs produced increased with increasing DBH for red maple (Fig. 6 RM) and with increasing tree height in yellow birch and in sugar maple (Fig. 6 YB and SMa). In addition to tree height, harvesting block influenced differences of total logs produced in sugar maple (Fig. 6 SMb).
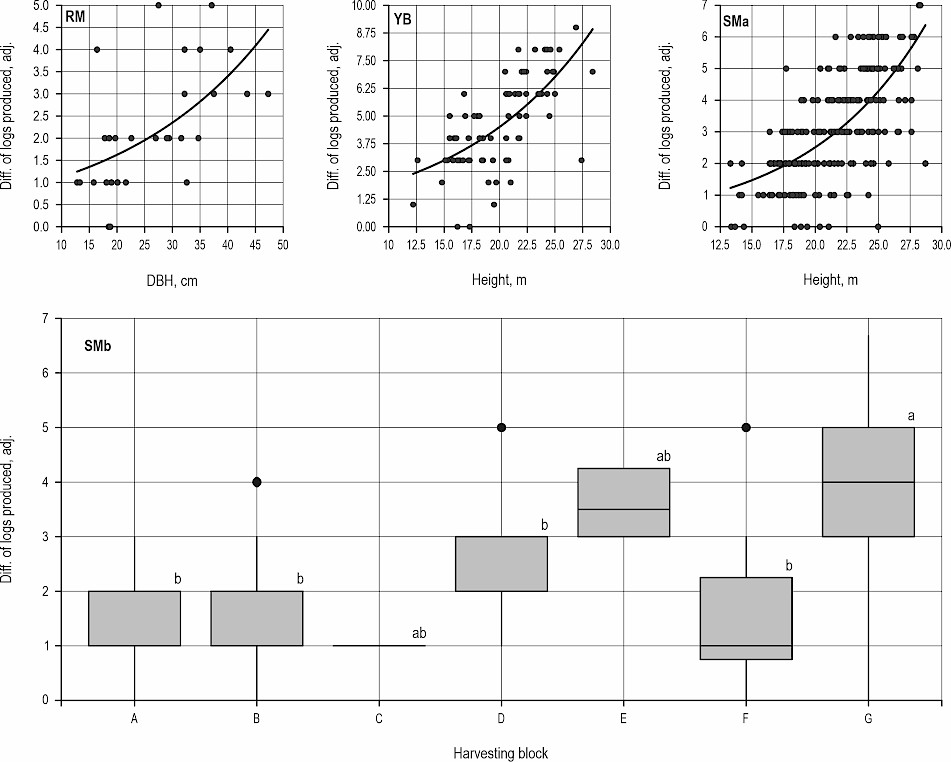
Fig. 6 Differences of total logs produced for red maple (RM), yellow birch (YB) and sugar maple (SMa, SMb)
Mathematical bucking lead to an average gain of 1.46 sawlogs throughout all study trees, with particularly high gains in yellow birches (Table A3, Fig. A1). For pulp logs, mathematical bucking led to an average gain of 1.49 pulp logs (Table A3, Fig. A2). Factors mainly driving these differences are listed in Table 6.
3.5 Merchantable Volume per Tree
Within the 315 study trees, mean volume generated in actual bucking was 0.64 m3/tree, while mathematical bucking generated an average of 1.18 m3/tree, thus representing a gain of 84% (Table A4). Percentages of gains ranged between –15% and 772%, with first quantile at 25% and third quantile at 106%.
The comparison of actual and mathematical bucking in terms of volume generated in the different product categories (Fig. 7) showed that, in all cases, the volume produced in mathematical bucking increased as compared to actual bucking. The differences of volume generated were influenced by the interaction between DBH and height of trees (ANOVA, R2=0.74).
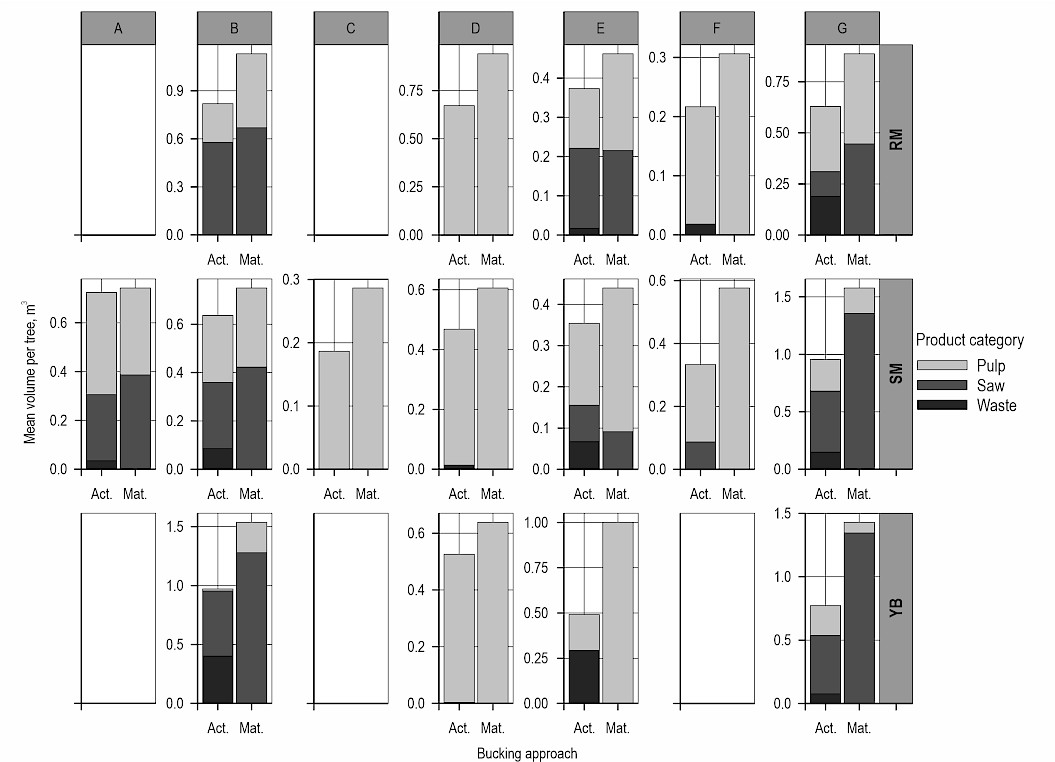
Fig. 7 Volume (m3) generated in actual (Act.) and mathematical (Mat.) bucking in different harvesting blocks and tree species. Product categories are differentiated by different shades of grey
Factors influencing differences of merchantable volume, sawlog and pulp log volume are listed in Table 6 and are represented in Fig. 10, Fig. A3 and Fig. A4.
In red maple and yellow birch, volume gains tend to increase with increasing DBH (Fig. 8 RM, YBb). Furthermore, volume differences in sugar maple tend to increase with increasing DBH (Fig. 8 SM). These increases varied depending on harvesting block, with for example harvesting block G showing higher gains from mathematical bucking as compared to the other harvesting blocks. However, this gain was mainly associated with larger trees (DBH>45 cm), and all these trees were from harvesting block G. Harvesting blocks also influenced volume differences in yellow birch with trees in harvesting block B reaching significantly higher differences in volume as compared to those in harvesting block D (Fig. 8 YBa).
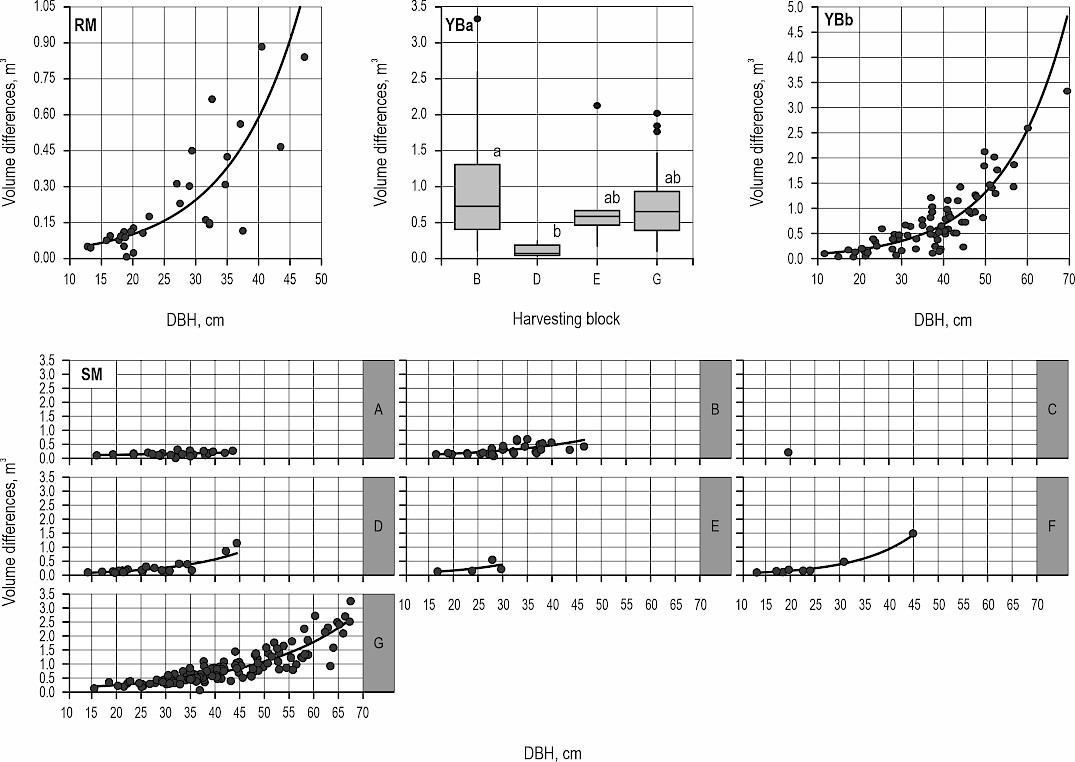
Fig. 8 Volume differences (m3) in merchantable volume between actual and mathematical bucking for red maple (RM), yellow birch (YBa and YBb) and sugar maple (SM)
Considering only sawlogs, volume differences were driven by different variables depending on tree species (Table 6). Throughout all species, mathematical bucking generated on average 2.4 times more sawlog volume as actual bucking (Table A4, Fig. A3). Volume differences generated in pulp logs were overall small throughout all tree species (Table A4, Fig. A4).
3.6 Log Length
Length of logs produced in actual and in mathematical bucking fluctuated between tree species (Table A5). Individual log length varied between actual and mathematical bucking with mean log lengths of merchantable logs being higher in mathematical bucking as compared to actual bucking for all tree species (Table A5). The same observation applied to sawlogs for all tree species. While mean sawlogs generated with actual bucking ranged between 2.79 and 2.95 m, mathematical bucking generated longer logs ranging, in mean, between 3.13 m and 3.71 m depending on tree species (Table A5).
The best model to explain differences in log length of merchantable logs included bucking scenario and harvesting block, with interaction for red and sugar maple as well as for yellow birch (Table 6, Fig. 9). While some differences were null (for example for all three species in harvesting block E), some species, such as sugar maple showed an overall strong increase of log length in mathematical bucking throughout all harvesting blocks except E.
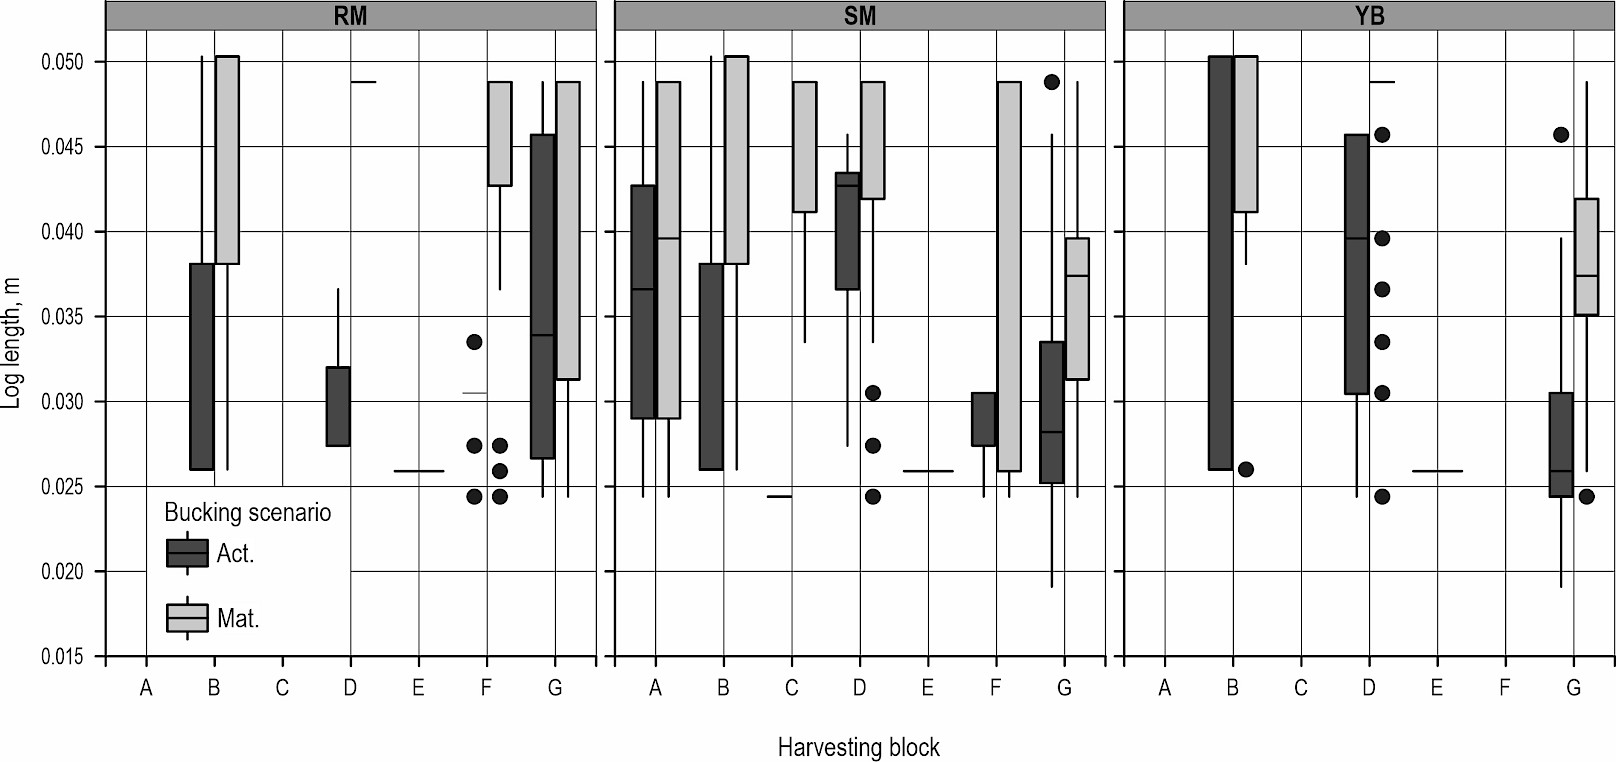
Fig. 9 Log lengths (m) of merchantable logs for red maple (RM), sugar maple (SM) and yellow birch (YB) depending on the interaction of harvesting block and actual (Act.) or mathematical (Mat.) bucking
3.7 Cumulative Merchantable Length
The mean cumulative length of all merchantable logs per tree in actual bucking ranged from 7.51 m to 9.05 m (Table A5). As compared to this, mathematical bucking produced cumulative lengths of 15.60 m to 18.33 m. Throughout all tree species, produced cumulative lengths were, in mean, more than two-fold longer in mathematical bucking as compared to actual bucking. Models best explaining differences between both scenarios are listed in Table 6. Best models for each species are represented in Fig. 10.
Tree height influenced merchantable log length produced in red maple and sugar maple (Fig. 10 RM, SMa). For both species, log length increased with increasing tree height. This observation was also valid for all harvesting blocks for yellow birch (Fig. 10 YB).
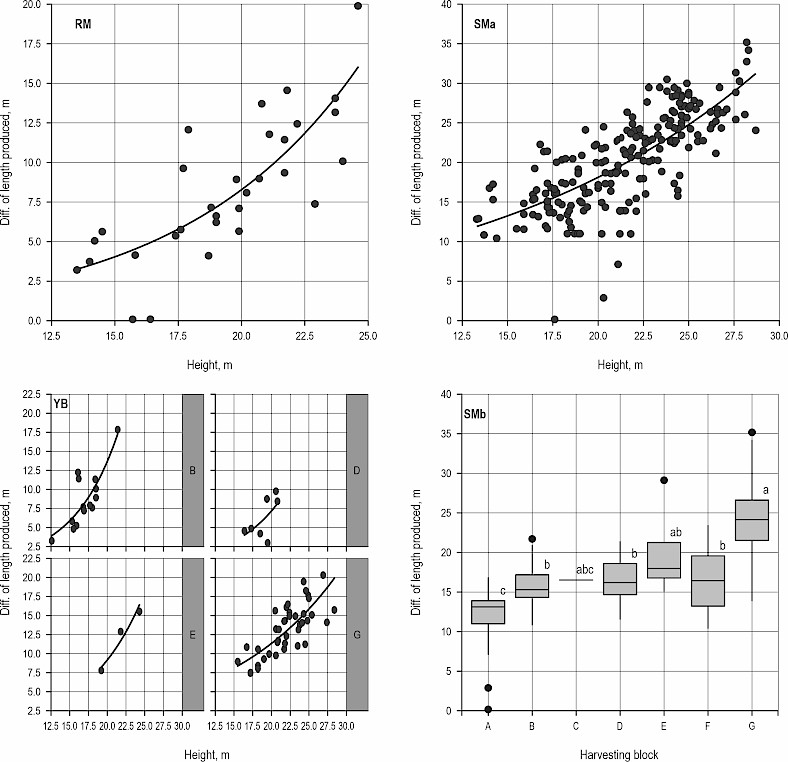
Fig. 10 Difference of cumulative merchantable length reached in red maple (RM), sugar maple (SMa, SMb) and yellow birch (YB)
3.8 Merchantable Top Diameter
Considering merchantable logs, actual bucking generated mean top diameters of 24.37 cm, while mathematical bucking produced logs up to a mean top diameter of 8.62 cm (Table A5). Mathematical bucking always generated at least one pulp log after sawlogs, with no last logs being classified as sawlogs. In actual bucking, one third of the last logs were classified as sawlogs. Factors driving the differences of diameter reached for each tree species are listed in Table 6. Best models for each species are represented in Fig. 11.
Differences in minimal small end diameter tend to increase with increasing DBH for red maple (Fig. 11 RM). For yellow birch and sugar maple, the interaction between DBH and harvesting block mainly influenced the differences in minimal diameter (Fig. 11 YB, SM). For both species, differences in minimal diameter increased with DBH, but the intensity of increase varied between harvesting blocks.
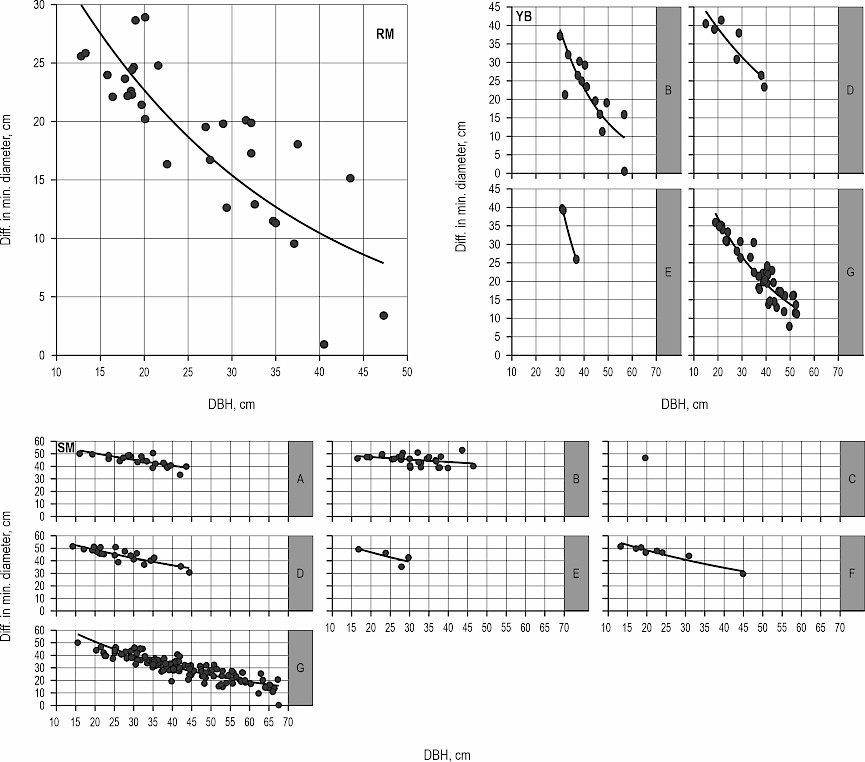
Fig. 11 Differences in minimal diameter in red maple (RM), yellow birch (YB) and sugar maple (SM)
4. Discussion
4.1 Improvement of Bucking Using Mathematical Approach
This study investigated bucking conducted in the field as compared to mathematical bucking of hardwood logs when considering only dimensional aspects of the main stem. Results indicated higher value gains (average 112%) than other studies conducted in softwood operations (1% to 26%, Twaddle and Goulding 1989, Boston and Murphy 2003, Corneau 2009, Akay 2017, Labelle and Huß 2018) and hardwood operations (14% to 55%, Pickens et al. 1992, Wang et al. 2004, 2009). The omission of quality factors as was the case in this study, implied that no waste logs having defects such as forks, rots or cankers were generated. Indeed, studies in which those quality factors were encompassed reported smaller gains of 30 and 40% through optimization (Sessions et al. 1988, Wang et al. 2009). Nonetheless, the overall quality of the 315 study trees was good, with the majority of trees having straight stems, at least within the first 5 m, and thus presenting a sawlog potential (Pelletier et al. 2020).
An average gain of 84% in merchantable volume reported throughout all study trees, was also considerably higher as compared to Pickens et al. (1992) and Wang et al. (2009) who reported 10% and 16% of volume gains, respectively. These gains in merchantable volume were proportional to tree size, a factor that needs to be considered when comparing different studies. Mathematical bucking generated more sawlog volume and small or negative gains in pulp log volume. As sawlogs substantially influence the value compared to pulp logs, value recovery remains substantial.
On average, mathematical bucking generated 1.5 times more logs, which tended to be slightly longer and had a more pronounced length variability. This variability was triggered by a more complete use of product specifications. Furthermore, merchantable length was doubled, thereby reachig nearly three times smaller small-end diameters (8.65 cm in mathematical bucking, 24.28 cm in actual bucking). Results suggest an incomplete utilization of the resource in current CTL operations conducted in hardwoods and a partial processing of the upper part of the main stem.
This underutilization might be explained by:
- the merchandizing of smaller diameters could be perceived by the operator as a loss of productivity and revenue, considering operators are usually paid by productivity in the study area
- the absence of a top saw on the harvesting head may limit the capacity of efficiently merchandizing the upper part of the stem
- contrarily to the price list and specifications used in our study, it is possible that operators were asked to limit the production of pulp logs regarding market demand.
A considerable share of the gains obtained by mathematical buckingcan be explained by the addition of at least one pulp log after the last sawlog processed in a tree. While one third of trees in actual bucking were completed by a sawlog, mathematical bucking added at least one pulp log after the last sawlog. Encouraging operators to finish processing a tree with at least one pulp log could increase the utilization of the hardwood ressource. While a single pulp log does not lead to high increases in value, several small inputs can lead to substantial increase at stand level.
The performance indicators varied depending on tree species and tree size (DBH and height), sometimes in interaction with the harvesting block. The impact of harvesting blocks may reflect the influence of varying harvesting specifications or site attributes, which were shown to influence the recovery of high value logs (Bennemann et al. 2023). While several differences depending on harvesting block and species could be observed in this study, detailed conclusions could not be drawn, as the number of observations were not balanced between harvesting blocks and information of past silviculture treatments, calamities and stand characteristics were not available.
4.2 Methodological Limitations
The available data only allowed the consideration of the main stem up to the first branch. Large branches, stump height, biotic and abiotic factors (past silvicultural treatments or calamities) and damages from harvesting operations (for example broken tops), were not acknowledged in this study.
Stem diameter profile were approximated using the Canadian national tree taper equations (Ung et al. 2013) adjusted to the study trees. As taper equations only estimateactual volume, stem variability, particularly in bottom and upper sections of the stem (Prendes et al. 2023), are not reflected. Thus, bucking precision could be enhanced by the utilization of detailed stem profile measures, for example through the extraction of the harvester OBC data (Skogforsk 2021) or the use of LiDAR scans (Erber et al. 2022, Prendes et al. 2023). This would lead to more precise log volume estimations, in comparison with the Smalian scaling method used in our study (Bennemann et al. 2025).
The exact product specifications applied to the study trees were not listed during harvesting operations but rather described a posteriori from interviews with the forest operation managers. As product specification impact bucking recovery (Pickens et al. 1992, Murphy et al. 2003), potential differences of bucking recovery may be generated, or enforced, by variations in product specifications between the ones used during harvesting operations and the ones applied in BuckR. The multiple destinations of logs for each harvesting block did not allow retracing the exact destination of individual logs. Instead, all logs of the same harvesting block and the same tree species were assumed to be allocated to a single wood processing facility.
As previously mentioned, mathematical bucking did not allow the consideration of stem defects such as forks, rot or cankers, which would normally lead to an exclusion of certain parts of the stem as waste. The absence of specific data on such defects on the measured logs was the major impediment. Further studies need to carefully document the location and size of such defects to allow their inclusion in the mathematical bucking decision. Consequently, the benefits of bucking optimization are likely over-estimated without the consideration of major defects, even when the price lists do not consider log quality grades.
The optimizing algorithm can handle products with random lengths by considering multiple possible lengths for a single log product. However, this is done by discrete increment in length, which may underestimate the value recovery of random length bucking recipes.
4.3 Operational Considerations
While operational implications of our results were not the focus of this study, a modification of bucking to increase gains in value and volume would likely have an impact on operations.
Mathematical bucking proposes a bucking pattern which follows given product specifications. Within this study, no random length was foreseen, thus allowing only logs of predefined length and specific small end diameters. As more products were generated within most of the trees, processed length increased and smaller top diameters were reached, thus leading to an expected increase in processing time and a lowered harvesting productivity (Visser et al. 2009). This is particularly accurate in cases where harvesting heads are not equiped with a top saw and a change of grapple positioning is needed to process logs. The financial impact of this reduced productivity is thus considered as small, considering the higher value recovery which can be reached through the higher resource utilization. In the context of New Brunswick, in which operators are usually paid by productivity, their loss of productivity may nonetheless be counterbalanced, for example by the establishment of financial incentives (Pickens et al. 1992).
As the logs produced through the mathematical bucking do not exceed given dimensions of the associated price list, an impact on log handling and stacking is not expected. Also, wood transportation is not expected to be influenced to a level which might require modifications of the transportation. Indeed, as logs proposed by mathematical bucking remain within the requested product specifications, little to no differences are expected to occur at the transportation stage.
4.4 Opportunities for Further Studies and Outlook
Quality aspects of logs are known to be important for the value recovery in hardwoods (Havreljuk et al. 2022). Typically, many sawmills are ventilating their price lists according to a grading scale based on the number of log »faces« clear of defects, and/or the degree of curvature of the log. Since data included into this study did not cover quality information, logs were assumed to be straight and with no defects. The exclusion of parts of the stem with major defects as »waste« by the algorithm could also greatly improve the quality of the bucking decisions.
Also, the inclusion of major branches in the bucking process would be beneficial for value recovery, since branches were shown to bear more than 40% of tree volume in hardwoods (Ver Planck and MacFarlane 2014). An inclusion of those would allow a more precise evaluation of bucking done in the field.
The consideration of other important factors, such as training, age and experience of operators (Purfürst and Erler 2011, Häggström 2015), harvesting time and season (Bembenek et al. 2020), complexity of price lists and product specifications (Murphy et al. 2003, Spinelli et al. 2020), stand history (Turner 2010, Alveshere et al. 2024) or complexity of stands (Spinelli et al. 2020) could also increase the predictability of hardwood bucking.
The adaptation of tree bucking methods in CTL for hardwood would require new approaches and technologies. Because of their complex architecture, the method commonly used in softwoods, where the stem profile of recently harvested trees is used as partial information of stem taper estimation, is not appropriate for hardwoods. The addition of nonintrusive measuring devices, such as LiDAR, on the harvester, could provide a complete dataset on tree size and architecture to support stem-level bucking decisions. Another approach to obtain the actual tree profile would require passing the entire stem through the feed rollers once, while performing bucking during the second pass (Heppelmann et al. 2019). The reduction of productivity associated with this technique could be counterbalanced by bonus payments for gains in value or by the change towards a payment based on working time instead of productivity.
As product recovery was strongly influenced by site, tree and stand factors (Bennemann et al. 2023) and the high variation of variables influencing different performance indicators, results from this study should not be directly transposed to other trees. However, the open-access bucking optimizing tool BuckR (Bennemann et al. 2025) could be useful as it can be tailored to specific needs of the end users.
5. Conclusion
Mathematical bucking was applied to 315 hardwoods in Acadian forests in Eastern Canada using BuckR, a bucking optimizer for the logs in the main stem of trees with focus on dimensional aspects. Results indicate that an average value increase of 112% and volume recovery gains of 84% in the field would be possible through an optimizing process solely based on tree dimensions. Gains were obtained by an increase in the number of pulp and sawlogs produced, a strong increase of cumulative merchantable length, an increase of log length and the valuation of products up to smaller diameters in trees. Gains in volume and value recovery are likely over-estimated by major stem defects leading to waste, a factor that could not be considered in our study due to data limitation. Additional studies that consider quality aspects (stem form and quality, location of branches, products located in branches) should be performed to improve our overall understanding of hardwood bucking.
Acknowledgments
The authors want to acknowledge the Northern Hardwoods Research Institute (NHRI) and the New Brunswick Department of Natural Resources and Energy Development (NBDNRED) for the in-depth field work and for sharing the comprehensive datasets used in this study; particularly Gaetan Pelletier, Pamela Hurley-Poitras and Dr. Chris Hennigar. We also want to thank Conway Elkins and Ryan McLaughlin as well as Jody Jenkins for their help untangling product specifications.
Author Contributions
CB, ERL, JML, FH and HB conceived the ideas and designed the methodology; CB analyzed the data and visualized it; CB led the writing of the manuscript. ERL and JML had the project administration and acquired funding. All authors contributed critically to the drafts and gave final approval for publication.
6. References
Akaike, H., 1974: A new look at the statistical model identification. IEEE Trans. Autom. Control 19(6): 716–723. https://doi.org/10.1109/TAC.1974.1100705
Akay, A.E., 2017: Potential Contribution of Optimum Bucking Method to Forest Products Industry. Eur. J. For. Eng. 3(2): 61–65.
Alveshere, B.C., Bunce, A., Worthley, T.E., Fahey, R.T., 2024: Evaluating effects of silvicultural treatments on forest canopy structure outcomes. Can. J. For. Res. 54(12): 1443–1457. https://doi.org/10.1139/cjfr-2024-0080
Bembenek, M., Tsioras, P.A., Karaszewski, Z., Zawieja, B., Bakinowska, E., Mederski, P.S., 2020: Effect of Day or Night and Cumulative Shift Time on the Frequency of Tree Damage during CTL Harvesting in Various Stand Conditions. Forests 11(7): 743. https://doi.org/10.3390/f11070743
Bennemann, C., Labelle, E.R., Lussier, J.-M., 2023: Influence of Tree, Stand, and Site Attributes on Hardwood Product Yield: Insights into the Acadian Forests. Forests 14(2): 182. https://doi.org/10.3390/f14020182
Bennemann, C., Lussier, J.-M., Labelle, E.R., 2025: An open-source tree bucking optimizer based on dynamic programming. Forests 16(5): 780. https://doi.org/10.3390/f16050780
Boston, K., Murphy, G., 2003: Value recovery from two mechanized bucking operations in the Southeastern United States. South. J. Appl. For. 27(4): 259–263. https://doi.org/10.1093/sjaf/27.4.259
Corneau, Y., 2009: Bénéfices de l’optimisation du tronçonnage des bois feuillus. Rapport final, FPInnovations Division Forintek, Québec. Available from https://library.fpinnovations.ca/link/fpipub2631 [accessed 6 October 2025].
Corneau, Y., Fournier, F., 2005: Efficiency of bucking with cut-to-length harvester in the forest. Forintek Canada Corp, Sainte-Foy, Québec. Available from https://library.fpinnovations.ca/link/fpipub42297 [accessed 17 April 2025].
Erber, G., Gollob, C., Krassnitzer, R., Nothdurft, A., Stampfer, K., 2022: Stem-Level Bucking Pattern Optimization in Chainsaw Bucking Based on Terrestrial Laser Scanning Data. Croat. J. For. Eng. 43(2): 287–301. https://doi.org/10.5552/crojfe.2022.1596
Faaland, B., Briggs, D., 1984: Log Bucking and Lumber Manufacturing Using Dynamic Programming. Manag. Sci. 30(2): 245–257. https://doi.org/10.1287/mnsc.30.2.245
FAO, 2022: FAO Yearbook of Forest Products 2020. https://doi.org/10.4060/cc3475m
Häggström, C., 2015: Human factors in mechanized cut-to-length forest operations. Doctoral dissertation, Swedish University of Agricultural Sciences, Umeå, Sweden.
Havreljuk, F., Achim, A., Pothier, D., 2022: Predicting Lumber Grade Occurrence and Volume in Sugar Maple and Yellow Birch Logs. For. Sci. 68(4): 410–424. https://doi.org/10.1093/forsci/fxac019
Hennigar, C., Lewis, P., Girouard, M., Pelletier, G., 2018: New Brunswick Hardwood Merchantable Log Product Volume Study (Draft).
Heppelmann, J.B., Labelle, E.R., Wittkopf, S., Seeling, U., 2019: In-stand debarking with the use of modified harvesting heads: a potential solution for key challenges in European forestry. Eur. J. For. Res. (138): 1067–1081. https://doi.org/10.1007/s10342-019-01225-y
Kärhä, K., Änäkkälä, J., Hakonen, O., Palander, T., Sorsa, J.-A., Räsänen, T., Moilanen, T., 2017: Analyzing the Antecedents and Consequences of Manual Log Bucking in Mechanized Wood Harvesting. Mech. Mater. Sci. Eng. Available from https://erepo.uef.fi/items/2d163e7f-be9f-494c-a4a3-e40876be9906 [accessed 5 May 2025].
Kershaw, J.A., Ducey, M.J., Beers, T.W., Husch, B., 2017: Forest mensuration. In 5th edition. Wiley/Blackwell, Chichester, UK ; Hoboken, NJ.
Kivinen, V.-P., 2004: A Genetic Algorithm Approach to Tree Bucking Optimization. For. Sci. 50(5): 696–710. https://doi.org/10.1093/forestscience/50.5.696
Labelle, E.R., Huß, L., 2018: Creation of value through a harvester on-board bucking optimization system operated in a spruce stand. Silva Fenn. 52(3): article id 9947. https://doi.org/10.14214/sf.9947
Laroze, A.J., 1994: Development and Comparison of Stand-Level Bucking Optimization Methods. Doctoral dissertation, Oregon State University, Corvallis, Oregon. Available from http://hdl.handle.net/1957/10344 [accessed 8 July 2025].
Laroze, A.J., Greber, B.J., 1997: Using Tabu Search To Generate Stand-Level, Rule-Based Bucking Patterns. For. Sci. 43(2): 157–169. https://doi.org/10.1093/forestscience/43.2.157
Lembersky, M.R., Chi, U.H., 1986: Weyerhaeuser Decision Simulator Improves Timber Profits. Interfaces 16(1): 6–15. https://doi.org/10.1287/inte.16.1.6
Loo, J., Ives, N., 2003: The Acadian Forest: Historical condition and human impacts. For. Chron. 79(3): 462–474. https://doi.org/10.5558/tfc79462-3
Murphy, G.E., Marshall, H.D., Conradie, I., 2003: Market complexity and its effect on variables that gauge the economics of harvesting production. N. Z. J. For. 33(2): 281–292.
NBDNRED, 2022: Crown Timber Utilization Standards. Available from https://www2.gnb.ca/content/gnb/en/departments/erd/forestry-conservation/content/forest-products/crown-timber-utilization.html [accessed 6 October 2025].
NBDNRED, (n.d.): New Brunswick Forests. Available from https://www2.gnb.ca/content/dam/gnb/Departments/nr-rn/pdf/en/ForestsCrownLands/GNBForestryBrochure_EN.pdf [accessed 30 January 2025].
NRCan, 2022: The State of Canada’s Forests: Annual Report 2022. Available from https://ressources-naturelles.canada.ca/nos-ressources-naturelles/forets/letat-forets-canada-rapport-annuel/bois-recolte-facon-durable/16495 [accessed 30 January 2025].
Pagnussat, M.B., Silva Lopes, E.D., Robert, R.C.G., 2021: Machine availability and productivity during timber harvester machine operator training. Can. J. For. Res. 51(3): 433–438. https://doi.org/10.1139/cjfr-2020-0164
Pelletier, G., 2020: Digital Timberlands 2020 – Final Project Draft. Northern Hardwoods Research Institute Inc. (NHRI).
Pelletier, G., Landry, D., Girouard, M., 2020: A Tree Classification System for New Brunswick. NHRI. Available from https://hardwoodsnb.ca/images/5Points/2016TreeClassificationSystemForNB-Version2.pdf [accessed 8 July 2025].
Pickens, J.B., Everett, A., Noble, S., Baumgras, J., Araman, P., Waniger, C., Steele, A., 2006: Intensive Hardwood Log Bucker Training using HW Buck Dramatically Improves Value Recovery. In Proceedings, Society of American Foresters 2005 National Convention, 9 p.
Pickens, J.B., Lee, A., Lyon, G.W., 1992: Optimal Bucking of Northern Hardwoods. North. J. Appl. For. 9(4): 149–152. https://doi.org/10.1093/njaf/9.4.149
Prendes, C., Acuna, M., Canga, E., Ordoñez, C., Cabo, C., 2023: Optimal bucking of stems from terrestrial laser scanning data to maximize forest value. Scand. J. For. Res. 38(3): 174–188. https://doi.org/10.1080/02827581.2023.2215544
Purfürst, F.T., 2010: Learning curves of Harvester Operators. Croat. J. For. Eng. 31(2): 89–97.
Purfürst, F.T., Erler, J., 2011: The Human Influence on Productivity in Harvester Operations. Int. J. For. Eng. 22(2): 15–22. https://doi.org/10.1080/14942119.2011.10702606
R Core Team, 2021: R: A language and environment for statistical computing. R Foundation for Statistical Computing, Vienna, Austria. Available from https://www.R-project.org/
Sessions, J., Layton, R., Guangda, L., 1988: Making better tree-bucking decisions: A network solution. The Compiler 6(1): 5–9.
Sessions, J., Olsen, E.D., Garland, J., 1989: Tree Bucking for Optimal Stand Value with Log Allocation Constraints. For. Sci. 35(1): 271–276. https://doi.org/10.1093/forestscience/35.1.271
Skogforsk, 2021: StandForD 2010 – modern communication with forest machines. Available from https://www.skogforsk.se/cd_20210625001813/contentassets/1a68cdce4af1462ead048b7a5ef1cc06/stanford2010-info-english-2021.zip [accessed 5 May 2025].
SNBFPMB, 2022: Hardwood sawlog, veneer & spoolwood prices and specs. Available from https://snbfpmb.ca/markets [accessed 4 July 2022].
SNBFPMB, 2025: Current Market Specifications and Prices. Available from https://snbfpmb.ca/markets [accessed 7 May 2025].
Spinelli, R., Magagnotti, N., Labelle, E.R., 2020: The Effect of New Silvicultural Trends on the Mental Workload of Harvester Operators. Croat. J. For. Eng. 41(2): 177–190. https://doi.org/10.5552/crojfe.2020.747
Taylor, A.R., McPhee, D.A., Loo, J.A., 2013: Incidence of beech bark disease resistance in the eastern Acadian forest of North America. For. Chron. 89(5): 690–695. https://doi.org/10.5558/tfc2013-122
Thom, H.C.S., 1958: A note on the Gamma distribution. Mon. Weather Rev. 86(4): 117–122. https://doi.org/10.1175/1520-0493(1958)086<0117:ANOTGD>2.0.CO;2
Turner, M.G., 2010: Disturbance and landscape dynamics in a changing world. Ecology 91(10): 2833–2849. https://doi.org/10.1890/10-0097.1
Twaddle, A.A., Goulding, C.J., 1989: Improving profitability by optimising log-making. N. Z. J. For. 34(1): 17–23.
Ung, C.-H., Guo, X.J., Fortin, M., 2013: Canadian national taper models. For. Chron. 89(2): 211–224. https://doi.org/10.5558/tfc2013-040
Ver Planck, N.R., MacFarlane, D.W., 2014: Modelling vertical allocation of tree stem and branch volume for hardwoods. Forestry 87(3): 459–469. https://doi.org/10.1093/forestry/cpu007
Visser, R., Spinelli, R., Saathof, Fairbrother, S., 2009: Finding the »Sweet-Spot« of Mechanised Felling Machines. Lake Tahoe, 11 p. Available from https://www.researchgate.net/publication/372071571_Finding_the_'Sweet-Spot'_of_Mechanised_Felling_Machines [accessed 6 October 2025].
Wang, J., LeDoux, C.B., McNeel, J., 2004: Optimal tree-stem bucking of northeastern species of China. For. Prod. J. 54(2): 45–52.
Wang, J., Liu, J., LeDoux, C.B., 2009: A Three-Dimensional Bucking System for Optimal Bucking of Central Appalachian Hardwoods. Int. J. For. Eng. 20(2): 10. https://doi.org/10.1080/14942119.2009.10702580
Wiedenbeck, J., Smith, K.T., 2018: Hardwood management, tree wound response, and wood product value. For. Chron. 94(3): 292–306. https://doi.org/10.5558/tfc2018-042
Zhang, D., 2024: September 29. rsq: R-Squared and Related Measures. https://doi.org/10.32614/CRAN.package.rsq
Appendix
For trees harvested in block G, product specifications applied in the study were the purchase wood specifications effective at the time of harvesting.
Product specifications of blocks A, C, D, E, and F could be retraced through the exchange with the licensee. An overview of all volumes transported to different sawmills was available for each harvesting block and tree species. Based on this overview, unique specifications were directly transcribed into a format usable for this study. In the cases where it was not possible to directly retrace whether logs have been bucked according to one or another specification, both specifications were included in the study, the optimization process was conducted and finally the specifications with the best optimization results were retained.
Specifications for block B are based on the Hardwood Crown Utilization Standard (NBDNRED 2022). This standard exists for all tree species and classifies hardwoods harvested on Crown Lands into veneer, sawlogs and pulp. Crown Utilization Standard allows sawlogs of all lengths as long as a minimal diameter of 24.5 cm outside bark is reached at 2.6 m. As product specifications applied to this study needed to be more specific, random length was translated by one feet steps within the requested lengths.
Complexity of product specifications was determined through analysis of different characteristics of specifications as shown in Table A1.
Table A1 Product specifications for different tree species in harvesting blocks included in this study
|
Species |
Block |
Possible product lengths |
Min. length, m |
Max. length, m |
Min. diam., cm |
Max. diam., cm |
Nb of products |
Pulp is possible |
Random length in pulp |
Saw-logs are possible |
Random length in sawlogs |
|
Red maple |
B |
3 |
2.60 |
5.03 |
7.6 |
80.0 |
2 |
Yes |
Yes |
Yes |
Yes |
|
D |
10 |
2.44 |
4.88 |
7.6 |
55.9 |
2 |
Yes |
Yes |
Yes |
No |
|
|
E |
1 |
2.59 |
7.6 |
55.9 |
2 |
Yes |
No |
Yes |
No |
||
|
F |
10 |
2.44 |
4.88 |
7.6 |
55.9 |
2 |
Yes |
Yes |
Yes |
No |
|
|
G |
11 |
2.44 |
4.88 |
7.6 |
80.0 |
3 |
Yes |
Yes |
Yes |
No |
|
|
Sugar maple |
A |
10 |
2.44 |
4.88 |
7.6 |
80.0 |
2 |
Yes |
Yes |
Yes |
No |
|
B |
3 |
2.60 |
5.03 |
7.6 |
80.0 |
2 |
Yes |
Yes |
Yes |
Yes |
|
|
C |
10 |
2.44 |
4.88 |
7.6 |
55.9 |
2 |
Yes |
Yes |
Yes |
No |
|
|
D |
10 |
2.44 |
4.88 |
7.6 |
55.9 |
2 |
Yes |
Yes |
Yes |
No |
|
|
E |
1 |
2.59 |
7.6 |
55.9 |
2 |
Yes |
No |
Yes |
No |
||
|
F |
10 |
2.44 |
4.88 |
7.6 |
55.9 |
2 |
Yes |
Yes |
Yes |
No |
|
|
G |
19 |
1.91 |
4.88 |
7.6 |
80.0 |
6 |
Yes |
Yes |
Yes |
No |
|
|
Yellow birch |
B |
3 |
2.60 |
5.03 |
7.6 |
80.0 |
2 |
Yes |
Yes |
Yes |
Yes |
|
C |
1 |
2.59 |
7.6 |
55.9 |
1 |
Yes |
No |
No |
NA |
||
|
D |
9 |
2.44 |
4.88 |
7.6 |
55.9 |
1 |
Yes |
Yes |
No |
NA |
|
|
E |
1 |
2.59 |
7.6 |
55.9 |
1 |
Yes |
No |
No |
NA |
||
|
F |
1 |
2.59 |
7.6 |
55.9 |
1 |
Yes |
No |
No |
NA |
||
|
G |
20 |
1.91 |
4.88 |
7.6 |
80.0 |
7 |
Yes |
Yes |
Yes |
No |
|
Table A2 Mean and standard deviation of tree value by species, for actual and mathematical bucking
|
Indicator |
Statistic |
Bucking scenario |
Red maple |
Sugar maple |
Yellow birch |
Total |
|
Value generated |
N |
Act. |
31 |
209 |
75 |
315 |
|
Mat. |
31 |
209 |
75 |
315 |
||
|
Mean (sd) |
Act. |
29.27 (30.14) |
69.47 (55.57) |
64.00 (54.82) |
64.21 (54.58) |
|
|
Mat. |
46.59 (52.05) |
143.18 (134.27) |
156.66 (114.50) |
136.89 (127.34) |
||
|
Relative value differences, % |
N |
– |
31 |
208 |
65 |
304 |
|
Mean (sd) |
– |
60 (91) |
103 (143) |
169 (238) |
112 (167) |
Table A3 Mean and standard deviation of number of sawlogs, pulp logs, merchantable logs, waste logs and total number of logs by species, for actual and mathematical bucking
|
Indicator |
Statistic |
Bucking scenario |
Red maple |
Sugar maple |
Yellow birch |
Total |
|
Number of sawlogs |
Mean (sd) |
Act. |
0.55 (0.92) |
1.17 (1.06) |
1.08 (1.02) |
1.09 (1.05) |
|
Mat. |
0.74 (1.18) |
2.53 (2.00) |
3.40 (2.31) |
2.56 (2.13) |
||
|
Number of pulp logs |
Mean (sd) |
Act. |
2.26 (1.06) |
1.54 (1.10) |
0.91 (1.09) |
1.46 (1.15) |
|
Mat. |
3.77 (1.02) |
3.00 (1.03) |
2.45 (1.54) |
2.95 (1.22) |
||
|
Number of merchantable logs |
Mean (sd) |
Act. |
2.81 (0.91) |
2.70 (0.95) |
1.99 (1.06) |
2.54 (1.02) |
|
Mat. |
4.52 (1.41) |
5.54 (1.58) |
5.85 (1.69) |
5.51 (1.62) |
||
|
Number of waste logs |
Mean (sd) |
Act. |
0.55 (0.89) |
0.68 (0.96) |
1.15 (1.37) |
0.78 (1.08) |
|
Mat. |
0.00 (0.00) |
0.00 (0.00) |
0.00 (0.00) |
0.00 (0.00) |
||
|
Total number of logs |
Mean (sd) |
Act. |
3.35 (0.75) |
3.39 (1.19) |
3.13 (1.11) |
3.32 (1.13) |
|
Mat. |
4.52 (1.41) |
5.54 (1.58) |
5.85 (1.69) |
5.51 (1.63) |
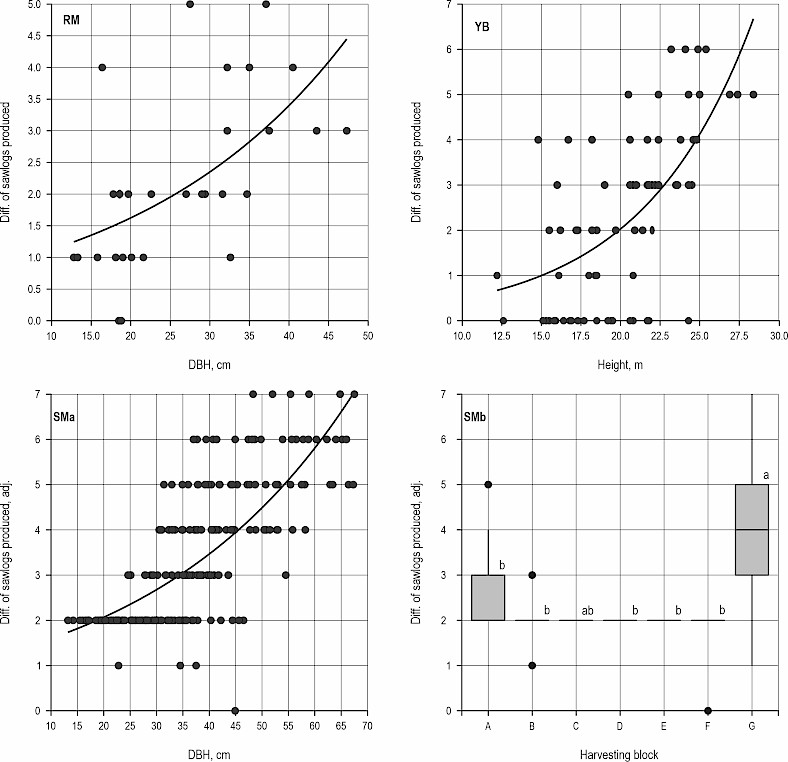
Fig. A1 Differences of sawlogs produced for red maple (RM), yellow birch (YB) and sugar maple (SMa, SMb)
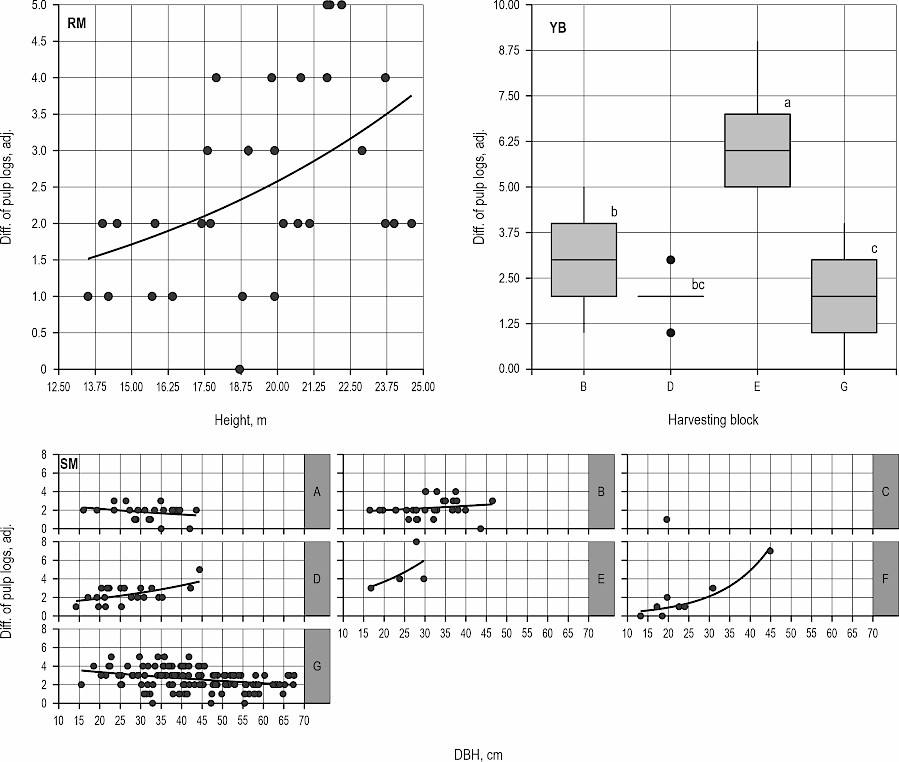
Fig. A2 Differences of pulp logs produced for red maple (RM), yellow birch (YB) and sugar maple (SM)
Table A4 Mean and standard deviation of merchantable volume, sawlog volume, pulp volume and waste volume by species, for actual and mathematical bucking
|
Indicator |
Statistic |
Bucking scenario |
Red maple |
Sugar maple |
Yellow birch |
Total |
|
N |
31 |
209 |
75 |
315 |
||
|
Merchantable volume, m3 |
Mean (sd) |
Act. |
0.37 (0.28) |
0.69 (0.42) |
0.61 (0.44) |
0.64 (0.43) |
|
Mat. |
0.57 (0.46) |
1.21 (0.87) |
1.36 (0.80) |
1.18 (0.84) |
||
|
Sawlog volume, m3 |
Mean (sd) |
Act. |
0.15 (0.27) |
0.39 (0.40) |
0.41 (0.43) |
0.37 (0.40) |
|
Mat. |
0.22 (0.38) |
0.91 (0.92) |
1.11 (0.90) |
0.89 (0.91) |
||
|
Pulp volume, m3 |
Mean (sd) |
Act. |
0.23 (0.14) |
0.31 (0.27) |
0.20 (0.31) |
0.27 (0.27) |
|
Mat. |
0.35 (0.21) |
0.31 (0.26) |
0.24 (0.34) |
0.29 (0.28) |
||
|
Waste volume, m3 |
Mean (sd) |
Act. |
0.05 (0.10) |
0.11 (0.22) |
0.17 (0.34) |
0.12 (0.25) |
|
Mat. |
0.00 (0.00) |
0.00 (0.00) |
0.00 (0.00) |
0.00 (0.00) |
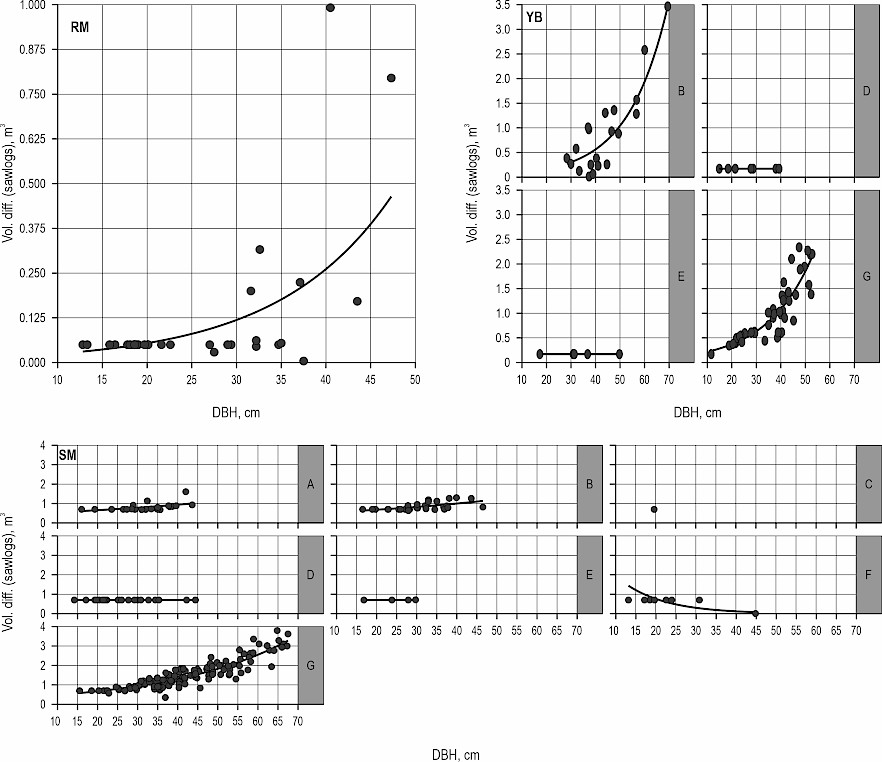
Fig. A3 Volume differences (m3) in sawlogs between actual and mathematical bucking for red maple (RM), yellow birch (YB) and sugar maple (SM)
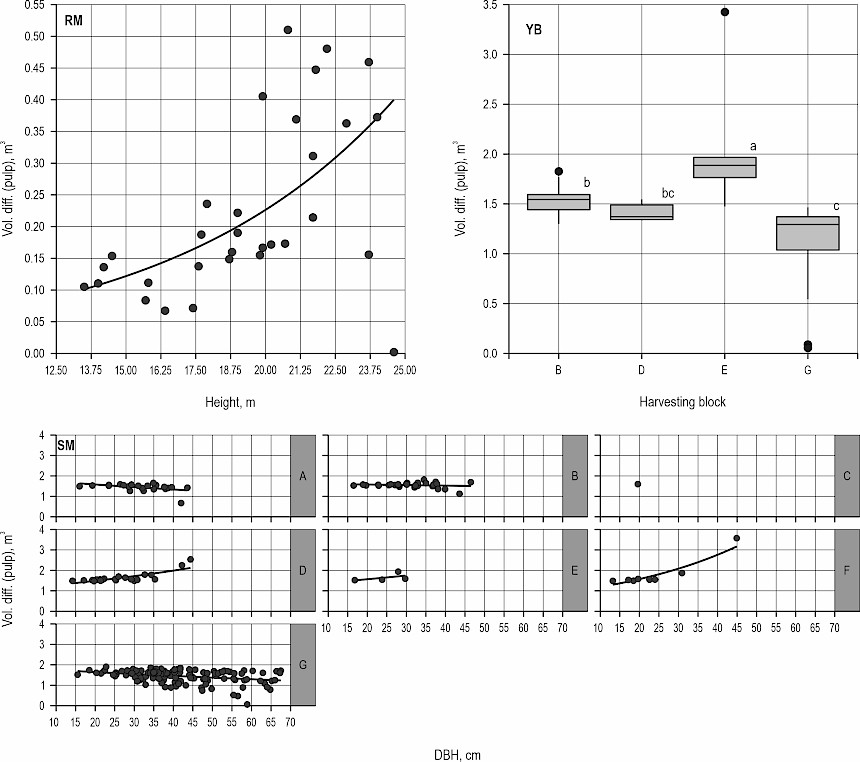
Fig. A4 Volume differences (m3) in pulp log between actual and mathematical bucking for red maple (RM), yellow birch (YB) and sugar maple (SM)
Table A5 Mean and standard deviation of the number of log length, cumulative merchantable length and top merchantable diameter by species, for actual and mathematical bucking
|
Indicator |
Statistic |
Bucking scenario |
Red maple |
Sugar maple |
Yellow birch |
Total |
|
|
Log length, m |
Merchantable |
N |
Act. |
87 |
565 |
149 |
801 |
|
Mat. |
138 |
1131 |
427 |
1696 |
|||
|
Mean (sd) |
Act. |
2.97 (0.60) |
3.17 (0.76) |
3.00 (0.75) |
3.12 (0.74) |
||
|
Mat. |
3.61 (1.11) |
3.78 (0.91) |
3.87 (0.89) |
3.79 (0.92) |
|||
|
Pulpwood |
N |
Act. |
70 |
321 |
68 |
459 |
|
|
Mat. |
112 |
566 |
209 |
887 |
|||
|
Mean (sd) |
Act. |
3.01 (0.58) |
3.46 (0.80) |
3.05 (0.75) |
3.33 (0.79) |
||
|
Mat. |
3.72 (1.13) |
4.21 (1.00) |
4.03 (1.04) |
4.10 (1.04) |
|||
|
Sawlog |
N |
Act. |
17 |
244 |
81 |
342 |
|
|
Mat. |
26 |
565 |
218 |
809 |
|||
|
Mean (sd) |
Act. |
2.83 (0.64) |
2.79 (0.47) |
2.95 (0.75) |
2.83 (0.56) |
||
|
Mat. |
3.13 (0.86) |
3.36 (0.53) |
3.71 (0.68) |
3.45 (0.61) |
|||
|
Cumulative merchantable length, m |
N |
Act. |
31 |
208 |
65 |
304 |
|
|
Mat. |
31 |
209 |
75 |
315 |
|||
|
Mean (sd) |
Act. |
9.05 (2.73) |
8.87 (3.12) |
7.51 (2.46) |
8.60 (3.00) |
||
|
Mat. |
15.60 (4.23) |
18.22 (5.43) |
18.33 (3.90) |
17.99 (5.05) |
|||
|
Top Merchantable diameter, cm |
N |
Act. |
31 |
208 |
65 |
304 |
|
|
Mat. |
31 |
209 |
75 |
315 |
|||
|
Mean (sd) |
Act. |
16.78 (7.05) |
23.90 (10.59) |
29.51 (9.74) |
24.37 (10.64) |
||
|
Mat. |
8.69 (1.50) |
8.27 (0.83) |
9.55 (3.06) |
8.62 (1.78) |
|||
© 2026 by the authors. Submitted for possible open access publication under the
terms and conditions of the Creative Commons Attribution (CC BY) license (http://creativecommons.org/licenses/by/4.0/).
Authors’ addresses:
Caroline Bennemann, MSc *
e-mail: caroline.bennemann.1@ulaval.ca
Prof. Eric R. Labelle, PhD
e-mail: eric.labelle@sbf.ulaval.ca
Université Laval
Faculty of Forestry, Geography and Geomatics
Department of Wood and Forest Sciences
2405 rue de la Terrasse
Québec, QC, G1V 0A6
CANADA
Jean-Martin Lussier, PhD
e-mail: jean-martin.lussier@nrcan-rncan.gc.ca
Caroline Bennemann, MSc
Canadian Forest Service (CFS)
Natural Resources Canada
1055 Rue du Peps
Québec, QC, G1V 4C7
CANADA
Filip Havreljuk, PhD
e-mail: filip.havreljuk@mrnf.gouv.qc.ca
Forest Research Department (DRF)
Ministry of Natural Resources and Forests
2700 Rue Einstein
Québec, QC, G1P 3W8
CANADA
Herbert Borchert, PhD
e-mail: herbert.borchert@lwf.bayern.de
Bavarian State Institute of Forestry (LWF)
Hans-Carl-von-Carlowitz-Platz 1
85354 Freising
GERMANY
* Corresponding author
Received: July 04, 2025
Accepted: October 06, 2025
Original scientific paper