
Effectiveness of Four Types of WorldView-2/3 Features in Tree Species Identification
doi: https://doi.org/10.5552/crojfe.2026.3281
volume: issue, issue:
pp: 15
- Author(s):
-
- Liu Huaipeng
- Article category:
- Original scientific paper
- Keywords:
- WorldView-3/2, four types of features, tree species identification, effectiveness evaluation, random forest
Abstract
HTML
Extracting key features from remote sensing imagery for the purpose of identifying tree species holds significant importance. To assess the importance of the newly proposed polygon area index (PAI) and other features in classifying tree species, this research employed WorldView-3/2 (WV-3/2) as the experimental dataset and constructed four distinct feature sets: spectral bands, HSVs (hue, saturation, and value), textures and PAIs. Then, these feature sets and their combinations were utilized, and the random forest method was applied to classify tree species and ascertain the importance of the features involved in the classification process. The experimental results demonstrate that all texture features play a crucial role in the identification of tree species, with eight features being selected. Additionally, numerous HSV features (WV-3: 29, WV-2: 21) and PAI features (WV-3: 7, WV-2: 4) also make significant contributions. However, the spectral bands did not show a notable positive impact, as none were selected. When compared with the use of single-type features, the integration of multiple features from WorldView-3/2 resulted in more effective tree species identification, achieving an overall accuracy of 90.45% for WV-3 and 84.60% for WV-2, surpassing the highest overall accuracy achieved by single-type features, which was 76.64% for WV-3 and 78.27% for WV-2. The experimental results indicate that multi-type features should be used for tree species classification. Additionally, the newly proposed PAI feature demonstrates a positive contribution and is recommended for active use in tree species classification.
Effectiveness of Four Types of WorldView-2/3 Features in Tree Species Identification
Huaipeng Liu
https://doi.org/10.5552/crojfe.2026.3281
Abstract
Extracting key features from remote sensing imagery for the purpose of identifying tree species holds significant importance. To assess the importance of the newly proposed polygon area index (PAI) and other features in classifying tree species, this research employed WorldView-3/2 (WV-3/2) as the experimental dataset and constructed four distinct feature sets: spectral bands, HSVs (hue, saturation, and value), textures and PAIs. Then, these feature sets and their combinations were utilized, and the random forest method was applied to classify tree species and ascertain the importance of the features involved in the classification process. The experimental results demonstrate that all texture features play a crucial role in the identification of tree species, with eight features being selected. Additionally, numerous HSV features (WV-3: 29, WV-2: 21) and PAI features (WV-3: 7, WV-2: 4) also make significant contributions. However, the spectral bands did not show a notable positive impact, as none were selected. When compared with the use of single-type features, the integration of multiple features from WorldView-3/2 resulted in more effective tree species identification, achieving an overall accuracy of 90.45% for WV-3 and 84.60% for WV-2, surpassing the highest overall accuracy achieved by single-type features, which was 76.64% for WV-3 and 78.27% for WV-2. The experimental results indicate that multi-type features should be used for tree species classification. Additionally, the newly proposed PAI feature demonstrates a positive contribution and is recommended for active use in tree species classification.
Keywords: WorldView-3/2, four types of features, tree species identification, effectiveness evaluation, random forest
1. Introduction
The use of remote sensing methods for identifying tree species is currently a research hotspot, given its potential to overturn the longstanding reliance on manual fieldwork for tree species investigation. In tree species identification research using remote sensing methods, the spectral bands of remote sensing imagery, along with image features such as texture features, spectral indices and color space features derived from these spectral bands, exhibit characteristics that effectively capture the differences among tree species. Consequently, strategically integrating these diverse feature types has the potential to considerably enhance the accuracy of tree species identification. If it is feasible to clarify the effectiveness of various feature types and their combinations in remote sensing imagery for tree species identification, valuable insights can be gained from the selection and exclusion of image features in remote sensing-based tree species identification. Therefore, analyzing the utility of various image features in tree species identification holds significant value in enhancing the accuracy and effectiveness of remote sensing-based tree species identification.
In the realm of tree species identification using remote sensing techniques, a diverse array of data sources has proven invaluable. Among these, IKONOS, QuickBird, and WorldView-3/2 (WV-3/2) satellites provide high-resolution imagery, capturing intricate details of the tree canopy and underlying structures (Ghosh and Joshi 2014, Ferreira et al. 2019). Elevation data, obtained through various means such as lidar scanning, provide crucial information on tree heights, which is often a key factor in distinguishing between different species (Naidoo et al. 2012, Hamraz et al. 2019, Shi and Wang 2020). Additionally, the emergence of unmanned aerial vehicles has revolutionized data collection, enabling the capture of multispectral and hyperspectral data with unprecedented precision (Torabzadeh et al. 2019, Modzelewska et al. 2020). Hyperspectral data, in particular, offers a detailed spectral signature of trees, enabling the identification of subtle differences in leaf chemistry that can be used to classify different species (Zhang et al. 2016, Zhang et al. 2020). The combination of these diverse data sources, especially those incorporating high spatial resolution and tree height information, significantly enhances the accuracy and reliability of tree species classification (Richards and Jia 2008, Kureel et al. 2021).
Focusing on the use of image features in tree species identification, scholars extensively use various image feature types, including image layers of bands, spectral indices, textures, and digital surface models (DSMs) (Wang et al. 2016, Åkerblom et al. 2017, Yu et al. 2017). Beyond the conventional features, some researchers are also pioneering the development of novel image features that cater specifically to the needs of tree species classification (Zhou et al. 2011). My contribution lies in the development of a polygon area index (PAI) for tree species identification (Liu 2023a). This index is based on the observation that the area enclosed by each species’ spectral curve and the coordinate axes – where the horizontal and vertical axes represent wavelength and reflectance – differs among tree species. Feature layers derived from these area differences can effectively capture the distinctions among tree species. Both their efforts and mine aim to enrich the differentiated information in remote sensing images, capturing the intricacies of tree species from diverse perspectives (Zhou et al. 2011, Liu and An 2020a, Liu 2023a, Liu 2023b). According to research, texture features and DSMs have demonstrated significant potential in mapping tree species, often outperforming other types of features (Liu 2022, Liu 2024). Moreover, the incorporation of these innovative features, such as the PAI, has been shown to enhance the accuracy of tree species recognition (Zhou et al. 2011, Liu and An 2020a, Liu 2023a). The use of multi-source data and a vast array of image features in remote sensing imagery serves as a valuable asset in the identification of tree species (Cross et al. 2019, Apostol et al. 2020).
For the temporal phase selection of remote sensing images, the selection of the appropriate temporal phase for tree species classification is crucial. While numerous studies have relied solely on single-phase data for this purpose (Liu et al. 2015, Liu and An 2019), a growing number of scholars have advocated for the utilization of multi-phase data (Pu et al. 2018, Masemola et al. 2019, Shi et al. 2020, Liu 2022). This approach is grounded in the understanding that single-phase data sources often fall short in highlighting the phenological variations unique to different tree species within the imagery. By incorporating multi-temporal data, researchers are able to capture these phenological differences, which can substantially enhance the accuracy of tree species classification (Han et al. 2019, Immitzer et al. 2019, Liu 2024). Not only does this method compensate for the limitations of single-phase data, but it also provides a more comprehensive understanding of the temporal dynamics of tree species, leading to more informed and precise classification outcomes.
Previously, traditional classifiers such as maximum likelihood classifier (MLC), support vector machines (SVM), and random forests (RF) played a significant role in tree species classification (Lin et al. 2015, Modzelewska et al. 2020, Liu 2023a). MLC offers rapid speed and high accuracy in low-dimensional data, but it suffers from the Hughes phenomenon in higher dimensions (Ghosh and Joshi 2014, Liu 2024). SVM boasts high accuracy and resilience to feature dimensionality, albeit with a lengthy training time. Deep learning methods have shown promise in achieving high accuracy for tree species recognition, yet they also require considerable training time (Kemal et al. 2019, Carvalho et al. 2022, Kwon et al. 2023). Conversely, RF is not affected by feature dimensionality, possesses swift training speed, high classification accuracy, and the ability to rank feature importance. For multispectral data, the choice of classifier depends on the number and complexity of extracted image features. When the number of features is small, MLC may suffice, while for larger feature sets requiring faster processing, RF emerges as a preferred option.
From the literature review, it is evident that in tree species classification, apart from factors like data source, imaging time, and the choice of classifiers, scholars have also devoted significant attention to the selection of crucial image features. In previous studies, we identified the potential significance of hue, saturation, and value (HSV) as well as the newly introduced PAI, in tree species identification (Liu and An 2019, Liu 2023a). Given that texture features play a crucial role in tree species classification, and spectral bands serve as fundamental data for tree species recognition, I hypothesize that integrating these feature types could be invaluable for tree species identification. In this study, I employed HSVs, PAIs, texture features, spectral bands, and their combinations to classify tree species. My objective was to evaluate the effectiveness of these features in identifying tree species. This evaluation aims to clarify the performance of several key feature types in tree species identification. I intend to utilize WV-3/2 as the data source to extract HSVs, PAIs, and texture features. Subsequently, I combined these features with spectral bands to create various combined feature sets and high-dimensional mixed feature sets. I employed the RF classifier to assess the performance of different feature sets and rank the importance of the features within the mixed feature sets. The goal is to clarify the performance of different feature types in tree species identification and analyze the effect of their combinations on enhancing tree species identification. The research findings will provide foundational information for the adoption of robust features in tree species classification.
2. Materials and Methods
2.1 Study Area
The Botanical Garden, located within the ruins of the ancient Sui and Tang Dynasties cities in Luoyang, Henan Province, China, served as the primary experimental site for my study (Fig. 1). The geographical location, temperature patterns, and annual rainfall of Luoyang, as well as the area and tree species of the study site, were thoroughly described in my previous study (Liu 2023a). An area in Hohhot City, Inner Mongolia, China, previously selected by Liu and An (2020a) for their tree species identification research, served as a test site to further validate the reliability of the Luoyang experimental results.
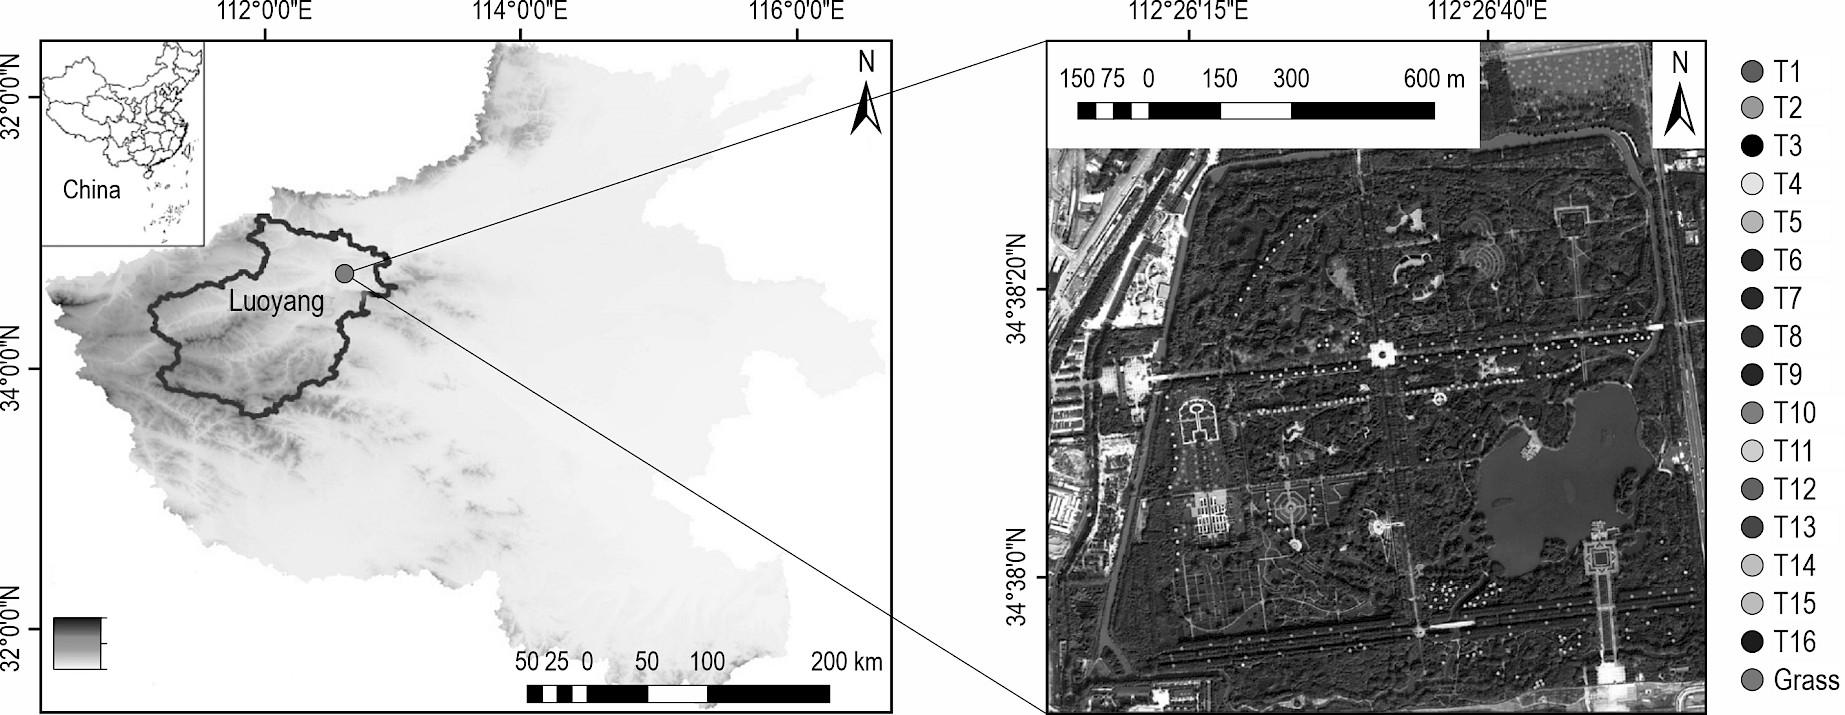
Fig. 1 Location map of the primary study area, along with an image of the study site, illustrating the distribution of samples across various tree species. T1–T16 represent 16 tree species, and the detailed scientific names of these species are shown in Table 2
2.2 Remote Sensing Data and Pre-Processing
The primary data source for this study was a WV-3 image of Luoyang, captured on October 27, 2017. This image comprised a panchromatic band with a spatial resolution of 0.3 m and an 8-band multispectral set with a spatial resolution of 1.24 m. The detailed parameters of the WV-3 data are outlined in Table 1. As for the auxiliary data from WV-2, its band settings and wavelength ranges for each band are identical to those of the WV-3. However, the spatial resolution differs, with the panchromatic band at 0.5 m and the multispectral bands at 2.0 m for WV-2.
Table 1 Band configuration and spatial resolution of WV-3 imagery
|
Band code |
Band settings |
Pixel resolution size, m |
Wavelength range, μm |
Central wavelength |
|
1 |
Coastal blue |
1.24 |
0.40–0.45 |
0.425 |
|
2 |
Blue |
0.45–0.51 |
0.480 |
|
|
3 |
Green |
0.51–0.58 |
0.545 |
|
|
4 |
Yellow |
0.59–0.63 |
0.605 |
|
|
5 |
Red |
0.63–0.69 |
0.660 |
|
|
6 |
Red edge |
0.71–0.75 |
0.725 |
|
|
7 |
Near-infrared 1 |
0.77–0.90 |
0.833 |
|
|
8 |
Near-infrared 2 |
0.86–1.04 |
0.950 |
|
|
9 |
Panchromatic |
0.3 |
0.45–0.80 |
– |
The WV-3 imagery encompassed a geographic area spanning latitudes 34˚37′49.51″–34˚38′35.48″ N and longitudes 112˚26′3.06″–112˚26′58.33″ E, covering a total area of 1.94 km2 (Liu 2023a). Conversely, the WV-2 imagery captured a different region, spanning latitudes 40˚48′11.81″–40˚48′47.62″ N and longitudes 111˚40′55.57″–111˚42′32.16″ E, with a total coverage of 2.45 km2 (Liu and An 2020a, Liu 2023a). Prior to utilization, both datasets underwent rigorous preprocessing steps, including calibration, image fusion, and atmospheric correction. Fig. 1 presents a visual representation of the primary study area along with its corresponding imagery.
2.3 Tree Species Investigation and Sample Collection
For the primary study site, a printed image was used for a field survey conducted in August 2020, revealing the potential of sixteen distinct tree species for classification (Liu 2023a). The approach for investigating tree species and labeling samples adhered to the methodology employed in our previous research in the auxiliary experimental area (Liu and An 2020a). In the main study site, the spatial distribution of these tree species and the selection of training and validation samples are detailed in the right portion of Fig. 1 and in Table 2, respectively. For the auxiliary experimental areas, details on the classified tree species and their sample collection are provided in our earlier study (Liu and An 2020a).
Table 2 Scientific names of the tree species for classification and the number of training and validation samples used in the classification
|
Tree species category |
Scientific names |
Training samples |
Validation samples |
|
T1 |
Sophora japonica |
284 |
5673 |
|
T2 |
Prunus cerasifera f. atropurpurea |
280 |
5609 |
|
T3 |
Salix babylonica |
277 |
5541 |
|
T4 |
Cedrus deodara |
297 |
5939 |
|
T5 |
Armeniaca mume var. mume f. alphandii |
287 |
5736 |
|
T6 |
Michelia champaca |
291 |
5811 |
|
T7 |
Sabina chinensis (L.) Ant. cv. Kaizuca |
279 |
5573 |
|
T8 |
Koelreuteria paniculata |
293 |
5854 |
|
T9 |
Eucommia ulmoides |
282 |
5648 |
|
T10 |
Bischofia polycarpa |
293 |
5861 |
|
T11 |
Pterocarya stenoptera |
292 |
5833 |
|
T12 |
Platanus orientalis |
286 |
5729 |
|
T13 |
Magnolia grandiflora |
285 |
5690 |
|
T14 |
Metasequoia glyptostroboides |
285 |
5695 |
|
T15 |
Fraxinus chinensis |
284 |
5685 |
|
T16 |
Phyllostachys sulphurea var. Viridis (bamboo) |
281 |
5623 |
|
Grass |
– |
283 |
5656 |
2.4 Construction of Non-Vegetation Mask
Previous research has demonstrated the ineffectiveness of the NDVI threshold method in distinguishing vegetation from blue-ground objects (Liu and An 2020b). To address this limitation, Liu and An (2020b) introduced the blue objects spectral index (BOSI) (Eq. 1), which highlights blue-ground objects in images. By setting an appropriate threshold, blue-ground objects can be accurately extracted. In the current study, I capitalized on this approach, referencing previous works (Liu and An 2020b, Liu 2023a), to construct a mask that excludes both blue-ground objects and non-vegetation areas. This mask was then applied to the images, covering non-vegetation areas, thereby minimizing their potential interference during tree species identification.

Where:
b1-6 and b8 correspond to the coastal blue, blue, green, yellow, red, red-edge, and near-infrared 2 bands of the spectral data, respectively.
2.5 Image Feature Set Construction
In implementing tree species classification with WV-3/2 imagery, I considered four key feature sets: (1) spectral bands (SB), (2) hue, saturation, and value (HSV) color space features (e.g., Liu and An 2019), (3) texture features (TEX) (e.g., Liu 2023a, Liu 2024), and (4) polygon area index (PAI) (Liu 2023a). The SB set was constructed from the 8-band data of the WV-3 imagery, consisting of eight spectral bands. The HSV feature set was created by randomly selecting three bands from the eight and transforming them from the RGB color space to the HSV color space. The resulting feature set contained a total of 56 HSV features (Liu and An 2019).
The TEX feature set was constructed using various texture metrics, including mean (MEA), homogeneity (HOM), variance (VAR), contrast (CON), entropy (ENT), dissimilarity (DIS), second moment (SM), and correlation (COR) (Liu et al. 2015, Liu 2022). All of these TEX features were extracted from the panchromatic band of the WV-3 imagery, comprising a total of eight distinct features. During texture extraction, I employed the co-occurrence metrics in ENVI 5.4. The processing window dimensions were varied in accordance with a gradient ranging from 5×5 to (N+2)×(N+2), where N represents the optimal window size that yields the highest overall accuracy in tree species classification over ((N+1)/2–1) iterations. Specifically, I set the co-occurrence shift values for both the X and Y axes to 1. Once the eight TEX features were extracted from a given window, they were promptly utilized for tree species classification using MLC. The resulting overall accuracy (OA) was recorded to facilitate the determination of the optimal window size for texture extraction.
The construction process for the first three types of feature sets is identical for both WV-2 and WV-3 imagery. To construct the PAI feature set, I used Eq. (2) from Liu (2023a). Starting from band 1 of WV-3/2, I calculated the PAIs between band 1 and all subsequent bands (bands 2 through 8). This process was repeated for each subsequent band, calculating the PAI between each band and all higher-numbered bands, until the PAI between bands 7 and 8 was computed. This resulted in a total of 28 PAIs for both the WV-3 and WV-2 imagery.

Where:
PAI represents the polygon area index
N is the number of bands; α = 1, 2, ..., N–1
β = α + 1; bα represents the reflectance of the pixels in band
α, bβ represents the reflectance of the pixels in band
α + 1 bγ represents the band of tree species with the lowest reflectance in the α to β band
Δλαβ represents the difference between the central wavelengths of the β and α bands.
2.6 Image Classification and Results Evaluation
Based on the above-constructed four types of feature sets and their combinations, the RF algorithm (Van der Linden et al. 2015) was used to identify tree species due to its excellent performance in both low-dimensional and high-dimensional feature sets for image classification. Within the mixed feature set (including 212 features), which comprises four distinct types of feature sets, all features were ranked based on their normalized importance values. These values were calculated using the variable importance measure tool provided by RF, ensuring an objective and quantitative assessment of each feature's contribution. Optimal feature sets were identified by gradually eliminating the least important features while monitoring the classification accuracy after feature elimination, initially in groups of five, and then individually. After the classification of tree species, the validation samples served as benchmarks to evaluate the entire classification output, resulting in a confusion matrix for precision assessment. I utilized the OA, Kappa coefficient (KC), producer and user accuracy derived from this matrix, along with curve diagrams and spider graphs constructed from select metrics, to compare and analyze the nuances of the classification outcomes.
3. Results and Analyses
3.1 Optimal Window for Texture Extraction
Fig. 2 depicts the curves illustrating the relationship between the window size for texture feature extraction and the OA of tree species classification for the current window size.
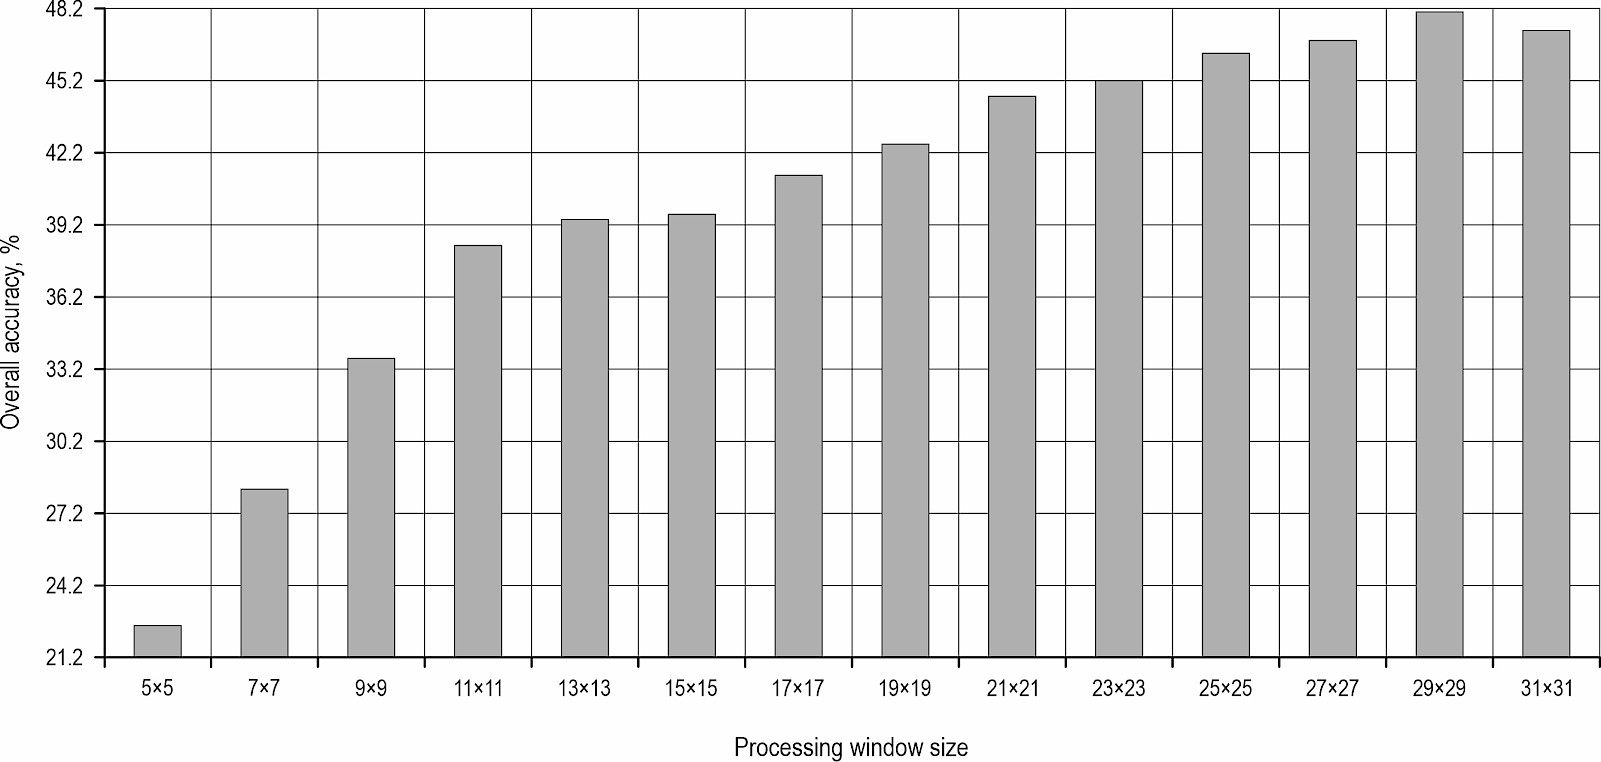
Fig. 2 Determination of the optimal window size for texture feature extraction. Change in OA with varying window sizes for eight types of texture extraction in WV-3 panchromatic band. The OA of tree species classification initially increases with window size, peaking at 29×29 before declining, indicating the existence of an optimal scale for capturing textural information
As depicted in Fig. 2, the OA of tree species identification progressively increased in tandem with the expansion of the texture feature extraction window. Specifically, a window size of 29×29 (for WV-3) and 9×9 (for WV-2) resulted in the peak OA for tree species classification. However, any further increase in the window size to 31×31 (for WV-3) and 11×11 (for WV-2) led to a decrease in OA. Consequently, the texture features extracted using the optimal window size of 29×29 (or 9×9) were used in the subsequent analysis for tree species classification.
3.2 Tree Species Classification by Different Feature Sets
Table 3 summarizes the OA and KC of different feature types and their combinations for tree species identification.
Table 3 Overall accuracy and KC achieved in tree species classification based on various feature sets
|
Feature sets |
WV-3 |
WV-2 |
||
|
OA, % |
KC |
OA % |
KC |
|
|
8 SBs |
65.87 |
0.6374 |
76.78 |
0.7289 |
|
28 PAIs |
70.61 |
0.6877 |
76.44 |
0.7248 |
|
56 HSVs |
75.76 |
0.7424 |
78.27 |
0.7463 |
|
8 TEXs |
76.64 |
0.7518 |
70.91 |
0.6598 |
|
8 SBs+28 PAIs |
73.53 |
0.7188 |
78.74 |
0.7517 |
|
8 SBs+56 HSVs |
75.74 |
0.7422 |
78.08 |
0.7441 |
|
8 SBs+8 TEXs |
86.10 |
0.8523 |
82.70 |
0.7978 |
|
28 PAIs+56 HSVs |
76.24 |
0.7475 |
78.21 |
0.7456 |
|
28 PAIs+8 TEXs |
89.49 |
0.8883 |
83.33 |
0.8052 |
|
56 HSVs+8 TEXs |
87.86 |
0.8710 |
82.73 |
0.7982 |
|
8 SBs+28 PAIs+56 HSVs |
76.19 |
0.7470 |
78.43 |
0.7482 |
|
8 SBs+28 PAIs+8 TEXs |
89.40 |
0.8874 |
83.80 |
0.8107 |
|
8 SBs+56 HSVs+8 TEXs |
88.02 |
0.8727 |
82.89 |
0.8000 |
|
28 PAIs+56 HSVs+8 TEXs |
87.87 |
0.8711 |
83.06 |
0.8021 |
|
8 SBs+28 PAIs+56 HSVs+8 TEXs |
88.12 |
0.8738 |
82.73 |
0.7982 |
As shown in Table 3, the texture feature set yielded the highest classification accuracy for tree species based on WV-3 single-type features, followed by the HSV feature set, PAI feature set, and spectral band set, in that order. However, for WV-2, the HSV feature set attained the highest recognition accuracy, surpassing the spectral bands, PAI feature set, and texture feature set, in that order. Notably, the effectiveness of these feature sets in classifying tree species across different images remains unclear based solely on these results.
In the identification of tree species using combinations of two feature sets, the texture feature set combined with spectral bands, PAI, and HSV sets achieved high accuracy, ranging from 86.10% to 89.49% for WV-3 and 82.70% to 83.33% for WV-2. Specifically, the combination of the texture and PAI feature sets yielded the highest accuracy, achieving 89.49% for WV-3 and 83.33% for WV-2. Conversely, the combinations of spectral bands with PAIs, HSVs, and PAI combined with HSV feature sets did not significantly enhance the classification accuracy.
In tree species identification, the combination of three types of feature sets did not yield any further improvement in accuracy compared to the combinations of two or fewer feature sets. Moreover, when combining all four types of feature sets for tree species classification, the OA declined slightly to 88.12% for WV-3 and 82.73% for WV-2, compared to the optimal results achieved with fewer feature sets (89.49% for WV-3 and 83.80% for WV-2).
3.3 Key Features for Tree Species Identification
Utilizing the RF algorithm, I ranked the importance of all features in the mixed feature set for WV-3, highlighting the top 100 in Table 4. Then, I conducted tree species classification using these top 100 features, eliminating sets of 5 features in descending order of importance. Fig. 3(a) depicts the changes in OA as features are sequentially removed in increments of 5, while Fig. 3(b) zooms in on the OA variation for each individual feature that is eliminated, based on the optimal interval determined at every 5-feature elimination step.
Table 4 The top 100 most important features for WV-3 tree species classification as ranked by the random forest classifier. The dominance of texture features (e.g., VAR, MEA, DIS) in the highest ranks and the significant presence of HSV features (prefix »H«, »S«, »V«) underscore their critical role, while the absence of spectral bands (SB) until rank 100 highlights their relative inferiority
|
Feature |
Importance value |
Ranking |
Feature |
Importance value |
Ranking |
Feature |
Importance value |
Importance ranking |
Feature |
Importance value |
Ranking |
|
VAR |
1.66 |
1 |
V 237 |
0.78 |
26 |
PAI 4 to 5 |
0.66 |
51 |
H 246 |
0.56 |
76 |
|
MEA |
1.52 |
2 |
PAI 6 to 7 |
0.77 |
27 |
S 123 |
0.66 |
52 |
H 235 |
0.56 |
77 |
|
DIS |
1.51 |
3 |
H 578 |
0.77 |
28 |
H 367 |
0.65 |
53 |
H 127 |
0.56 |
78 |
|
HOM |
1.49 |
4 |
H 368 |
0.77 |
29 |
H 148 |
0.65 |
54 |
S 568 |
0.55 |
79 |
|
CON |
1.48 |
5 |
H 257 |
0.77 |
30 |
H 457 |
0.64 |
55 |
S 346 |
0.54 |
80 |
|
ENT |
1.38 |
6 |
S 245 |
0.77 |
31 |
H 567 |
0.63 |
56 |
S 136 |
0.54 |
81 |
|
SM |
1.38 |
7 |
H 356 |
0.76 |
32 |
S 235 |
0.63 |
57 |
H 135 |
0.54 |
82 |
|
COR |
1.19 |
8 |
PAI 6 to 8 |
0.75 |
33 |
H 157 |
0.63 |
58 |
S 368 |
0.53 |
83 |
|
H 678 |
0.95 |
9 |
PAI 2 to 5 |
0.74 |
34 |
H 126 |
0.63 |
59 |
V 348 |
0.53 |
84 |
|
H 478 |
0.95 |
10 |
H 237 |
0.73 |
35 |
S 345 |
0.62 |
60 |
H 147 |
0.53 |
85 |
|
PAI 1 to 5 |
0.87 |
11 |
H 238 |
0.72 |
36 |
H 167 |
0.62 |
61 |
PAI 4 to 8 |
0.52 |
86 |
|
H 378 |
0.87 |
12 |
PAI 3 to 5 |
0.70 |
37 |
H 467 |
0.61 |
62 |
S 146 |
0.52 |
87 |
|
H 267 |
0.87 |
13 |
PAI 2 to 4 |
0.70 |
38 |
S 456 |
0.61 |
63 |
PAI 2 to 7 |
0.51 |
88 |
|
H 258 |
0.87 |
14 |
H 456 |
0.70 |
39 |
H 247 |
0.61 |
64 |
S 467 |
0.51 |
89 |
|
H 357 |
0.86 |
15 |
H 256 |
0.70 |
40 |
S 234 |
0.61 |
65 |
PAI 2 to 6 |
0.50 |
90 |
|
H 348 |
0.86 |
16 |
S 145 |
0.70 |
41 |
S 124 |
0.61 |
66 |
S 478 |
0.50 |
91 |
|
H 268 |
0.86 |
17 |
S 135 |
0.70 |
42 |
H 146 |
0.6 |
67 |
S 358 |
0.50 |
92 |
|
PAI 7 to 8 |
0.84 |
18 |
H 156 |
0.69 |
43 |
H 568 |
0.59 |
68 |
S 356 |
0.50 |
93 |
|
H 358 |
0.84 |
19 |
H 136 |
0.69 |
44 |
H 458 |
0.58 |
69 |
S 267 |
0.50 |
94 |
|
H 178 |
0.84 |
20 |
PAI 2 to 3 |
0.68 |
45 |
S 458 |
0.58 |
70 |
S 257 |
0.50 |
95 |
|
H 168 |
0.84 |
21 |
PAI 1 to 6 |
0.68 |
46 |
H 128 |
0.58 |
71 |
S 178 |
0.50 |
96 |
|
S 125 |
0.80 |
22 |
PAI 1 to 3 |
0.68 |
47 |
S 367 |
0.57 |
72 |
S 156 |
0.50 |
97 |
|
S 678 |
0.78 |
23 |
H 236 |
0.68 |
48 |
S 457 |
0.56 |
73 |
S 137 |
0.50 |
98 |
|
H 468 |
0.78 |
24 |
S 134 |
0.68 |
49 |
S 378 |
0.56 |
74 |
S 128 |
0.50 |
99 |
|
H 278 |
0.78 |
25 |
H 347 |
0.67 |
50 |
H 346 |
0.56 |
75 |
SB 5 |
0.49 |
100 |
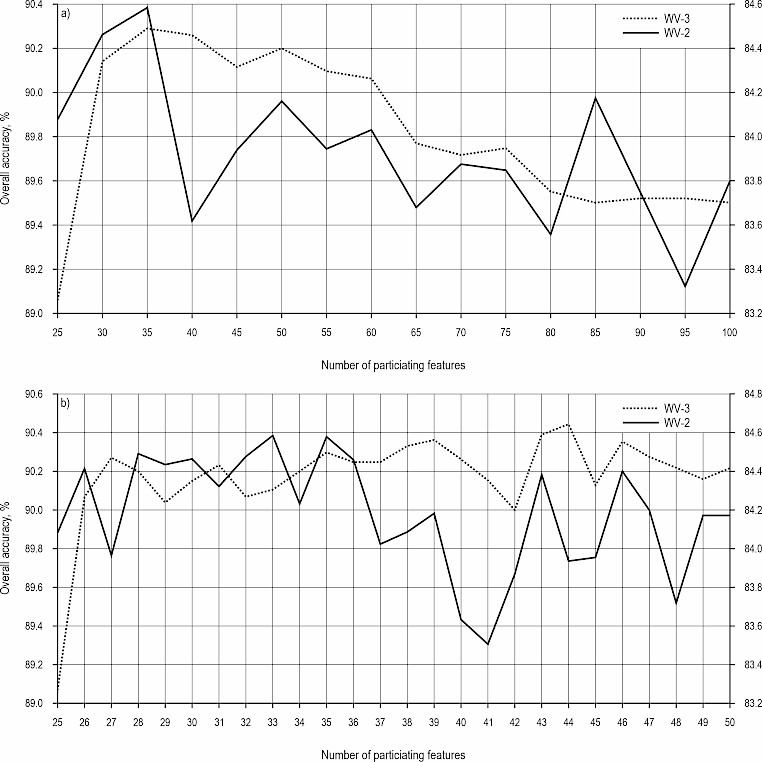
Fig. 3 Identification of the optimal feature set through backward feature elimination. (a) The OA achieved in tree species identification by the latest feature set after removing every five lowest-ranked features (from ranks 25 to 100). The OA peaks when the top ~35 most important features are used, demonstrating that a compact, discriminative feature subset exists; (b) the OA achieved in tree species identification by the latest feature set after removing every one of the lowest-ranked features (from ranks 25 to 50). Fine-tuning reveals the exact optimal number of features (44 for WV-3, 33 for WV-2), beyond which the removal of any more important features causes a performance drop. The left and right vertical axes in the figure represent the classification accuracy for WV-3 and WV-2, respectively
As shown in Fig. 3(a), as lower-ranked features were eliminated, the OA for tree species classification generally increased, peaking at the top 35 features. Subsequent removal of more important features led to a decline in the OA, suggesting that the optimal feature set for tree species identification consists of approximately 35 of the top 100 features.
Beginning with the 35th most important feature, I expanded the potential optimal feature set by including the top 50 features in descending order of importance. Among these top 50 features, I eliminated the less important ones one by one. Experimental results revealed that using the top 44 features (33 for WV-2) for tree species classification yielded the highest OA, thus constituting the optimal feature set.
Based on Table 4 and the experimental results for WV-2, among the optimal feature sets for tree species classification (top 44 for WV-3, 33 for WV-2), all eight texture features were selected, primarily at the forefront, accounting for 18.20% (24.24% for WV-2). Additionally, 7 (4 for WV-2) PAI features were selected, representing 15.91% (12.12% for WV-2) of the total. Most prominently, 29 (21 for WV-2) HSV features were selected, comprising 65.91% (63.64% for WV-2) of the optimal set. Notably, no spectral bands were selected in either case.
3.4 Tree Species Identification Comparison of Typical Data Sets
Taking WV-3 as an example, Fig. 4 (a) and (b) display the producer and user accuracy spider web graphs, respectively, generated using the optimal feature set, 8 TEXs, 56 HSVs, 28 PAIs, and 8 spectral bands. Fig. 5 depicts the tree species identification results achieved with these representative feature sets.
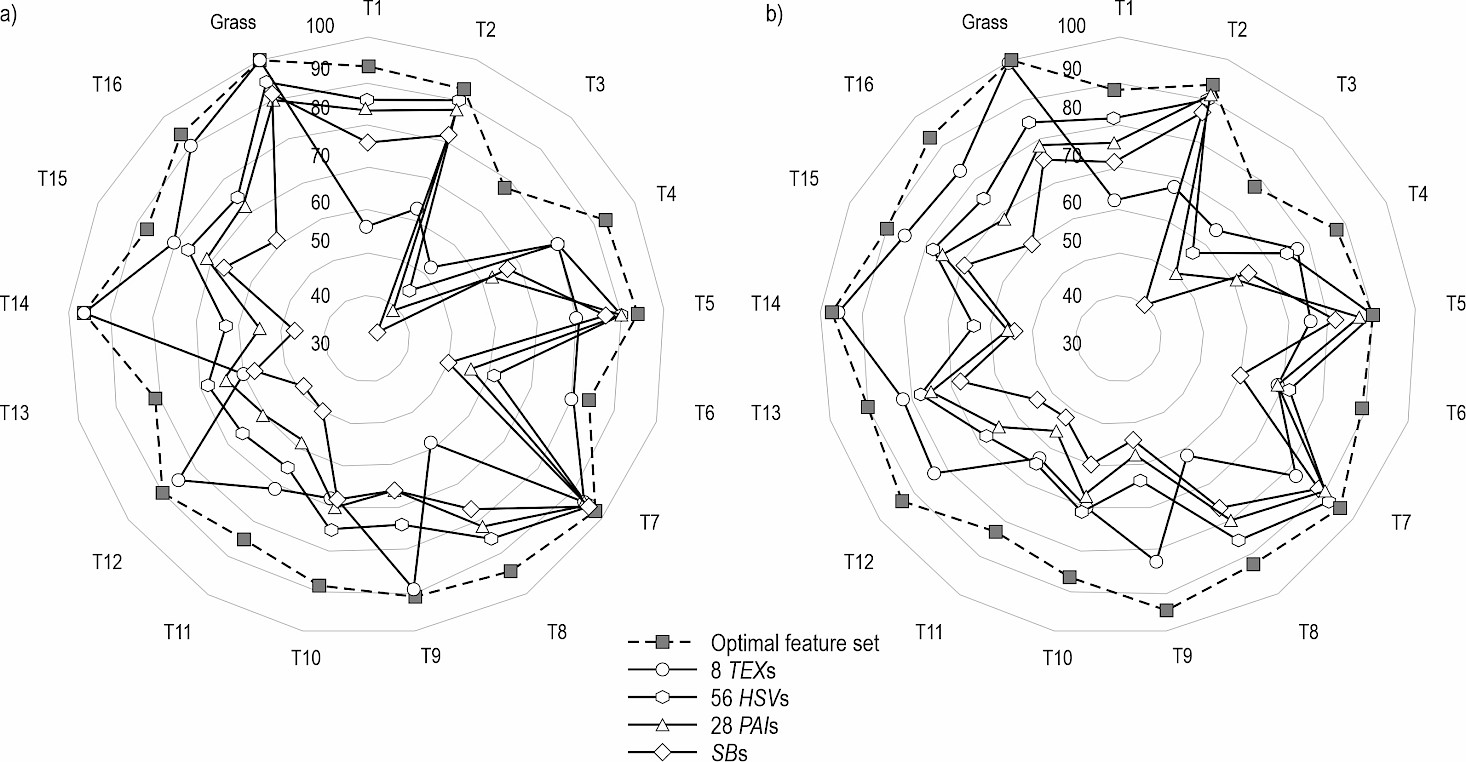
Fig. 4 Comparative performance of different feature sets for individual species: Spider web graphs of (a) producer accuracy and (b) user accuracy show that the optimal feature set (dash line) consistently achieves high and balanced accuracy across most tree species, whereas single-type feature sets (e.g., TEXs, HSVs) exhibit high variability and species-specific strengths and weaknesses
As depicted in Fig. 4, for the recognition of T14, the producer accuracy of the optimal feature set was slightly lower than that achieved using only 8 TEX features. Similarly, for grass recognition, the user accuracy was also slightly lower compared to using 8 TEX features. However, when identifying any tree species or grass, the producer and user accuracy of the optimal feature set outperformed those of the other four single-type feature sets. Among the various feature sets, different combinations exhibited varying reco gnition effects for the same tree species, resulting in significant differences in both producer and user accuracyfor tree species identification.
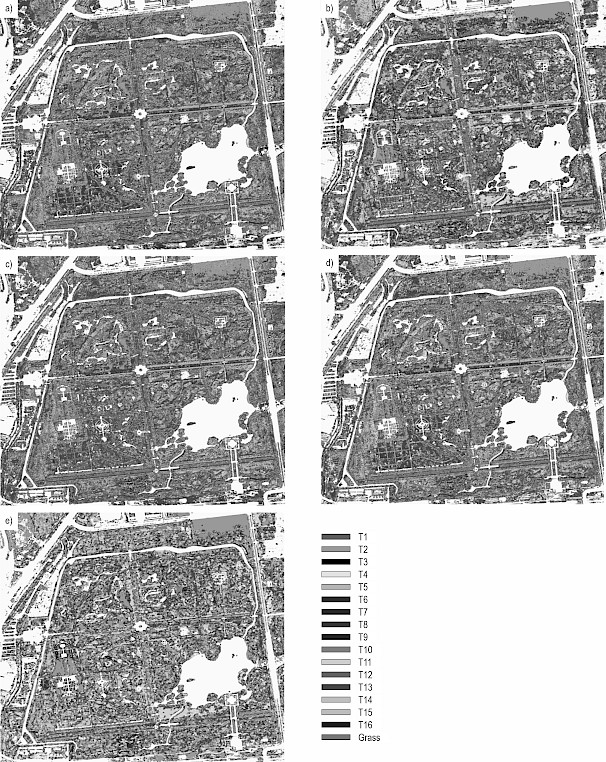
Fig. 5 Visual comparison of classification results using different feature sets. (a) Spectral bands alone result in a noisy and speckled output. (b) The optimal feature set produces a spatially coherent and homogeneous map, closely resembling the expected distribution of tree stands. (c–e) Classification maps from single-type features (28 PAIs, 56 HSVs, and 8 TEXs, respectively) show intermediate levels of noise and misclassification, highlighting the superiority of the multi-feature approach
By combining the information from Figs. 4 and 5, it is evident that in the identification of tree species using single-class feature sets, the recognition performance of 8 TEX features for tree species T1, T2, T5, and T8 was significantly inferior compared to that of other feature sets. However, for tree species T6, T9, T11, T12, T14, and T16, the recognition performance of 8 TEX eatures was notably superior to that of the other feature sets. The 56 HSV features demonstrated better recognition effects for most tree species compared to 28 PAI features and eight spectral bands. Specifically, 28 PAI features excelled in the recognition of T5 and T7, outperforming the other feature sets. The optimal feature set, by effectively integrating the strengths of each feature group, achieved excellent recognition results across all tree species and grasses.
3.5 The Optimal Classification Result Analysis
Utilizing the optimal WV-3 feature set, comprising 44 features, for the classification of tree species and grass, the resulting confusion matrix is presented in Table 5, and the corresponding classification map is depicted in Fig. 5(b).
Table 5 Confusion matrix for classification using the optimal feature set (44 features) with WV-3 imagery. The model achieves an excellent OA of 90.45%, with most tree species attaining both producer and user accuracy above 85%
|
Type |
T1 |
T2 |
T3 |
T4 |
T5 |
T6 |
T7 |
T8 |
T9 |
T10 |
T11 |
T12 |
T13 |
T14 |
T15 |
T16 |
Grass |
|
T1 |
5304 |
0 |
130 |
21 |
0 |
30 |
2 |
0 |
3 |
0 |
34 |
60 |
45 |
6 |
334 |
30 |
0 |
|
T2 |
0 |
5193 |
0 |
5 |
307 |
0 |
11 |
15 |
0 |
0 |
1 |
0 |
2 |
0 |
0 |
0 |
0 |
|
T3 |
61 |
0 |
4316 |
136 |
0 |
228 |
6 |
60 |
9 |
80 |
127 |
43 |
307 |
20 |
93 |
41 |
1 |
|
T4 |
21 |
0 |
235 |
5483 |
0 |
59 |
76 |
0 |
77 |
0 |
53 |
30 |
74 |
96 |
21 |
27 |
0 |
|
T5 |
0 |
387 |
0 |
1 |
5357 |
11 |
23 |
58 |
0 |
0 |
2 |
2 |
0 |
0 |
0 |
0 |
0 |
|
T6 |
31 |
0 |
156 |
3 |
0 |
4876 |
1 |
15 |
0 |
0 |
1 |
191 |
61 |
32 |
77 |
1 |
0 |
|
T7 |
28 |
0 |
86 |
66 |
1 |
1 |
5383 |
7 |
40 |
0 |
0 |
0 |
11 |
0 |
0 |
0 |
0 |
|
T8 |
1 |
14 |
20 |
0 |
70 |
164 |
39 |
5485 |
1 |
19 |
46 |
39 |
55 |
1 |
1 |
0 |
27 |
|
T9 |
13 |
14 |
19 |
54 |
1 |
0 |
23 |
0 |
5158 |
68 |
43 |
29 |
16 |
0 |
0 |
16 |
0 |
|
T10 |
0 |
1 |
119 |
0 |
0 |
3 |
0 |
165 |
31 |
5215 |
316 |
2 |
130 |
0 |
7 |
49 |
0 |
|
T11 |
5 |
0 |
157 |
62 |
0 |
36 |
0 |
39 |
251 |
295 |
4960 |
9 |
108 |
0 |
30 |
43 |
0 |
|
T12 |
68 |
0 |
35 |
1 |
0 |
160 |
0 |
0 |
6 |
0 |
10 |
5151 |
2 |
23 |
136 |
4 |
0 |
|
T13 |
5 |
0 |
63 |
47 |
0 |
44 |
9 |
3 |
35 |
162 |
139 |
0 |
4626 |
12 |
4 |
73 |
0 |
|
T14 |
0 |
0 |
4 |
50 |
0 |
75 |
0 |
0 |
0 |
0 |
0 |
22 |
74 |
5466 |
6 |
19 |
0 |
|
T15 |
136 |
0 |
145 |
5 |
0 |
109 |
0 |
2 |
0 |
0 |
3 |
151 |
55 |
39 |
4965 |
6 |
2 |
|
T16 |
0 |
0 |
56 |
5 |
0 |
15 |
0 |
0 |
37 |
22 |
98 |
0 |
124 |
0 |
11 |
5314 |
0 |
|
Grass |
0 |
0 |
0 |
0 |
0 |
0 |
0 |
5 |
0 |
0 |
0 |
0 |
0 |
0 |
0 |
0 |
5626 |
|
Row total |
5999 |
5534 |
5528 |
6252 |
5841 |
5445 |
5623 |
5982 |
5454 |
6038 |
5995 |
5596 |
5222 |
5716 |
5618 |
5682 |
5631 |
|
Column total |
5673 |
5609 |
5541 |
5939 |
5736 |
5811 |
5573 |
5854 |
5648 |
5861 |
5833 |
5729 |
5690 |
5695 |
5685 |
5623 |
5656 |
|
User accuracy, % |
88.41 |
93.84 |
78.08 |
87.70 |
91.71 |
89.55 |
95.73 |
91.69 |
94.57 |
86.37 |
82.74 |
92.05 |
88.59 |
95.63 |
88.38 |
93.52 |
99.91 |
|
Producer accuracy, % |
93.50 |
92.58 |
77.89 |
92.32 |
93.39 |
83.91 |
96.59 |
93.70 |
91.32 |
88.98 |
85.03 |
89.91 |
81.30 |
95.98 |
87.34 |
94.50 |
99.47 |
OA = 87878/97156 = 90.45%; KC = 0.8985.
From Table 5, it is evident that the producer accuracy for the classification of 16 tree species/bamboo and grass using the optimal feature set ranged from 77.89% (T3) to 99.47% (grass). Notably, 14 of these tree species/grass achieved producer accuracy exceeding 85%. Similarly, the user accuracy ranged from 78.08% (T3) to 99.91% (grass), with 15 tree species/bamboo and grass having user accuracy surpassing 85%. Specifically, the producer accuracy and user accuracy for tree species T3 were closely aligned, yet significantly lower than those of the other tree species/grass. For the remaining species, the difference between producer and user accuracy was relatively minor.
4. Discussion
The accuracy of tree species classification was constrained when relying solely on WV-3/2 single-type features (Table 3). Nevertheless, the discovery of new features, such as PAI, and the integration of multiple feature types, offer promising avenues for improving tree species identification (Table 5). Experimental results reveal that texture, HSV, and PAI features constitute a significant portion of the top 100 and optimal feature sets, with relatively high rankings. This underscores their positive contribution to tree species classification and identifies them as the primary drivers of accurate recognition (Table 4). Conversely, the highest-ranked spectral band only attained the 100th position in the mixed feature set, and no spectral bands were included in the optimal set. This suggests that spectral bands played a less crucial role compared to the other three feature types in tree species classification.
Using the optimal feature set for tree species recognition, texture features emerged as a crucial factor, with eight types of textures ranking highly. This underscores the significant role texture plays in tree species classification, aligning with findings from numerous contemporary studies (e.g., Pu and Landry 2012, Liu et al. 2015). Notably, this research further validates the vital importance of HSV in tree species classification. Prior to this, our previous work using WV-2 data had already established HSV's positive contribution (Liu and An 2019), but this is the first comprehensive evidence, beyond our own studies, demonstrating HSV's significant role. In the optimal feature set, HSV features comprised a total of 29 instances (21 for WV-2), with Hue, Sat, and Val accounting for 23 (18), 5 (3), and 1 (0), respectively. The preponderance of Hue features suggests that they have the greatest impact on tree species identification, likely due to the distinctive leaf tones among various species. Furthermore, the varying degrees of color saturation exhibited by different tree leaves provide a compelling explanation for how Sat features contribute to tree species recognition.
A detailed examination of the confusion matrix (Table 5) reveals significant variations in classification accuracy among the sixteen tree species. This disparity can be attributed to a combination of ecological traits and their manifestations in remote sensing data. Species with distinct structural characteristics, such as T7 and T14, which have unique, easily identifiable crown shapes and textures (columnar and conical, respectively), were classified with high accuracy (Producer accuracy: 96.59% and 95.98%). Their distinct textural signatures, effectively captured by the TEX features, made them spectrally and spatially separable from others. Conversely, species that were prone to misclassification, such as T3, likely share similar spectral and structural properties with other species. For instance, T3 was most frequently confused with T13 and T1. This confusion may stem from overlapping canopy structures and leaf morphologies that result in analogous texture responses, as well as potentially similar leaf biochemical properties leading to convergent spectral signatures in the WV-3 bands. The fact that these species were all classified within the same botanical garden under identical environmental conditions further suggests that their intrinsic spectral-structural similarity is the primary challenge. Furthermore, the exceptional accuracy in distinguishing grass from all tree species (PA>99.5%) underscores the model's proficiency in separating vegetation classes with fundamentally different life forms and canopy characteristics. This analysis indicates that future classification strategies can be improved by pre-identifying and focusing on such »confusion species groups«. For these groups, incorporating more targeted features, such as those derived from phenological changes (using multi-temporal imagery) or from higher-fidelity spectral data, may be necessary to resolve the ambiguity.
This research further validates the positive role played by the newly developed PAI in the identification of tree species (Tables 3 and 4). While previous studies (Liu 2023a) have assessed the significance of PAIs in tree species classification, the scope of the compared features was relatively narrow, focusing primarily on spectral bands and texture. Notably, the performance of texture features was hindered due to their extraction using a 3×3 window and the utilization of only a single type of texture feature, »mean«. In contrast, the current study comprehensively evaluates four diverse feature types: PAI, spectral bands, texture, and HSV, all of which are widely utilized in tree species identification (Wang et al. 2016, Liu and An 2019). Furthermore, eight distinct types of texture features were extracted using an optimized window size. Despite the inclusion of these additional important features, PAIs remain a crucial component of the optimal feature set, reaffirming their capability to enhance the accuracy of tree species identification. The fact that 7 (4 for WV-2) PAI features were selected for the optimal 44-feature (33-feature for WV-2) set (Table 4), accounting for 15.91% (12.12% for WV-2) of its composition, is particularly noteworthy. This demonstrates that PAI provides unique and complementary information not fully captured by other, more established features. The behavior of the PAI can be elucidated by considering its formulation. Unlike spectral bands, which measure reflectance at discrete wavelengths, or HSV, which transforms color space, the PAI captures the shape of the spectral curve between two bands. For instance, PAI 1 to 5 (ranking 11th in importance) calculates the area between the Coastal Blue and Red bands. A large area in this region of the spectrum might indicate a species with a steeper slope in the blue-to-green transition, a characteristic that could be linked to specific leaf pigments or structures. This allows PAI to differentiate species that might have similar reflectance in a few bands but different overall spectral shapes. A specific example from my results supports this: the strong performance of PAI features likely contributed to the accurate discrimination of T5 and T7, species for which the 28 PAIs alone showed notable proficiency (Fig. 4), suggesting that their spectral curves have distinctive polygon areas that set them apart from other species. Its integration with texture features, in particular, yielded one of the highest accuracies among two-feature set combinations (89.49% for WV-3, 83.33% for WV-2, Table 3). This synergy suggests that PAI (capturing spectral curve morphology) and texture (capturing spatial patterns) describe orthogonal and complementary aspects of tree species characteristics, making their combination exceptionally powerful.
In this study, a mixed feature set comprising four types of textures totaled 212 features. When using this mixed feature set for tree species classification, the OA was only 88.12% (82.73% for WV-2) (Table 3). However, after undergoing a rigorous feature selection process, an optimal feature set was identified, containing only 44 features (33 for WV-2) (Fig. 3). Remarkably, when using this reduced but effective set of features, the accuracy of tree species classification increased to 90.45% (84.60% for WV-2) (Table 5), indicating the significant impact of feature selection. By employing fewer but targeted features, not only did I achieve higher classification accuracy, but I also reduced the computational burden, a crucial consideration when dealing with high-dimensional datasets for tree species classification.
While this study demonstrates the effectiveness of the multi-feature combination and the utility of PAI and HSV features in tree species classification using WorldView-2/3 imagery, it is important to acknowledge its limitations regarding the sensors, as well as the spatial and temporal representativeness of the datasets. Regarding the sensors, my methodology and conclusions are based primarily on WorldView-2/3 imagery. The high spatial and spectral resolution of these sensors is crucial for extracting the texture and PAI features that proved to be highly important. The performance might vary if applied to data from other satellites (e.g., Sentinel-2 or Landsat-8/9) with different band settings, spatial resolutions, and radiometric characteristics, which could affect the importance of HSV and PAI features, as well as textures. Regarding the spatial and temporal representativeness, my validation was conducted in two specific geographical locations (Luoyang and Hohhot) during a particular season (primarily autumn for the main site). The effectiveness of the features, especially those related to color (HSV) and phenology (which influences spectral curves and thus PAI), might vary across different climatic zones, forest ecosystems, and seasons. Therefore, the distinct hues that proved to be highly important in my study might be less discernible among tree species in a tropical rainforest or during the lush summer canopy. Therefore, the current conclusions about feature importance are most directly applicable to temperate urban botanical gardens with similar species composition and imaging conditions. The robustness of the proposed optimal feature set under different sensor configurations, environmental conditions, and across multiple growing seasons remains to be verified. Given the limitations of the current study, future work will focus on evaluating the approach with a wider range of datasets from various seasons and regions to further assess the contribution of features, particularly HSV and PAI, to tree species classification.
5. Conclusions
The effectiveness of the newly developed PAIs, when combined with spectral bands, HSVs, and texture features was tested for tree species identification. This study also determined the importance of different features in tree species identification. To achieve the results, WV-3/2 data were used to construct spectral band sets, PAI sets, HSV sets and texture feature sets, along with several mixed feature sets derived from them. Subsequently, the RF classifier was used to classify tree species based on the various feature sets and assess the importance of these features involved in the classifications. The experimental results led to the following conclusions:
- compared to single-type features, the combination of multiple feature types from remote sensing data outperforms them in effectively identifying tree species
- texture features play a crucial role in tree species identification, and numerous HSV features were also significantly important. However, the positive impact of spectral band features, by contrast, was not as pronounced
- notably, many PAI features were part of the optimal feature sets for tree species recognition, indicating that the newly developed PAI features were also highly significant in tree species classification.
The experimental results indicate that combining multiple features of remote sensing data for tree species classification improves identification accuracy. Specifically, HSV features and the newly proposed PAI features should be given high consideration in subsequent studies for tree species classification. Furthermore, additional research is needed to determine which bands of remote sensing data yield the most beneficial HSV and PAI features for tree species classification, enabling their direct application in practical settings and future research. Moreover, to fully establish the robustness and generalizability of these findings, future studies should validate the proposed feature selection and classification framework across diverse sensors, geographic regions, forest types, and seasonal conditions.
Acknowledgements
Funding: This work was supported by the Scientific and Technological Project of Henan Province, China (Grant Nos. 262102320247, 242102310027), and the National Natural Science Foundation of China (Grant No. 32001250). I want to express my gratitude to the editors and the anonymous reviewers.
6. References
Åkerblom, M., Raumonen, P., Mäkipää, R., Kaasalainen., M., 2017: Automatic tree species recognition with quantitative structure models. Eur. J. For. Res. 191: 1–12. https://doi.org/10.1016/j.rse.2016.12.002
Apostol, B., Petrila, M., Lorenţ, A., Ciceu, A., Gancz, V., Badea, O., 2020: Species discrimination and individual tree detection for predicting main dendrometric characteristics in mixed temperate forests by use of airborne laser scanning and ultra-high-resolution imagery. Sci. Total Environ. 698: 134074. https://doi.org/10.1016/j.scitotenv.2019.134074
Carvalho, M.D., Marcato, J., Martins, J.A.C., Zamboni, P., Costa, C.S., Siqueira, H.L., Araújo, M.S., Gonçalves, D.N., Furuya, D.E.G., Osco, L.P., Ramos, A.P.M., Li, J., Castro, A.A.D., Gonçalves, W.N., 2022: A deep learning-based mobile application for tree species mapping in RGB images. Int. J. Appl. Earth Obs. Geoinf. 114: 103045. https://doi.org/10.1016/j.jag.2022.103045
Cross, M.D., Scambos, T., Pacifici, F., Marshall, W.E., 2019: Determining effective meter-scale image data and spectral vegetation indices for tropical forest tree species differentiation. IEEE J. Sel. Top. Appl. Earth Obs. Remote Sens. 12(8): 2934–2943. https://doi.org/ 10.1109/JSTARS.2019.2918487
Ferreira, M.P., Wagner, F.H., Aragão, L.E.O.C., Shimabukuro, Y.E., Filho, C.R.D.S., 2019: Tree species classification in tropical forests using visible to shortwave infrared WorldView-3 images and texture analysis. ISPRS J. Photogramm. Remote Sens. 149: 119–131. https://doi.org/10.1016/j.isprsjprs.2019.01.019
Ghosh, A., Joshi, P.K., 2014: A comparison of selected classification algorithms for mapping bamboo patches in lower Gangetic plains using very high resolution WorldView-2 imagery. Int. J. Appl. Earth Obs. Geoinf. 26(1): 298–311. https://doi.org/10.1016/j.jag.2013.08.011
Hamraz, H., Jacobs, N.B., Contreras, M.A, Clark, C., 2019: Deep learning for conifer/deciduous classification of airborne LiDAR 3D point clouds representing individual trees. ISPRS J. Photogramm. Remote Sens. 158: 219–230. https://doi.org/10.1016/j.isprsjprs.2019.10.011
Han, W., Zhang, S., Jiao, Q., Wu, H., 2019: Dominant tree species mapping based on multi-temporal CHRIS hyperspectral satellite data. Forest Inventory and Planning 44(2): 1–6.
Immitzer, M., Neuwirth, M., Böck, S., Brenner, H., Vuolo, F., Atzberger, C., 2019: Optimal input features for tree species classification in central europe based on multi-temporal sentinel-2 data. Remote Sens. 11(22): 2599. https://doi.org/10.3390/rs11222599
Kemal, A., Serhat, K., Onur, C., 2019: Classification and diagnosis of cervical cancer with stacked autoencoder and softmax classification. Expert Syst. Appl. 115: 557–564. https://doi.org/10.1016/j.eswa.2018.08.050
Kureel, N., Sarup, J., Matin, S., Goswami, S., Kureel, K., 2022: Modelling vegetation health and stress using hypersepctral remote sensing data. Model. Earth Syst. Environ. 8(1): 733–748. https://doi.org/10.1007/s40808-021-01113-8
Kwon, R., Ryu, Y., Yang, T., Zhong, Z.L., Im, J., 2023: Merging multiple sensing platforms and deep learning empowers individual tree mapping and species detection at the city scale. ISPRS J. Photogramm. Remote Sens. 206: 201–221. https://doi.org/10.1016/j.isprsjprs.2023.11.011
Liu, H., 2022: Classification of urban tree species using multi-features derived from four-season RedEdge-MX data. Comput. Electron. Agric. 194: 106794. https://doi.org/10.1016/j.compag.2022.106794
Liu, H., 2023a: Effectiveness of the spectral area index created by three algorithms for tree species recognition. Ann. For. Sci. 80(1): 17. https://doi.org/10.1186/s13595-023-01184-w
Liu, H., 2023b: Spectral volume index creation and performance evaluation: a preliminary test for tree species identification. Heliyon 9(6): e17203. https://doi.org/10.1016/j.heliyon.2023.e17203
Liu, H., 2024: Classification of tree species using UAV-based multi-spectral and multi-seasonal images: a multi-feature-based approach. New For. 55(1): 173–196. https://doi.org/10.1007/s11056-023-09974-w
Liu, H., An, H., 2019: Urban greening tree species classification based on HSV colour space of WorldView-2. J. Indian Soc. Remote Sens. 47(11): 1959–1967. https://doi.org/10.1007/s12524-019-01028-z
Liu, H., An, H., 2020a: Analysis of the importance of five new spectral indices from WorldView-2 in tree species classification. J. Spatial Sci. 65(3): 455–466. https://doi.org/10.1080/14498596.2018.1521754
Liu, H., An, H., 2020b: Extraction of four types of urban ground objects based on a newly created WorldView-2 multi-colour spectral index. J. Indian Soc. Remote Sens. 48(7): 1091–1100. https://doi.org/10.1007/s12524-020-01134-3
Liu, H.P., An, H.J., Wang, B., Zhang, Q.L., 2015: Tree species classification using WorldView-2 images based on recursive texture feature elimination. J. Beijing For. Univ. 37(8): 53–59. https://doi.org/10.13332/j.1000-1522.20140311
Masemola, C., Cho, M.A., Ramoelo, A., 2019: Assessing the effect of seasonality on leaf and canopy spectra for the discrimination of an alien tree species, acacia mearnsii, from co-occurring native species using parametric and nonparametric classifiers. IEEE Trans. Geosci. Remote Sens. 57(8): 5853–5867. https://doi.org/10.1109/TGRS.2019.2902774
Modzelewska, A., Fassnacht, F.E., Stereńczak, K., 2020: Tree species identification within an extensive forest area with diverse management regimes using airborne hyperspectral data. Int. J. Appl. Earth Obs. Geoinf. 84: 101960. https://doi.org/10.1016/j.jag.2019.101960
Naidoo, L., Cho, M.A., Mathieu, R., Asner, G.P., 2012: Classification of savanna tree species, in the Greater Kruger National Park region, by integrating hyperspectral and LiDAR data in a Random Forest data mining environment. ISPRS J. Photogramm. Remote Sens. 69(3): 167–179. https://doi.org/10.1016/j.isprsjprs.2012.03.005
Pu, R., Landry, S., 2012: A comparative analysis of high resolution IKONOS and WorldView-2 imagery for mapping urban tree species. Remote Sens. Environ. 124: 516−533. https://doi.org/10.1016/j.rse.2012.06.011
Pu, R., Shawn, L., Yu, Q., 2018: Assessing the potential of multi-seasonal high resolution pléiades satellite imagery for mapping urban tree species. Int. J. Appl. Earth Obs. Geoinf. 71: 144–158. https://doi.org/10.1016/j.jag.2018.05.005
Richards, J.A., Jia, X., 2008: Using suitable neighbors to augment the training set in hyperspectral maximum likelihood classification. IEEE Geosci. Remote Sens. Lett. 5(4): 774–777. https://doi.org/10.1109/LGRS.2008.2005512
Shi, Y.F., Wang, T.J., Skidmore, A.K., Heurich, M., 2020: Improving LiDAR-based tree species mapping in Central European mixed forests using multi-temporal digital aerial colour-infrared photographs. Int. J. Appl. Earth Obs. Geoinf. 84: 101970. https://doi.org/10.1016/j.jag.2019.101970
Torabzadeh, H., Leiterer, R., Hueni, A., Schaepman, M., Morsdorf, F., 2019: Tree species classification in a temperate mixed forest using a combination of imaging spectroscopy and airborne laser scanning. Agric. For. Meteorol. 279: 107744. https://doi.org/10.1016/J.AGRFORMET.2019.107744
Van der Linden, S., Rabe, A., Held, M., Jakimow, B., Leitão, P.J., Okujeni, A., Schwieder, M., Suess, S., Hostert, P., 2015: The EnMAP-box- A toolbox and application programming interface for EnMAP data processing. Remote Sens. 7(9): 11249–11266. https://doi.org/10.3390/rs70911249
Wang, T., Zhang, H., Lin, H., Fang, C., 2016: Textural-spectral feature-based species classification of mangroves in mai po nature reserve from Worldview-3 imagery. Remote Sens. 8(1): 24. https://doi.org/10.3390/rs8010024
Yu, X., Hyyppä, J., Litkey, P., Kaartinen, H., Vastaranta, M., Holopainen, M., 2017: Single-sensor solution to tree species classification using multispectral airborne laser scanning. Remote Sens. 9(2): 108. https://doi.org/10.3390/rs9020108
Zhang, B., Zhao, L., Zhang, X., 2020: Three-dimensional convolutional neural network model for tree species classification using airborne hyperspectral images. Remote Sens. Environ. 247: 111938. https://doi.org/10.1016/j.rse.2020.111938
Zhang, Z., Kazakova, A., Moskal, L.M., Styers, D.M., 2016: Object-based tree species classification in urban ecosystems using LiDAR and hyperspectral data. Forests 7(6): 122. https://doi.org/10.3390/f7060122
Zhou, J.H., Zhou, Y.F., Mu, W.S., 2011: Mathematic descriptor for identifying plant species: A case study on urban landscape vegetation. J. Remote Sens. 15(3): 524–538.
© 2026 by the authors. Submitted for possible open access publication under the
terms and conditions of the Creative Commons Attribution (CC BY) license (http://creativecommons.org/licenses/by/4.0/).
Authors’ addresses:
Huaipeng Liu, PhD *
e-mail: gatestudy@163.com
Luoyang Normal University
School of Geography and Tourism
Henan Province
471934, Luoyang
CHINA
Received: June 27, 2024
Accepted: September 28, 2025
Original scientific paper