
Assessing Cable Tensile Forces and Machine Tilt of Winch-Assisted Forwarders on Steep Terrain under Real Working Conditions
doi: https://doi.org/10.5552/crojfe.2019.621
volume: 40, issue:
- Author(s):
-
- Holzfeind Thomas
- Kanzian Christian
- Stampfer Karl
- Holzleitner Franz
- Article category:
- Original scientific paper
- Keywords:
- steep terrain harvesting, winch-assisted forwarder, cut-to-length, tensile force
Abstract
HTML
Winch-assisted forwarders are now commonly accepted as an innovative alternative for extracting wood on challenging terrain. In order to assess safety risks, it is necessary to know the tensile forces in the steel wire rope and their interaction with the machine tilt under real working conditions. In this study, the tensile force and the machine tilt of two winch-assisted forwarders (John Deere 1210E and Komatsu 840TX) were observed for about 15 work hours without delays on two different stands in Austria. The tensile force data and the machine tilt data were separated by work elements. The mean tensile force ranged from 18.1 kN for unloading up to 56.8 kN for loading activities. During the measurements, the cable tensile force exceeded 50% of the minimum breaking strength (MBS) only twice. The maximum observed tensile force was 174.5 kN or 82.7% of the MBS, respectively, which led to a failure of the steel cable. For the machine tilt, a maximum of 80% was measured during loading and driving during loading. John Deere 1210E was operated 31% of the productive work time above the manufacturers tilt limit. For Komatsu 840TX, the manufacturers’ maximum tilt limit was exceeded only twice. The study also showed that peaks with an amplitude of up to 50 kN can occur within a few centiseconds, which highlights the need of high measurement rates, when measuring cable tensile force of winch-assisted machinery. The detailed analysis of the peaks showed that 90% of the pit-to-peak amplitudes ≥20 kN occurred during driving activities. Only 10% of pit-to-peak amplitudes ≥20 kN were measured during loading activities, although loading took about 43.5% of the productive work time. As such, the study results confirm that amplitudes of peaks in tensile force, and hence safety risks, are significantly higher during driving than during loading.
Assessing Cable Tensile Forces and Machine Tilt of Winch-Assisted Forwarders on Steep Terrain under Real Working Conditions
Thomas Holzfeind, Christian Kanzian, Karl Stampfer, Franz Holzleitner
https://doi.org/10.5552/crojfe.2019.621
Abstract
Winch-assisted forwarders are now commonly accepted as an innovative alternative for extracting wood on challenging terrain. In order to assess safety risks, it is necessary to know the tensile forces in the steel wire rope and their interaction with the machine tilt under real working conditions. In this study, the tensile force and the machine tilt of two winch-assisted forwarders (John Deere 1210E and Komatsu 840TX) were observed for about 15 work hours without delays on two different stands in Austria. The tensile force data and the machine tilt data were separated by work elements. The mean tensile force ranged from 18.1 kN for unloading up to 56.8 kN for loading activities. During the measurements, the cable tensile force exceeded 50% of the minimum breaking strength (MBS) only twice. The maximum observed tensile force was 174.5 kN or 82.7% of the MBS, respectively, which led to a failure of the steel cable. For the machine tilt, a maximum of 80% was measured during loading and driving during loading. John Deere 1210E was operated 31% of the productive work time above the manufacturers tilt limit. For Komatsu 840TX, the manufacturers’ maximum tilt limit was exceeded only twice. The study also showed that peaks with an amplitude of up to 50 kN can occur within a few centiseconds, which highlights the need of high measurement rates, when measuring cable tensile force of winch-assisted machinery. The detailed analysis of the peaks showed that 90% of the pit-to-peak amplitudes ≥20 kN occurred during driving activities. Only 10% of pit-to-peak amplitudes ≥20 kN were measured during loading activities, although loading took about 43.5% of the productive work time. As such, the study results confirm that amplitudes of peaks in tensile force, and hence safety risks, are significantly higher during driving than during loading.
Keywords: steep terrain harvesting, winch-assisted forwarder, cut-to-length, tensile force
1. Introduction
Ground-based harvesting has significantly benefited from mechanization (Spinelli and Magagnotti 2011, Lindroos et al. 2017) but is often restricted by terrain conditions. For example, Heinimann (1999) suggested that a practical feasibility limit for downhill skidding should be 50%, but is strictly limited to terrain with good bearing capacity. In addition, Sessions et al. (2017) showed that for harvesting machinery on steep terrain beside soil strength, load, travel direction and slippage, the type of construction (e.g. grouser height, track width, boom position) can also influence the upper slope limit, giving a range from 30% up to 85%.
Trafficability can also be restricted because of obstacles in skid trails (stumps, stones, etc.), partially steeper terrain (embankments, etc.) or potentially high soil disturbances caused by driving. To solve these problems and expand the application of ground-based vehicles, the idea came up to use winches for assistance in order to reduce site damage and harvesting costs on steep, soft or wet terrain (e.g. McKenzie and Richardson 1978, Jackson and Stokes 1990, Salsbery and Hartsough 1993).
Winch-assisted forwarders commenced operations in central Europe in the early 2000s (Oberer 2012). Soon after the launch of forwarders, harvesters have also been equipped with winches (Weise 2016). Winch-assisted harvester and forwarder operations are now a commonly accepted steep slope harvesting system (Visser and Stampfer 2015).
Expanding ground-based harvesting machinery onto more difficult terrain generates additional benefits. Dangerous and challenging tasks, like motor-manual felling or choker setting in cable yarding operations, can be substituted by higher mechanized systems and, therefore, an increase in safety and a decrease in injury risks can be reached (Axelsson 1998, Bell 2002).
Forwarders are typically more cost-effective than tower yarders for extraction (Drews et al. 2001), and the setup times for the cable of winch-assisted forwarders are lower compared to corridor installation times of tower yarders (Stampfer et al. 2006, Holzfeind et al. 2018). Harvesting operations in stands on difficult terrain, that were previously not economically viable, can now be safer and more cost efficient with winch-assisted machinery (Cavalli and Amishev 2017).
Although using winch-assist technology on tracked machines can theoretically increase the upper trafficability limit to over 100% (Visser and Stampfer 2015, Session et al. 2017), for safety and liability reasons manufacturers can restrict upper limits; for example 50% (Haas Maschinenbau) or 55% inclination (Komatsu). The primary reason for these recommendations is that, in case of a cable or anchor failure, the machine operator should always be able to stop the machine under full control. However, machines are often operated well above manufacturer limits (Visser and Berkett 2015, Holzleitner et al. 2018, Mologni et al. 2018) to benefit from the advantages of fully mechanized harvesting machinery.
Some initial investigations on tensile forces of winch-assisted machinery have been published recently. For example, Schaare et al. (2016) recorded cable tensile force for tracked feller bunchers in New Zealand and observed a peak tensile force of 412 kN (60.1% of MBS). For wheeled harvesters and forwarders, Holzleitner et al. (2018) developed a specific survey protocol for monitoring tensile forces and during field tests they measured a peak of 75.5 kN (41.7% of MBS). In this study, safe working load (SWL) of the cable, considering a safety factor (SF) of two (actual draft version of ISO 19472-2), was not exceeded. Mologni et al. (2018) also measured tensile forces of large winch-assisted forwarders in British Columbia and could not observe peaks exceeding 40.1% of MBS.
In order to assess safety risks, it is necessary to know the tensile forces in the steel cable and their behavior under varied working conditions in different work phases. Although some studies on tensile force of winch-assisted machinery exist, there are still many aspects that need further clarification. In particular, amplitude and duration in tensile force peaks have not been studied in detail, although it is well known that the lifetime of steel wire cables can be reduced by repeated loading with increasing axial stress (Hobbs and Raoof 1996).
The aim of this study is, therefore, to analyse accurately the occurrence of peaks in tensile force and to evaluate their amplitudes and their duration. Machine tilt is measured as well to determine the interaction between machine tilt and tensile force. In addition, tensile force depending on work element and differences in tensile force, especially in the amplitudes, between driving- and loading activities of the forwarder are investigated.
2. Materials and methods
2.1 Study sites
The measurements were carried out on two different sites in Austria (Table 1). Ground conditions differed between the sites; at the »Zauchensee« site the ground was frozen with a snow cover of 20 cm, and at the »Gresten« site the ground was dry and firm.
Table 1 Overview of the study sites
|
Site |
Latitude |
Longitude |
Silvicultural Treatment |
Skid Trails |
Machine |
Month |
|
Zauchensee |
47.3223 |
13.4609 |
Second Thinning |
1 |
Komatsu 840TX |
December |
|
Gresten |
47.9196 |
15.0030 |
Clear Cut |
4 |
John Deere 1210E |
April |
2.2 Machines
Two machines, a Komatsu 840TX and a John Deere 1210E, both equipped with winch-assist technology, were observed over four days under daylight. Komatsu 840TX used a combination of bogie tracks and chains on its wheels; John Deere 1210E only used boogie tracks. The maximum manufacturer rated pulling force of the winches differed with 72 kN for Komatsu 840TX and 90 kN for John Deere 1210E, while the cable diameter was 14 mm for both machines. The rated load capacity of John Deere 1210E was 1000 kg higher than that of Komatsu 840TX, whereas the empty weight of Komatsu 840TX including the winch was about 5000 kg less than that of John Deere 1210E (Table 2). The operator of Komatsu 840TX had an experience of more than five years and the operator of John Deere 1210E had only nine months of experience.
Table 2 Technical characteristics of the winch-assisted forwarders
|
Machine |
Unit |
John Deere 1210E |
Komatsu 840TX |
|
Power |
kW |
145 |
129 |
|
Cabin |
– |
Rotating and self-levelling |
Fixed and non-self-levelling |
|
Loading capacity |
kg |
13 000 |
12 000 |
|
Mass |
kg |
18 350 |
14 800 |
|
Tracks/chains |
kg |
3750 |
1998 |
|
Boom reach |
m |
10 |
7.8 |
|
Winch |
Haas Highgrade |
Komatsu/Ritter |
|
|
Max. pulling force |
kN |
90 |
72 |
|
Mass incl. cable |
kg |
1950 |
2160 |
|
Cable diameter |
mm |
14 |
14 |
|
Max. cable capacity |
m |
300 |
325 |
|
Min. breaking strength of cable |
kN |
211 |
211 |
2.3 Time and motion study
A time and motion study was carried out by post hoc analysis of the recorded video data. The videos were recorded via action camera mounted on the cabin of the machine. The captured video material was observed using an add-on in Microsoft Excel written in Visual Basic for Applications (VBA), which was developed by LUKE (METLA) (Niemistö et al. 2012). Eight different work elements were defined for analysing cable tensile force depending on forwarders’ activities (Table 3).
Table 3 Definitions of forwarders’ activities
|
Work Element |
Start |
End |
|
Driving Empty |
Movement of the wheels after attaching the cable to the anchor tree (first skid trail) or movement of the wheels after unloading |
Movement of the crane at the first loading point |
|
Loading |
Movement of the crane at a loading point |
Movement of the wheels after loading at a loading point |
|
Driving during Loading |
Movement of the wheels after loading |
Movement of the crane for loading |
|
Driving Loaded |
Movement of the wheels after loading at the last loading point |
Movement of the crane for unloading at the unloading point |
|
Unloading |
Movement of the crane for unloading at the unloading point |
Movement of the wheels after unloading |
|
Other Processes |
Other activities like for example removing branches and stones of the forest road, etc. |
|
|
Delays |
Time not related to productive work (e.g. repair work) |
|
|
Study Based Delays |
Delays caused by the study |
|
2.4 Cable tensile force monitoring
Considering the circumstances for measuring tensile force in the field, requirements for the measuring equipment can be summarized as follows:
Þ autonomous operation over a whole working day
Þ light weight as it needs to be portable in steep terrain
Þ autonomous power supply
Þ weather proof
Þ flexible measurement configuration to be future proof.
After the first experiments with a bending beam sensor and a plug-and-play data acquisition system (DAQ), as descripted in Holzleitner et. al (2018), a more robust and flexible configuration was assembled. Instead of a bending beam sensor, the tensile force was directly measured with a load shackle (ALTHEN SHK-B-12-4202) with a rated load of 12 t, a proof load of 18 t and a resolution of 0.01 t. This shackle was fixed at the anchor tree with a sling or a steel cable, and the steel cable of the machine was attached to the shackle (Fig. 1A). The shackle was wired to a DAQ consisting of HBM Quantum MX840 analogue digital amplifier and a miniature fanless PC for data recording connected via LAN cable. The analogue digital amplifier allows measurement rates of up to 40 kHz. As accurate timestamps were of importance to merge sensor and time and motion study data later on in the analysis, the PC clock synchronized time with an attached USB GPS device. The system was housed for reasons of shock protection and water resistance in a case, together with two batteries and the GPS device (Fig. 1B). The DAQ software »HBM catman« was installed on the PC. The PC operates without screen in headless mode to reduce power requirements. Acting as wireless access point, the PC can be managed and controlled via remote desktop using a »Panasonic Toughbook« from a safe position, if needed. The measurement rate for the tensile force was set to 100 Hz to enable a detailed analysis of occurring peaks. The use of two batteries made it possible to change a battery without interrupting the measurement.
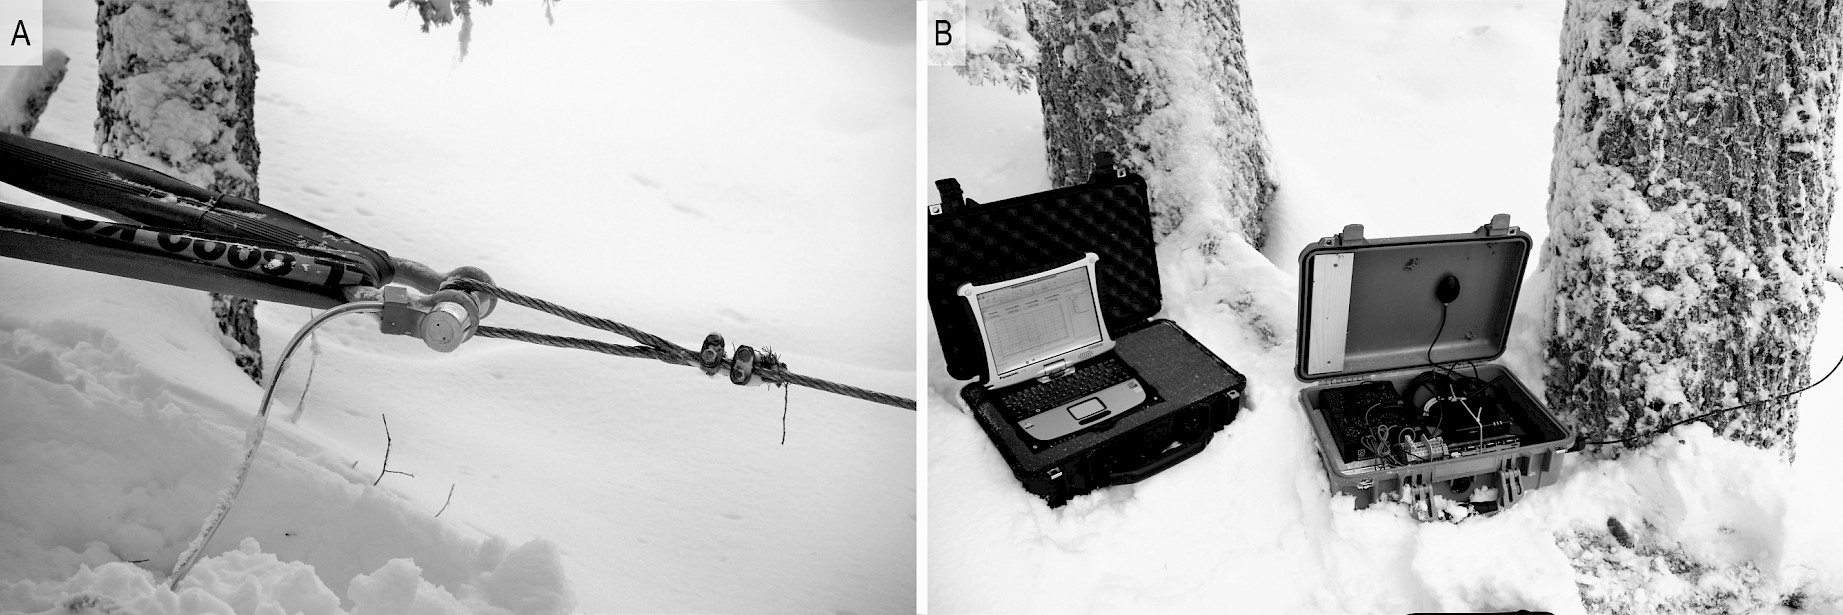
Fig. 1 Load shackle mounted between anchor tree and steel cable of a winch-assisted forwarder (A), and measurement equipment for observing tensile force (B)
2.5 Machine tilt monitoring
The machine tilt was measured with the inertial measurement unit (IMU) »PhidgetSpatial Precision 3/3/3« connected to a »Raspberry PI 3 Model B« provided by Tyrone Nowell from NIBIO. The resolution of the »PhidgetSpatial Precision 3/3/3« is 0.02 °/s for the x- and y-axis and 0.013 °/s for the z-axis. The equipment was put in a case (Fig. 2A) and mounted with a strap on the frame of the machine (Fig. 2B). Tilt for each axis (XYZ) was recorded at a frequency of 1 Hz.
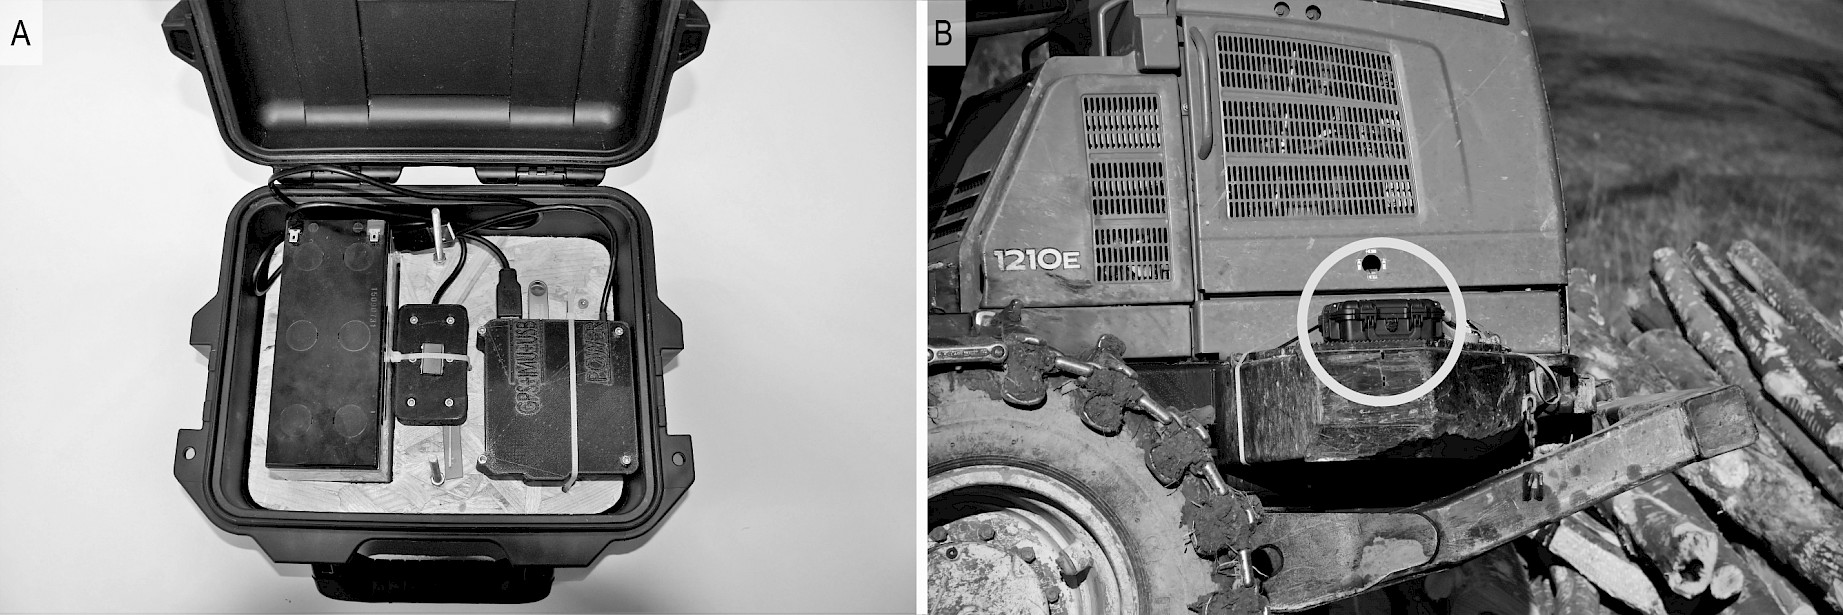
Fig. 2 Raspberry PI with an IMU and a battery in a case for measuring the machine tilt (A), mounted on a forwarder frame with a strap (B)
2.6 Data analysing
The merging and analysis of the sensor data was done similarly to the approach of Holzleitner et al. (2018). All data was preprocessed via R-Scripts and exported into a database in separate tables for tensile force, tilt, time and motion data. With structured query language (SQL) queries, records from different tables were joined using the timestamp. The analysing and plotting of the joined data was done via R-scripts. For the detailed analysis of peaks and pits in tensile force, the »timeSeries« package in R (Wuertz et al. 2017) was used. With this package turning points of a time series can be identified, whereby every turning point is then representing either a pit or a peak. After identifying the turning points (peaks and pits), the associated duration and amplitude can be determined (Fig. 3).

Fig. 3 Schematic illustration of turning points (peaks and pits) and explanation of their duration and amplitude
3. Results
3.1 Cable tensile force
In total, the two machines were observed for about 15 work hours without delays. Tensile force was measured during six cycles on one skid trail for Komatsu 840TX, and for John Deere 1210E during 19 cycles on four skid trails. The highest observed tensile force was 174.5 kN for John Deere 1210E and 105 kN for Komatsu 840TX (Table 4). The maximum values for Komatsu did not exceed 50% of MBS (SF=2), but for John Deere 1210E the tensile force was above 50% of MBS (SF=2) for 2.09 sec. If assuming a SF of three (33% of MBS), the tensile force for John Deere 1210E would be even 117.4 min above, which is about 16.5% of productive work time. It is also interesting that, for both machines, tensile forces above the maximum winches pulling force were measured.
Tensile forces were measured during downhill extraction for 23 cycles, and for two cycles Komatsu 840TX was extracting uphill. Within these two cycles during the work element »Driving Loaded«, the tensile force varied between 3 kN and 105 kN. In no other cycle such a large variation in tensile force was observed (Fig. 4). This could lead to the assumption that the winch was technically not able to hold a constant tensile force while the forwarder was driving fully loaded uphill. Because of the high total mass, driving fully loaded uphill can be a critical activity, where tensile forces are most likely to be highest compared to other work activities.
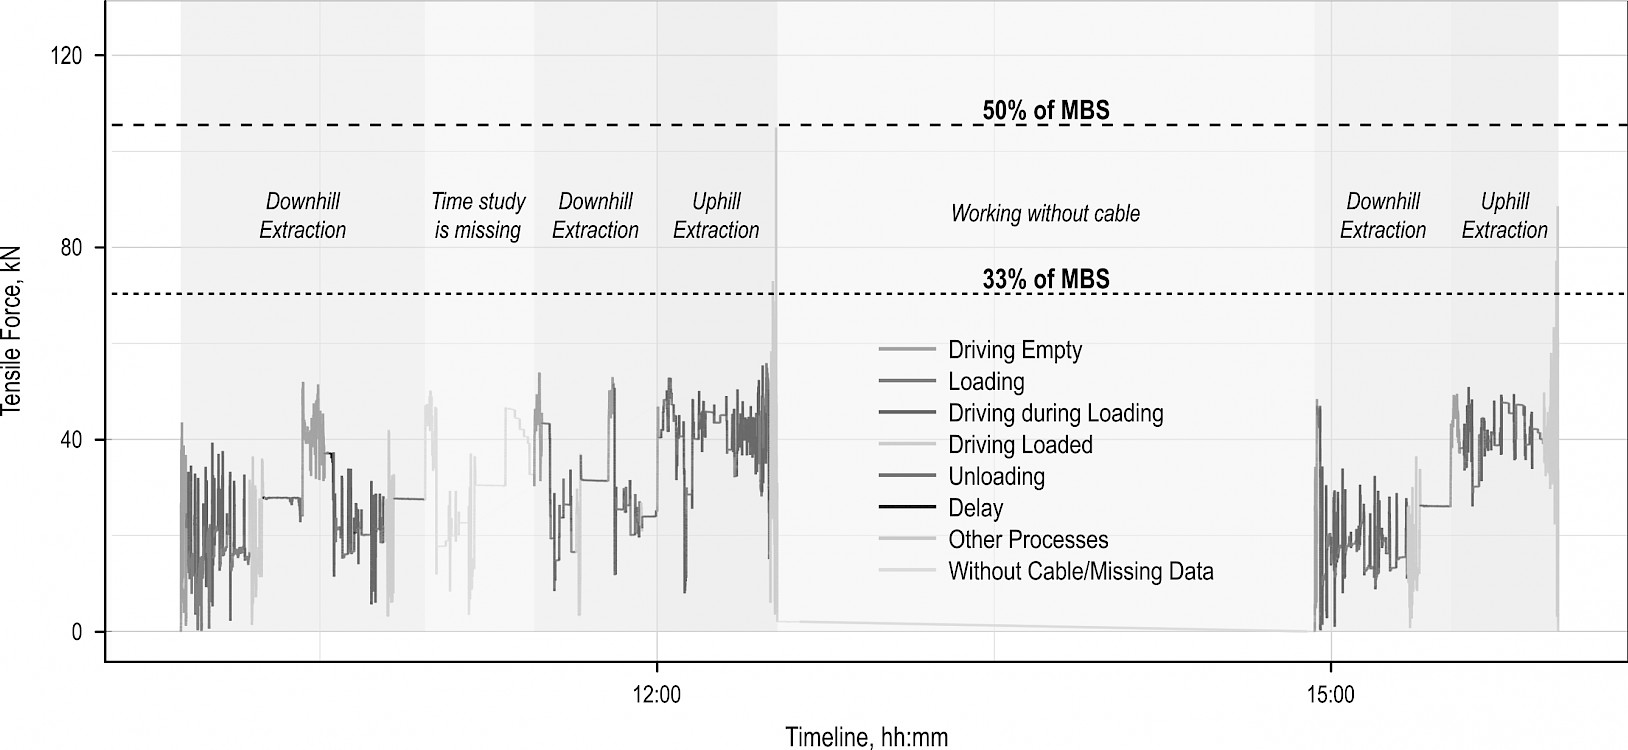
Fig. 4 Cable tensile force of Komatsu 840TX for one working day
Downhill extraction data for John Deere 1210E shows that the tensile force increases during »Driving Empty«, compared to »Loading« and »Driving during Loading«, and then decreases when the forwarder reaches the forest road during »Driving Loaded« (Fig. 5). At the work element »Unloading«, the tensile force is not zero because in most cases there is some initial tension, set by the operator, on the cable. The work element »Delay« in combination with a tensile force of zero can be indicating a change of the skid trail. When observing a cycle in detail, it can be seen that the tensile force stays more constant during loading activities than during driving activities. After loading activities, some smaller peaks in tensile force were frequently measured, which were caused by the driving. This behaviour, possibly induced by not perfect synchronization between the machine movements and the winch, has also been already observed by Mologni et al. (2018) (Fig. 5, Fig. 6).
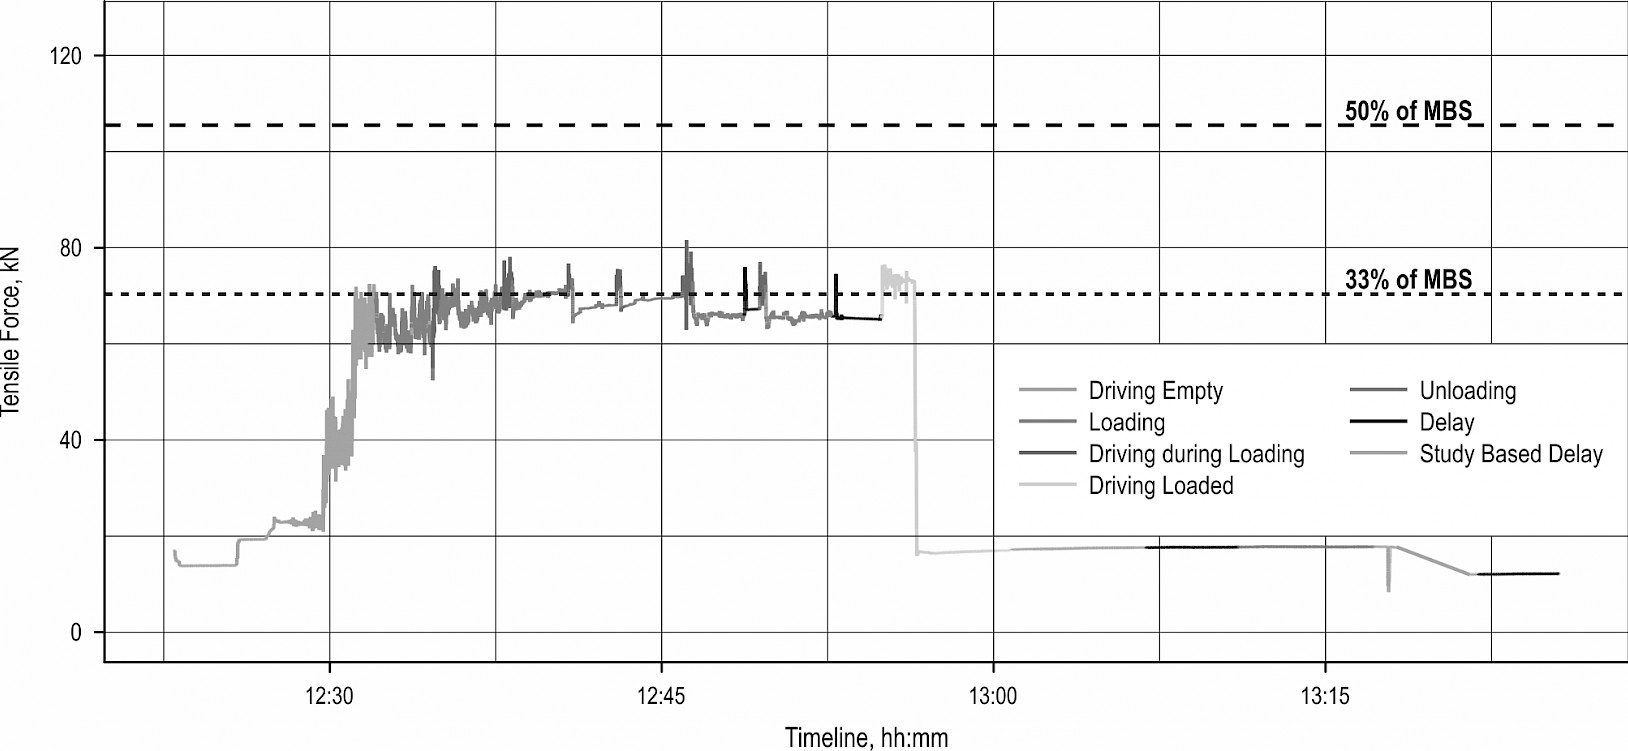
Fig. 5 Cable tensile force of John Deere 1210E during a selected cycle
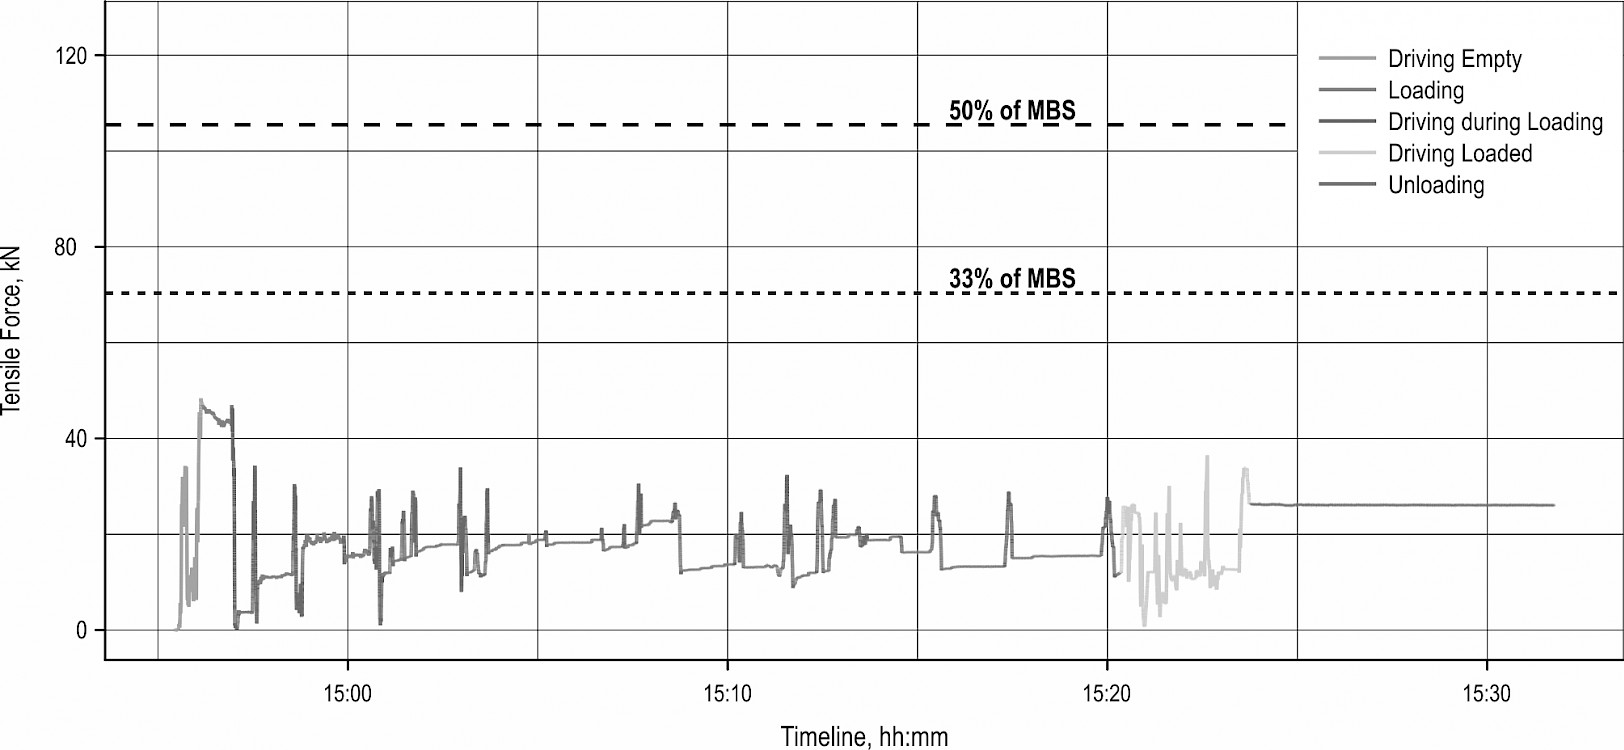
Fig. 6 Cable tensile force of Komatsu 840TX during a selected cycle
The data recorded during the failure of the cable was particularly interesting (Fig. 7). The analysis shows that the tensile force in the cable increased continuously from about 65 kN to a maximum of 174.5 kN within approximately 3 sec (Fig. 8). The anchor stump (Picea abies), with the diameter of 48 cm, withstood the tensile force, but the cable broke approximately 15 m away from the anchor without touching any obstacle, although the MBS of the cable had not been reached. It could have been the case that the seven month old cable was previously slightly damaged and, therefore, it broke below the MBS.
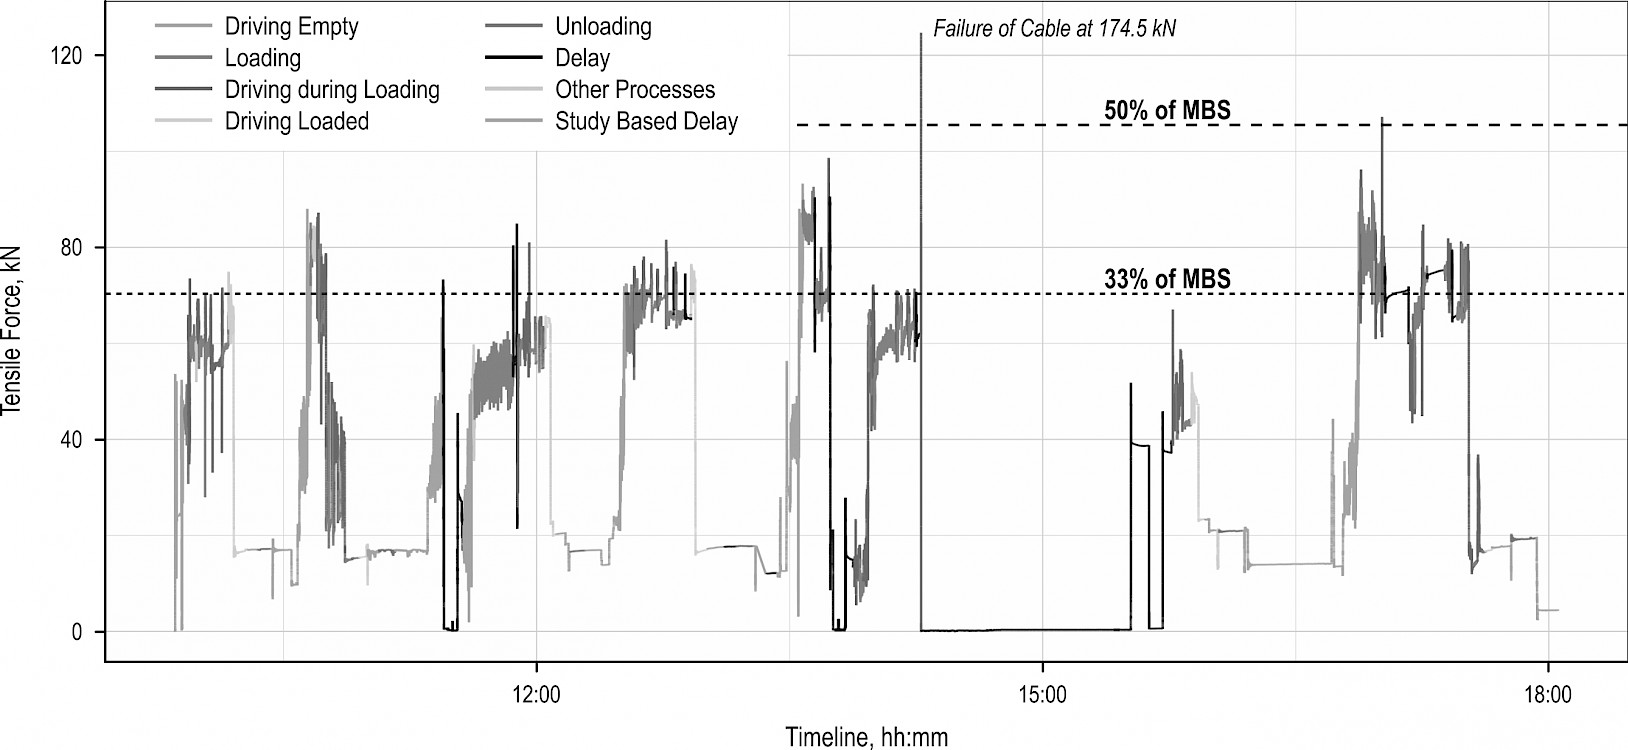
Fig. 7 Cable tensile force of John Deere 1210E for one working day
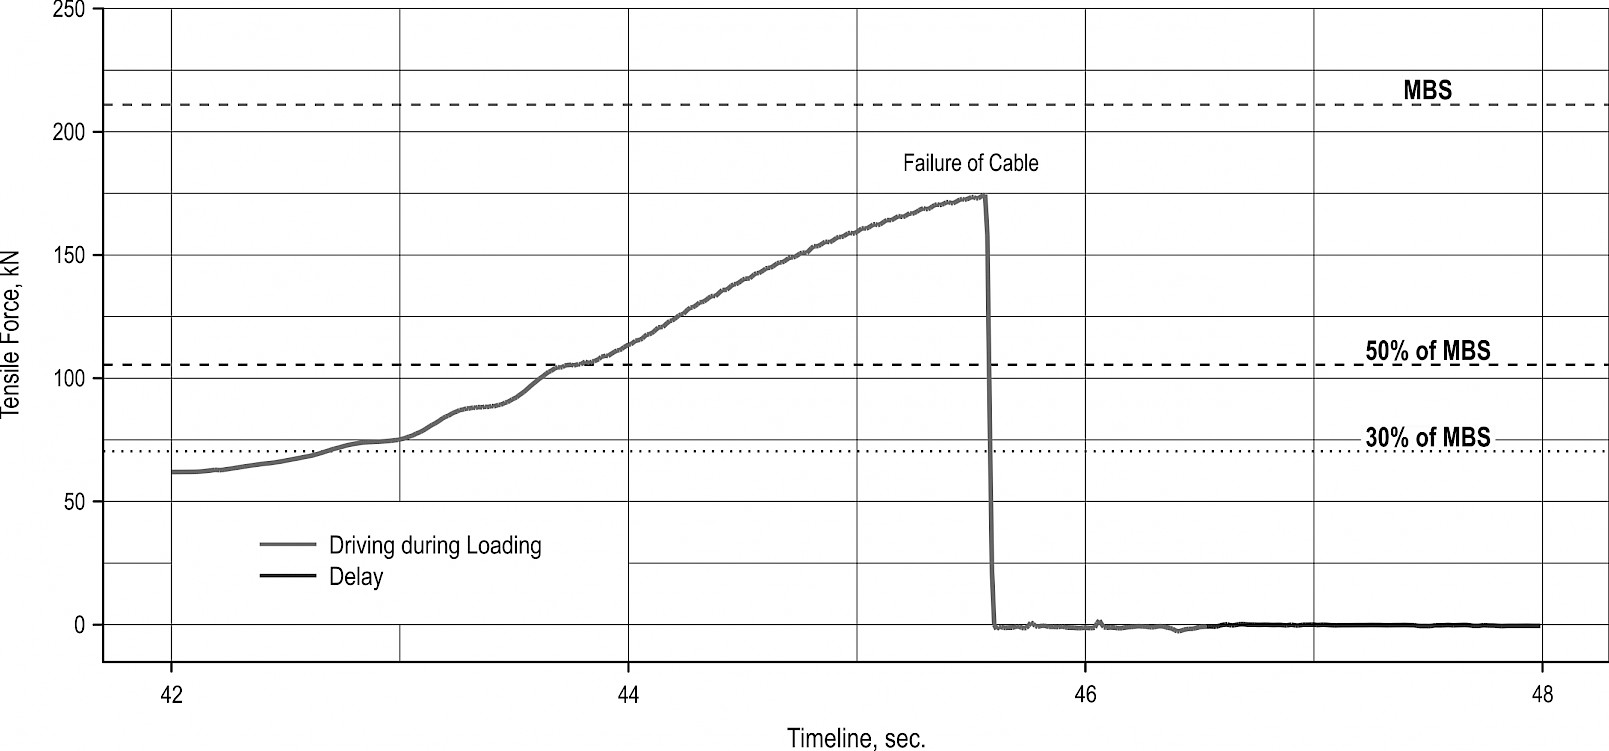
Fig. 8 Cable tensile force of John Deere 1210E at the moment of the failure of cable
The Kruskal Wallis test, carried out for each machine, showed that there was a statistical difference in tensile force between the work elements (chi-squared = 111 274, p-value <0.001 for Komatsu 840TX and chi-squared = 1 305 015, p-value <0.001 for John Deere 1210E). A Mann-Whitney test, also carried out for each machine, showed that the tensile force for each work element was statistically different to the others (Table 4).
It seems to be wrong that the median value for tensile force of Komatsu 840TX for »Unloading« was about 12.4 kN higher than that for »Driving Loaded« (Table 4). This was because Komatsu 840TX was unloaded while on the steepest part of the skid trail (cut slope) and, therefore, the operator set the pulling force of the winch to a relatively high level.
Table 4 Descriptive statistics of tensile force depending on work element. For each machine, different letters (a, b, c, d, e) after mean values represent significant differences between work elements
|
Work Element |
Minimum kN |
0.05 Quantile kN |
Median kN |
Mean kN |
0.95 Quantile kN |
Maximum kN |
Observed time min |
|
John Deere 1210E |
|||||||
|
Driving Empty |
1.03 |
9.77 |
23.36 |
27.00a |
62.63 |
93.25 |
140.6 |
|
Loading |
0.50 |
10.95 |
66.04 |
56.80b |
79.42 |
97.99 |
300.6 |
|
Driving during Loading |
0.17 |
11.18 |
53.54 |
46.71c |
75.90 |
174.53 |
85.4 |
|
Driving Loaded |
0.01 |
1.02 |
18.61 |
31.00d |
74.08 |
80.92 |
77.7 |
|
Unloading |
0.15 |
1.86 |
17.77 |
18.14e |
31.71 |
42.95 |
108.0 |
|
Komatsu 840TX |
|||||||
|
Driving Empty |
0.00 |
16.44 |
42.23 |
40.08a |
50.18 |
53.93 |
14.2 |
|
Loading |
0.10 |
12.50 |
22.04 |
27.74b |
47.23 |
55.87 |
93.0 |
|
Driving during Loading |
0.22 |
11.94 |
36.60 |
32.53c |
47.10 |
55.38 |
31.6 |
|
Driving Loaded |
0.09 |
3.42 |
15.20 |
25.37d |
50.51 |
104.96 |
17.0 |
|
Unloading |
21.49 |
23.93 |
27.62 |
27.67e |
31.48 |
36.73 |
37.3 |
3.2 Amplitude and duration of peaks and pits
In total, 37 548 peaks and pits with amplitudes greater than 1 kN were assessed for both machines. 18 801 of them were pit-to-peak amplitudes and 18 747 were peak-to-pit amplitudes. The amount of these two amplitudes is different because the analysis does not include amplitudes <1 kN (Fig. 9). As small amplitudes are not of interest and in order to reduce the data, the amplitude threshold of 1 kN was chosen.
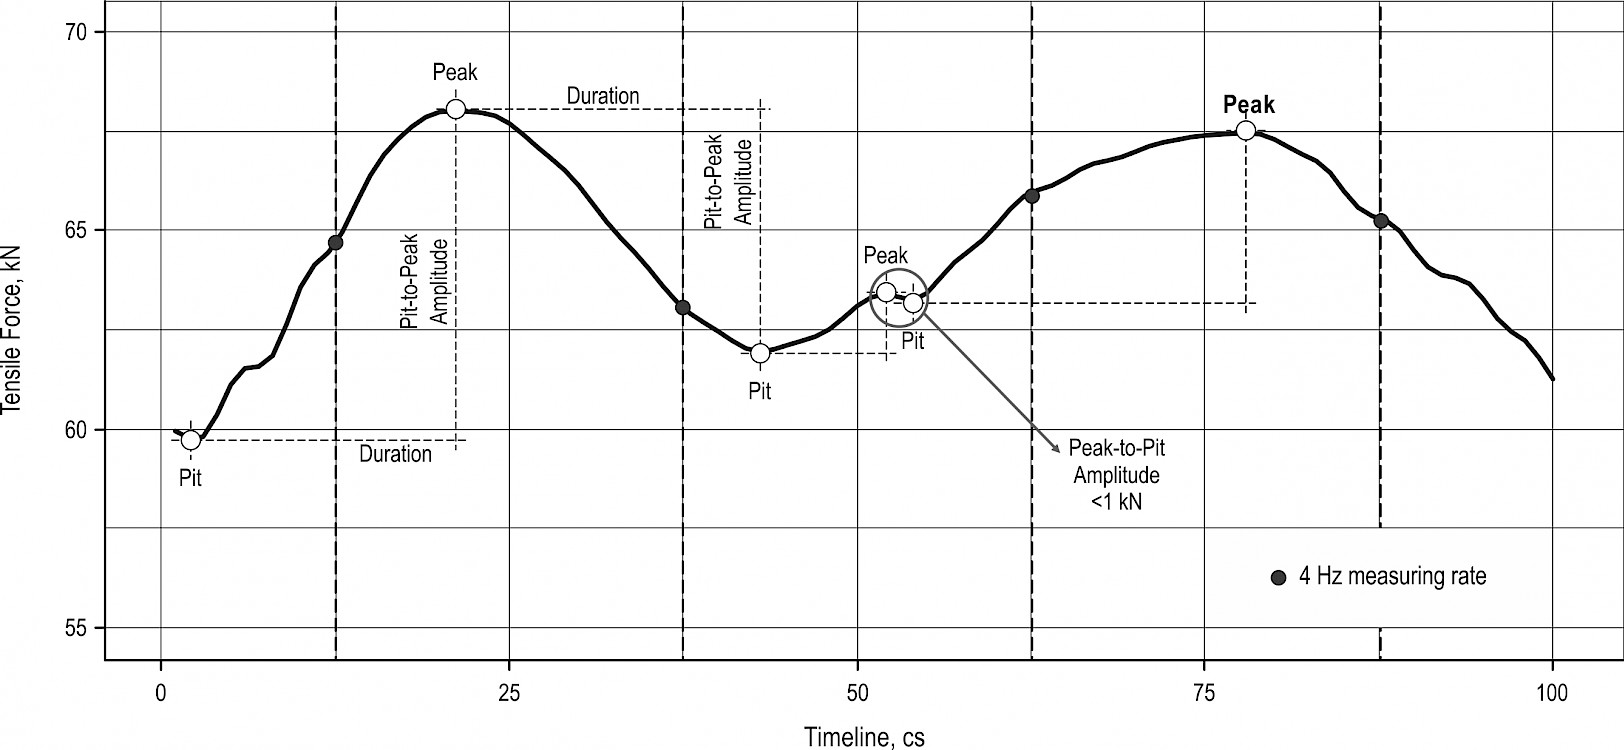
Fig. 9 Explanation of two different types of amplitude using real measured data; amplitudes <1 kN are excluded from the analysis. If a measurement rate of only 4 Hz were used, there would be a loss of information
When looking at the machines individually, there were almost no differences in the descriptive statistics for the amplitude and for the duration between pit-to-peak and peak-to-pit excluding maximum values. This indicates that the tensile force in the cable follows a sine curve. The highest observed amplitudes were 79.0 kN (pit-to-peak) and 176.4 kN (peak-to-pit) directly after the failure of the cable. If excluding the peak-to-pit amplitude directly after failure of the cable, the maximum peak-to-pit amplitude is 75.1 kN. When comparing the machines, it can be seen that the mean pit-to-peak amplitude for Komatsu 840TX was about 0.8 kN higher than that of John Deere 1210E (Table 5). Using the Mann-Whitney test, the difference in the pit-to-peak amplitudes between the machines was statistically confirmed (W = 9 759 000, p <0.001).
Table 5 Descriptive statistics for amplitudes and duration of peaks and pits for two different machines
|
Machine |
John Deere 1210E |
Komatsu 840TX |
||||||
|
Type |
Pit-to-Peak |
Peak-to-Pit |
Pit-to-Peak |
Peak-to-Pit |
||||
|
Amplitude kN |
Duration cs |
Amplitude kN |
Duration cs |
Amplitude kN |
Duration cs |
Amplitude kN |
Duration cs |
|
|
Minimum |
1.0 |
1.0 |
1.0 |
1.0 |
1.0 |
3.0 |
1.0 |
3.0 |
|
1st Quartile |
1.3 |
15.0 |
1.3 |
14.0 |
1.4 |
16.0 |
1.4 |
19.0 |
|
Median |
1.9 |
19.0 |
1.9 |
19.0 |
2.0 |
31.0 |
2.1 |
32.0 |
|
Mean |
2.9 |
25.6 |
2.9 |
25.2 |
3.7 |
38.0 |
4.2 |
40.9 |
|
3rd Quartile |
3.2 |
31.0 |
3.2 |
31.0 |
4.2 |
48.0 |
4.4 |
51.0 |
|
Maximum |
79.0 |
364.0 |
176.4 |
308.0 |
54.8 |
211.0 |
44.3 |
207.0 |
|
N |
17 580 |
17 580 |
17 595 |
17 595 |
1221 |
1221 |
1152 |
1152 |
The detailed analysis of the peaks and pits showed that they can occur with the amplitude of up to 50 kN or even more within a few centiseconds. It can also be seen that there is a different point distribution between the two machines. For John Deere 1210E, amplitudes with a short duration occurred more often than for Komatsu 840TX (Fig. 10).
The analysis of the data from John Deere 1210E showed that there were 51 pit-to-peak amplitudes ≥20 kN during the work elements »Driving empty«, »Loading«, »Driving during Loading« and »Driving Loaded«. For Komatsu 840TX, there were 19 pit-to-peak amplitudes ≥20 kN during the work elements »Driving Empty«, »Driving during Loading« and »Driving Loaded«. For both machines, no pit-to-peak amplitudes ≥20 kN occurred during the work element »Unloading« (Fig. 11, Fig. 12). In total, 70 peaks with a pit-to-peak amplitude ≥20 kN were measured, and only seven of them were related to loading activities, although they took about 43.5% of productive time.
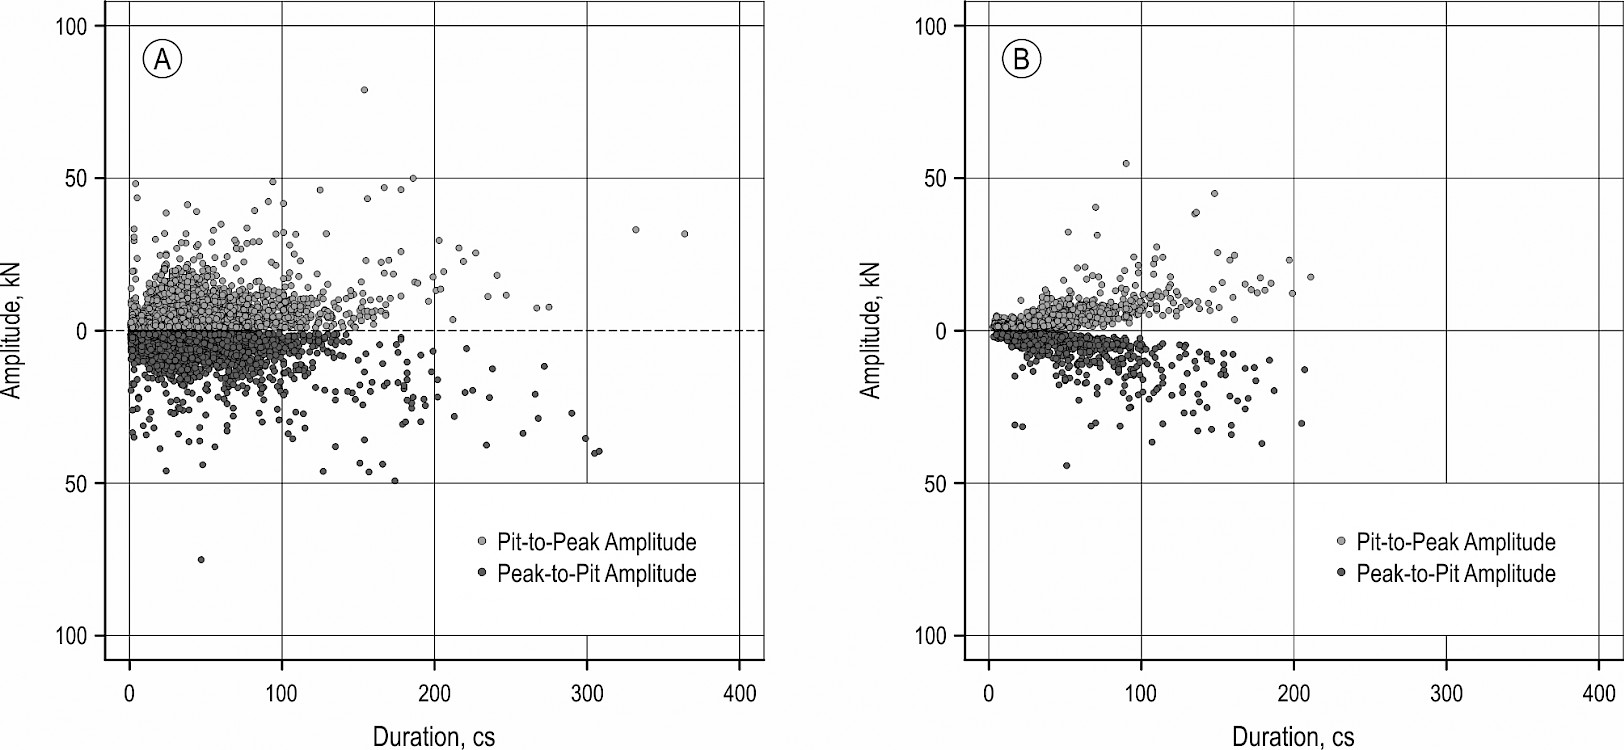
Fig. 10 Amplitudes of peaks and pits in tensile force and the associated duration for John Deere 1210E (A) and Komatsu 840TX (B). The peak-to-pit amplitude at the moment of the cable failure (176.4 kN) was removed to ensure a better readability of graphs
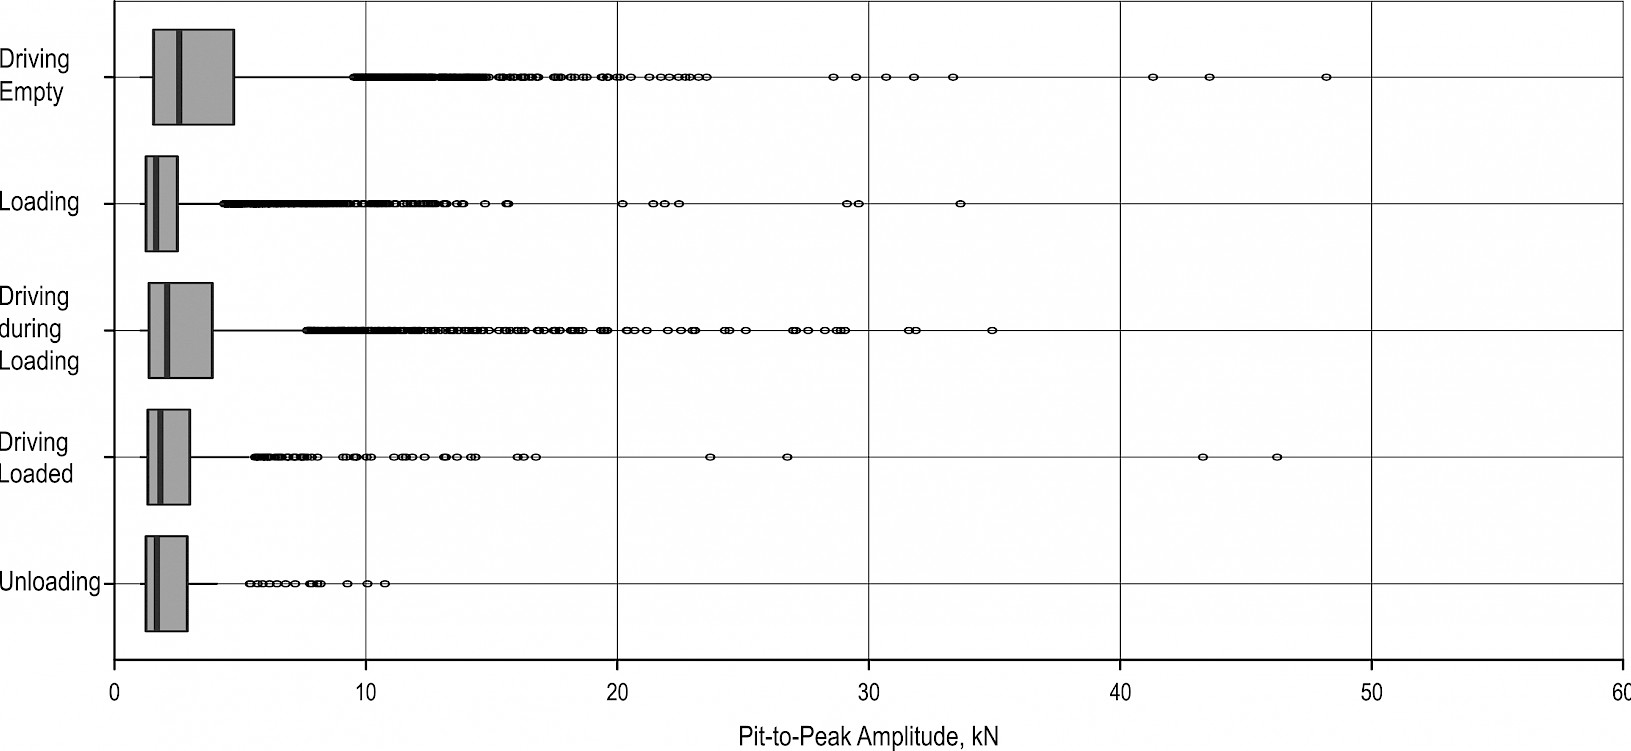
Fig. 11 Pit-to-Peak amplitude depending on work element for John Deere 1210E
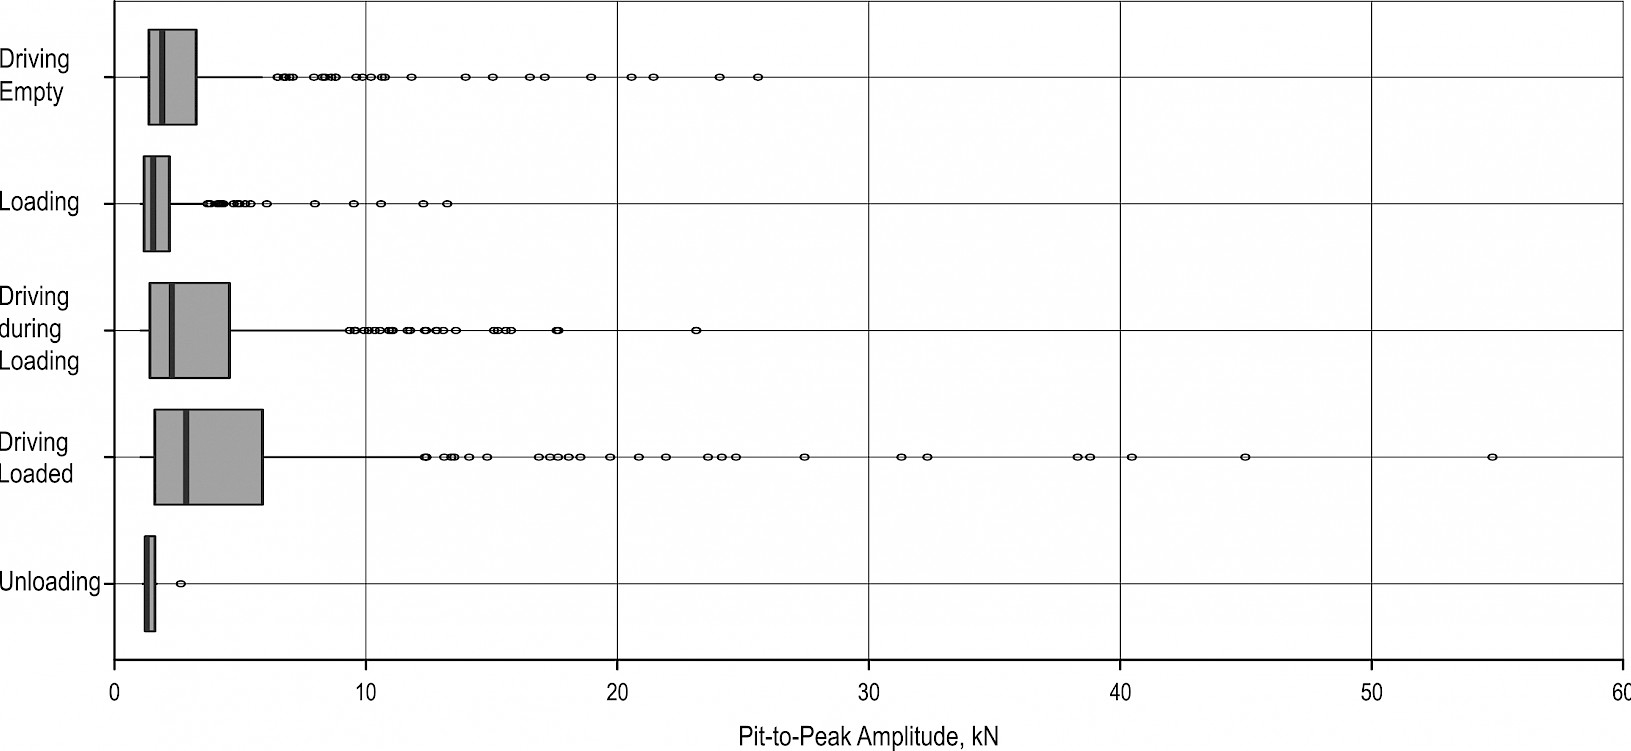
Fig. 12 Pit-to-Peak amplitude depending on work element for Komatsu 840TX
To investigate the assumption that there is a difference between pit-to-peak amplitudes during driving activities (Driving Empty, Driving during Loading and Driving Loaded) and loading activities (Loading, Unloading), a statistical test was carried out. As the data is not normally distributed, the Mann-Whitney test was chosen. For both machines, this non-parametric test shows a significant (p-value <0.001) difference in pit-to-peak amplitudes between driving and loading activities. This means that significantly higher pit-to-peak amplitudes occurred during driving activities than during loading activities (Table 6).
Table 6 Mean amplitude of Pit-to-Peak in tensile force depending on driving or loading activities for the two machines with the results of the Mann-Whitney test
|
Machine |
Mean Pit-to-Peak amplitude, kN |
W-value |
p-value |
|
|
Driving activities |
Loading activities |
|||
|
John Deere 1210E |
3.54 |
2.20 |
41 764 700 |
<0.001 |
|
Komatsu 840TX |
4.12 |
2.09 |
118 417 |
<0.001 |
3.3 Machine tilt
For John Deere 1210E, the highest observed machine tilt was 80% during the work elements »Loading« and »Driving during Loading«. The highest average machine tilt of 49% was observed for Komatsu 840TX during the work element »Unloading« (Table 7). This high value can be explained by the fact that the operator was unloading the logs at the cut slope, which was the steepest part of the skid trail. The negative values for John Deere 1210E are caused by a slope in the counter direction of the operation direction at the unloading point.
Table 7 Descriptive statistics for the machine tilt (%) depending on the work element
|
Work Element |
Minimum |
0.05 Quantile |
Median |
Mean |
0.95 Quantile |
Maximum |
|
John Deere 1210E |
||||||
|
Driving Empty |
–6 |
8 |
22 |
26 |
60 |
73 |
|
Loading |
7 |
22 |
52 |
48 |
68 |
80 |
|
Driving during Loading |
–7 |
17 |
43 |
42 |
67 |
80 |
|
Driving Loaded |
–14 |
6 |
18 |
21 |
51 |
60 |
|
Unloading |
–18 |
–6 |
8 |
4 |
11 |
20 |
|
Komatsu 840TX |
||||||
|
Driving Empty |
11 |
20 |
40 |
38 |
49 |
54 |
|
Loading |
17 |
24 |
39 |
37 |
46 |
52 |
|
Driving during Loading |
14 |
25 |
40 |
39 |
49 |
53 |
|
Driving Loaded |
7 |
17 |
37 |
35 |
47 |
57 |
|
Unloading |
44 |
45 |
48 |
49 |
54 |
55 |
Komatsu 840TX exceeded the 55% machine tilt limit specified by the manufacturer only two times, while John Deere 1210E was operating at a machine tilt higher than 50% for 218.4 min (= 30.7% of productive work time), which is the recommended limit by HAAS Maschinenbau (Fig. 13). As expected, the machine tilt is more constant during loading activities and varying during driving activities (Fig. 14). During the work element »Delay«, the machine tilt showed for a moment a machine tilt of 0% (Fig. 13). This was because the operator had to remove briefly the tilt measurement equipment to get access to his toolbox, which was stowed directly below the measurement kit.
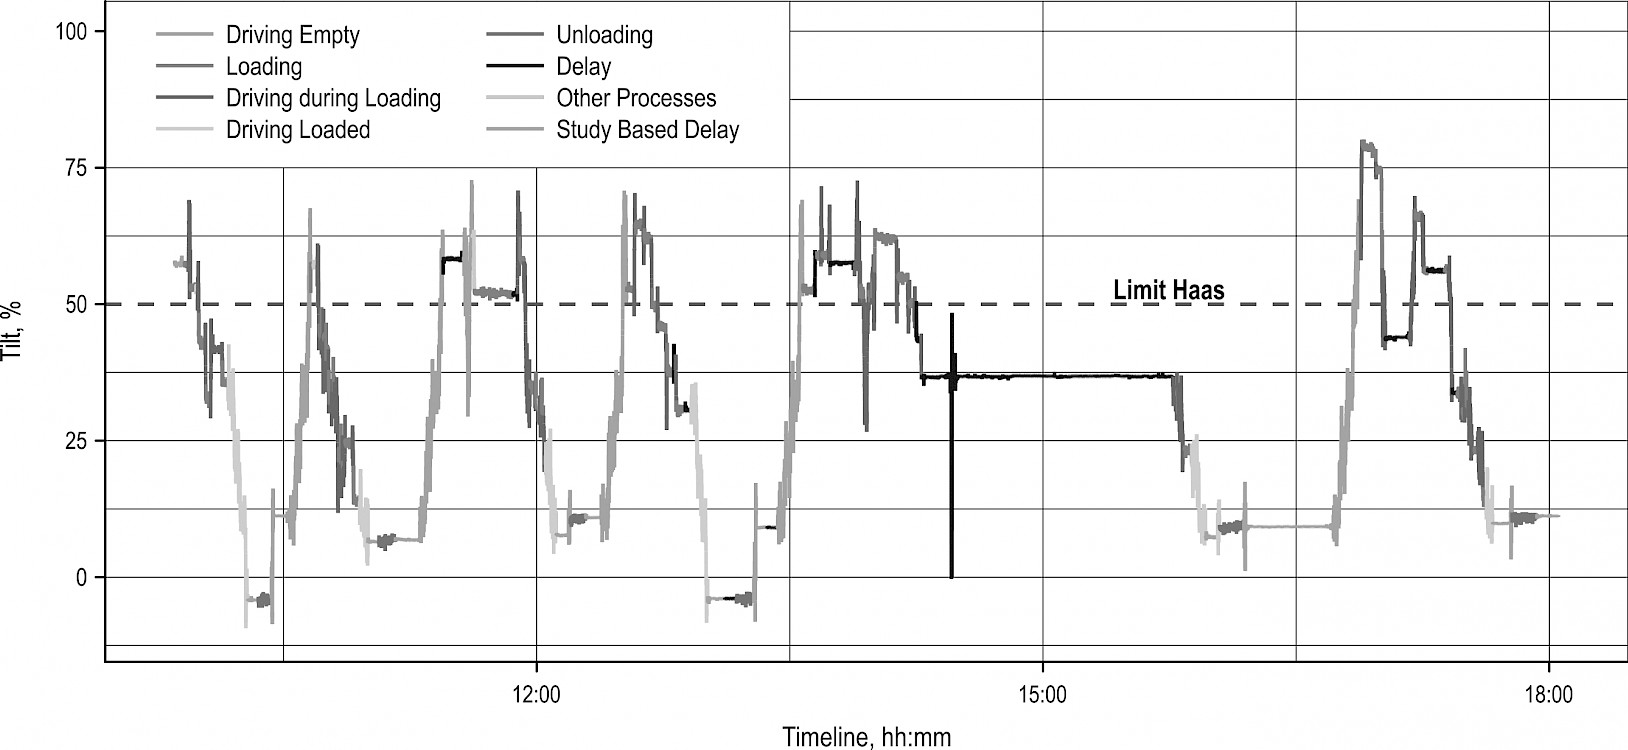
Fig. 13 Machine tilt of John Deere 1210E for a selected working day
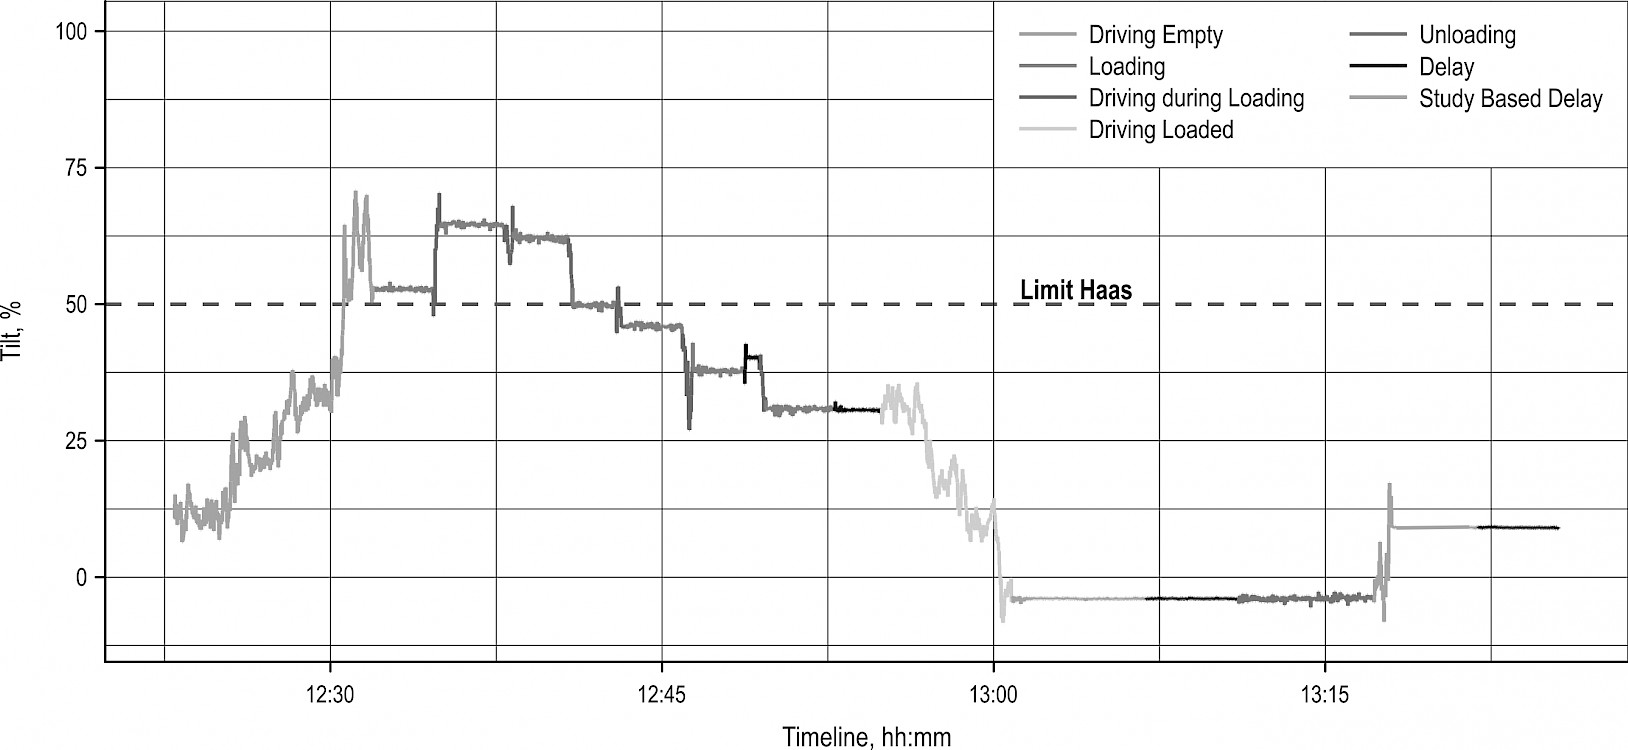
Fig. 14 Machine tilt of John Deere 1210E for a selected cycle
3.4 Cable tensile force and its dependencies
In Komatsu 840TX data, the evidence of a relationship between tensile force and machine tilt could not be encountered (Fig. 15B). However, for John Deere 1210E, it did appear that the tensile force is significantly increasing with increasing machine tilt (Fig. 15A). This is because the operator sets the tensile force to his needs and can change this setting during operation. In this case, it seems that the operator of Komatsu 840TX did not change tensile force setting regardless of whether the machine tilt was high or low. In opposite, John Deere 1210E operator adapted the tensile force to the current working conditions based on his feeling.
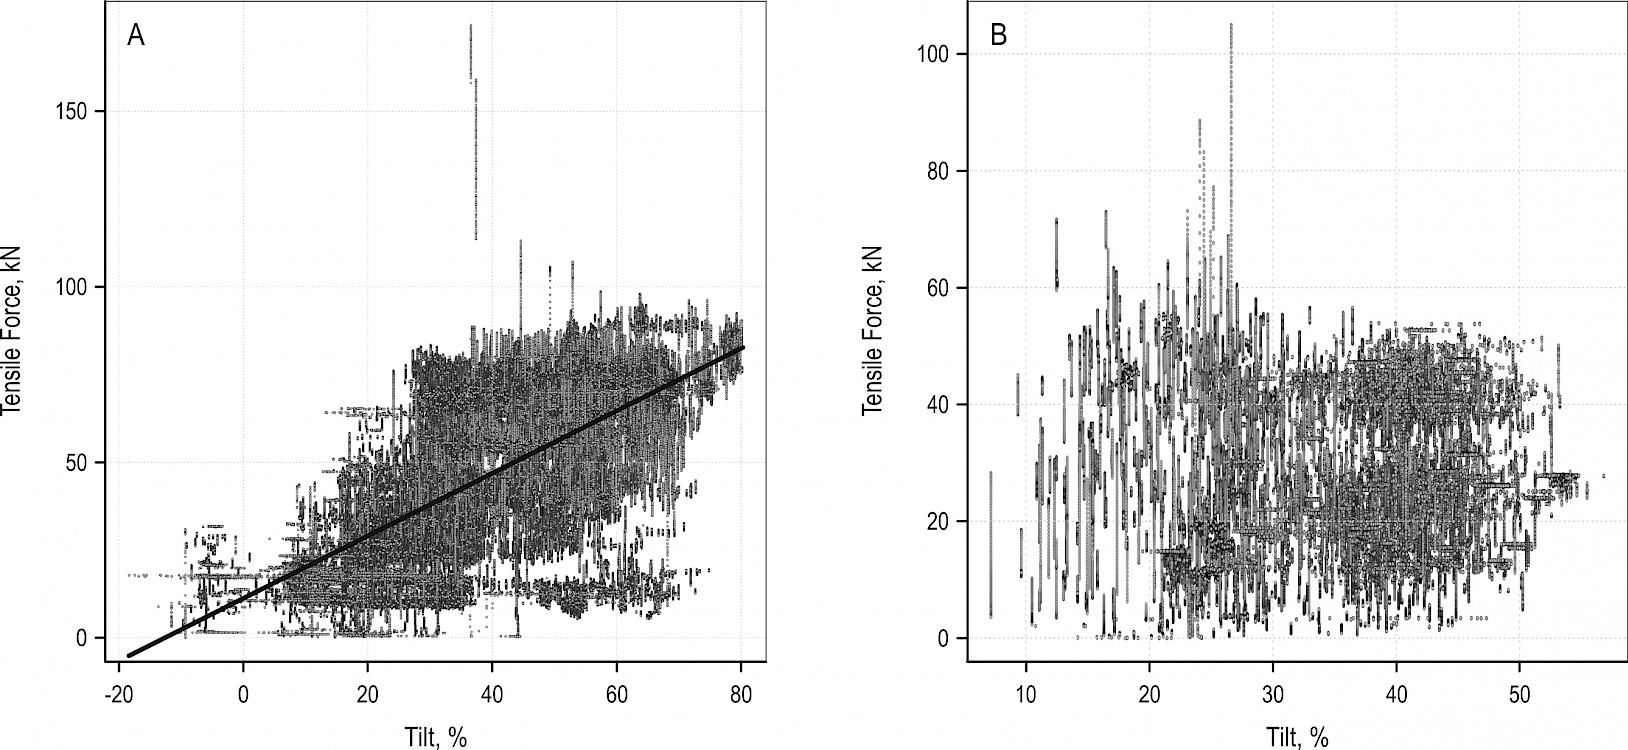
Fig. 15 Tensile force depending on machine tilt for John Deere 1210E (A) and Komatsu 840TX (B)
For both machines, the ANOVA showed a significant effect of machine tilt and work elements on tensile force (p <0.001). However, when looking at the sum of squares (Sum Sq), it can be seen that the work elements have little influence on John Deere 1210E, while the machine tilt has only little influence on Komatsu 840TX (Table 8). A regression analysis was carried out to determine the coefficients to estimate the tensile force, whereas the variables with little influence were excluded (Table 9). The results show that, for John Deere 1210E, 58% of the variation in tensile force can be explained by machine tilt (R2=0.58), and for Komatsu 840TX, 10% of the variation can be explained by work elements (R2=0.10).
Table 8 Results of the ANOVA for investigating the effect of machine tilt and work elements on tensile force of John Deere 1210E and Komatsu 840TX
|
Variable |
Df |
Sum Sq |
Mean Sq |
F value |
Pr(>F) |
|
John Deere 1210E |
|||||
|
Machine Tilt |
1 |
1 548 819 226.0 |
1 548 819 226.0 |
6 189 444.5 |
<0.001 |
|
Work Elements |
4 |
70 380 736.8 |
17 595 184.2 |
70 314.5 |
<0.001 |
|
Residuals |
4 274 066 |
1 069 523 372.6 |
250.2 |
||
|
Komatsu 840TX |
|||||
|
Machine Tilt |
1 |
310 950.2 |
310 950.2 |
2510.3 |
<0.001 |
|
Work Elements |
4 |
15 657 475.1 |
3 914 368.8 |
31 601.1 |
<0.001 |
|
Residuals |
115 892 |
143 512 529.7 |
123.9 |
||
Table 9 Coefficients to calculate tensile force
|
Variable |
Estimate of Coefficient |
Standard Error of Estimate |
t-value |
p-value |
Adjusted R2 |
|
John Deere 1210E |
|||||
|
Intercept |
11.20 |
0.0147 |
769.6 |
<0.001 |
0.58 |
|
Machine Tilt |
0.89 |
0.0004 |
2409 |
<0.001 |
|
|
Komatsu 840TX |
|||||
|
Intercept |
40.08 |
0.0382 |
1049.4 |
<0.001 |
0.10 |
|
Loading (factor) |
–12.34 |
0.0410 |
–300.9 |
<0.001 |
|
|
Driving during Loading (factor) |
–7.55 |
0.0460 |
–164.1 |
<0.001 |
|
|
Driving Loaded (factor) |
–14.70 |
0.0518 |
–284.1 |
<0.001 |
|
|
Unloading (factor) |
–12.40 |
0.0449 |
–276.4 |
<0.001 |
|
4. Discussion
Pit-to-peak amplitudes of 50 kN within a few centiseconds lead to the conclusion that measurement rates of 5 Hz, which were e.g. used by Schaare et al. (2016), might not be able to detect all peaks. This can be clearly seen in Fig. 9, where a measurement rate of 4 Hz is shown by real data. With this measurement rate, the mean tensile force depending on work element would perhaps be the same as with a measurement rate of 100 Hz, but there would be a loss of information about the amplitude and duration of peaks and pits. As during this study, only a few amplitudes with the duration of 1 cs were measured, it can be assumed that peaks can also occasionally occur even within a shorter time. So, for further investigation, it would be recommended to use a measurement rate of at least 100 Hz.
The analysis also showed that 90% of the pit-to-peak amplitudes ≥20 kN occurred during driving activities and that amplitudes during driving activities were significantly higher than during loading activities. Especially during driving activities, the operator should try to avoid mistakes and pay a lot of attention not to exceed SWL.
In New Zealand, SWL is at 33% of the cable MBS (SF=3) (MBIE 2012). If assuming this value for the present study, tensile force for John Deere 1210E would be 16.5% above SWL (SF=3). In order to fulfil such a regulation some manufacturers, especially in Europe, would have to adjust their winches to be able to comply with a SF of three. This means that they would have to decrease the maximum pulling force of the winch or increase the diameter of the steel cable.
There are no published international regulations on SWL for winch-assisted machinery, but the actual draft version of ISO 19472-2 has a SF of two. Different to the findings of Holzleitner et al. (2018) and Mologni et al. (2018), the tensile force in this study exceeded SWL (SF=2). As this was only for a really short time, a SF of two would be in practice well suitable for wheeled machines.
This conclusion is based on the fact that SWL with a SF of two was exceeded only two times during four days of observation. One time the tensile force was only 2 kN above SWL (SF=2) and the second time a mistake of the operator led to the exceeding of SWL (SF=2) and the subsequent failure of the cable approximately 15 m away from the anchor without touching any obstacle. In this case, the machine was moving loaded downhill at a machine tilt of about 38%. The engine speed was too low and, therefore, the winch was not able to work correctly, so the machine was pulling on the cable until it broke. To avoid such situations, manufacturers have to improve the technical function of winches.
Although fatigue life of steel wire ropes can be reduced by repeated axial stresses (Hobbs and Raoof 1996), this can be neglected here because mean amplitudes in tensile force are too low to reduce lifetime of the cable substantially. Lifetime can be much more reduced by abrasive wear (de Silva and Fong 2002), for example due to grinding the steel cable over obstacles or by bending loads (Giglio and Manes 2005) caused through, for example, leading the rope over small sheaves. The latter are often an integral part of traction winches.
Although there are manufacturer’s limits for the maximum inclination of wheeled winch-assisted machinery (for example 50–55%), contractors tend to work above these limits as shown by this study and many others (eg. Visser and Berkett 2015, Holzleitner et al. 2018, Mologni et al. 2018). The reason why some manufacturers set limits so low is the exclusion of liability in case of an accident. Under good ground conditions, winch-assisted machinery can work safely on slopes of up to at least 70%. As such, to profit from the advantages of winch-assisted forwarders, it should be possible to evaluate hazards and environmental impacts and decide up to which limit it is possible to work at every operation site independently.
5. Conclusions
This study presents the first detailed analysis of peaks and pits in tensile force of two winch-assisted forwarders. An operator error caused the highest peak with 174.5 kN. Except for this mistake, the safe working load, considering a safety factor of two, was slightly exceeded only once. The detailed analysis shows that peaks with an amplitude of up to 50 kN can occur within a few centiseconds and that amplitudes of peaks are significantly higher during driving activities than during loading activities. Based on this study, there are no safety concerns related to the exceeding of SWL of winch-assisted forwarders, if the machine is operated correctly and technical functionality of the winch is provided.
Technically, with winch-assisted machinery, an operation is possible on slopes of up to 70% or even more, but from an ecological point of view this should be critically scrutinized. Although winch-assisted machinery nowadays is often used in steep terrain, the original intention of this technology was to decrease soil damages caused by driving. So, to assess the ecological impacts, further studies on winch-assisted machinery under real working conditions should be made to determine the possible reduction of slippage and soil damage.
Acknowledgements
The research leading to these results has received funding from the TECH4EFFECT project funded under the Bio Based Industries Joint Undertaking under the European Union's Horizon 2020 research and innovation program [grant number 720757]. For the support during the project, we want to thank the contractor Huber & Tazreiter and the Austrian Federal Forests (Österreichische Bundesforste AG) as well as Norbert Höller for technical support with the database, Friedrich Zott for technical support with the measurement equipment, Phillip Gruber for assistance during field studies and Rien Visser for proofreading. In addition, we also would like to thank the landowners for enabling field work.
6. References
Axelsson, S.Ă., 1998: The mechanization of logging operations in Sweden and its effect on occupational safety and health. International Journal of Forest Engineering 9(2): 25–31. https://doi.org/10.1080/08435243.1998.10702715.
Bell, J.L., 2002: Changes in logging injury rates associated with use of feller-bunchers in West Virginia. Journal of Safety Research 33(4): 463–471. https://doi.org/10.1016/S0022-4375(02)00048-8
Cavalli, R., Amishev D., 2017: Steep Terrain Forest Operations – Challenges, Technology Development, Current Implementation, and Future Opportunities. Proceedings of the Joint Regional Meeting of IUFRO, Matsuyama and Kochi (JPN), Jul 24–28, 2017, 41–50 p.
de Silva, A.R.T., Fong, L.W., 2002: Effect of abrasive wear on the tensile strength of steel wire rope. Engineering Failure Analysis 9(3): 349–358. https://doi.org/10.1016/S1350-6307(01)00012-7
Drews, E.S., Hartsough, B.R., Doyal, J.A., Kellogg, L.D., 2001: Harvester-forwarder and harvester-yarder systems for fuel reduction treatments. Journal of Forest Engineering 12(1): 81–91. https://doi.org/10.1080/08435243.2001.10702766
Giglio, M., Manes, A., 2005: Life prediction of a wire rope subjected to axial and bending loads. Engineering failure analysis 12(4): 549–568. https://doi.org/10.1016/j.engfailanal.2004.09.002
HAAS Maschinenbau GmbH & Co. KG, 2011: Bedienungsanleitung fo JD Harvester mit HAAS-Traktionshilfsseilwinde (User manual for JD Harvester with HAAS traciton aid winch), 32 p.
Heinimann, H.R., 1999: Ground-based harvesting systems for steep slopes. In Proceedings of the International Mountain Logging and 10th Pacific Northwest Skyline Symposium, J. Sessions and W. Chung (eds.), Corvallis OR, March 28–April 1, 1999, p. 1–19. Department of Forest Engineering. Oregon State University. Corvallis, OR 97331
Hobbs, R.E., Raoof, M., 1996: Behaviour of cables under dynamic or repeated loading. Journal of Constructional Steel Research 39(1): 31–50. https://doi.org/10.1016/0143-974X(96)00028-4
Holzfeind, T., Stampfer, K., Holzleitner, F., 2018: Productivity, setup time and costs of a winch-assisted forwarder. Journal of Forest Research 23(24): 196–203. https://doi.org/10.1080/13416979.2018.1483131.
Holzleitner, F., Kastner, M., Stampfer, K., Höller, N., Kanzian, C., 2018: Monitoring cable tensile forces of winch-assist harvester and forwarder operations in steep terrain. Forests 9(2): 53. https://doi.org/10.3390/f9020053.
Jackson, B.D., Stokes, B.J., 1990: Low-impact harvesting systems for wet sites. In: Coleman SS, Neary DG, editors. Proceedings of the Sixth Biennial Southern Silvicultural Research Conference; October 30–November 1, Memphis (TN), 701–709.
Komatsu, 2015: Mehr Sicheheit: Grundlagen und Tipps fuer den sicheren und praxisnahen Einsatz Ihrer Komatsu Forstmaschine (More safety: Basics and tips for the safe and practical use of your Komatsu forest machine), 27p.
Lindroos, O., La Hera, P., Häggström, C. 2017: Drivers of advances in mechanized timber harvesting – a selective review of technological innovation. Croatian Journal of Forest Engineering 38(2): 243–258.
MBIE, 2012: Approved Code of Practice for safety and health in forest operations. Ministry of Business, Innovation & Employment, Wellington (NZ), 134 p.
McKenzie, D.W., Richardson, B.Y., 1978: Feasibility study of self-contained tether cable system for operating equipment on slopes of 20 to 75%. Journal of Terramechanics 15(3): 113–127. https://doi.org/10.1016/0022-4898(78)90015-0.
Mologni, O., Dyson, P., Amishev, D., Proto, A.R., Zimbalatti, G., Cavalli, R., Grigolato, S., 2018: Tensile Force Monitoring on Large Winch-Assist Forwarders Operating in British Columbia. Croatian Journal of Forest Engineering 39(2): 193–204.
Niemistö, P., Kopunen, H., Laurèn, A., Salomäki, M., Uusitalo, J., 2012: Impact and productivity of harvesting while retaining young understorey spruces in final cutting of downy birch (Betula pubescens). Silva Fennica 46(1): 81–97. https://doi.org/10.14214/sf.67
Oberer, F., 2012: Symbiose aus Rad und Seil (Symbiosis of wheel and cable). Wald Holz 1: 28–30.
Salsbery, B.P., Hartsough, B.R., 1993. Control of a cable-towed vehicle to minimize slip. Journal of terramechanics 30(5): 325–335. https://doi.org/10.1016/0022-4898(93)90009-M
Schaare, R., Hunter, H., Visser, R., 2016: Tension Monitoring of Cable-assisted Felling Machines. Harvesting Report H028, Future Forest Research Limited: Rotorua, New Zealand. 17 p.
Sessions, J., Leshchinsky, B., Chung, W., Boston, K., Wimer, J., 2017: Theoretical stability and traction of steep slope tethered feller-bunchers. Forest Science 63(2): 192–200. https://doi.org/10.5849/forsci.16-069.
Stampfer, K., Visser, R., Kanzian, C., 2006: Cable corridor installation times for European yarders. International Journal of Forest Engineering 17(2): 71–77. https://doi.org/10.1080/14942119.2006.10702536
Spinelli, R., Magagnotti, N. 2011: The effects of introducing modern technology on the financial, Labour and energy performance of forest operations in the Italian Alps. Forest Policy and Economics 13(7): 520–524. https://doi.org/10.1016/j.forpol.2011.06.009
Visser, R., Stampfer, K., 2015: Expanding ground-based harvesting onto steep terrain: a review. Croatian Journal of Forrest Engineering 36(2): 321–331.
Visser, R., Berkett, H., 2015: Effect of terrain steepness on machine slope when harvesting. International Journal of Forest Engineering 26(1): 1–9. https://doi.org/10.1080/14942119.2015.1033211
Weise, G., 2016: Traktionshilfswinden – Besser im Hang (Traction aid winches – better on slopes). Forsttechnische Informationen 5: 7–14.
Wuertz, D, Setz, T, Chalabi, Y, 2017: timeSeries: Rmetrics – Financial Time Series Objects. R package version 3042.102. https://CRAN.R-project.org/package=timeSeries.
© 2018 by the authors. Submitted for possible open access publication under the
terms and conditions of the Creative Commons Attribution (CC BY) license (http://creativecommons.org/licenses/by/4.0/).
Authors’ addresses:
Thomas Holzfeind *
e-mail: thomas.holzfeind@boku.ac.at
Christian Kanzian, PhD
e-mail: christian.kanzian@boku.ac.at
Prof. Karl Stampfer, PhD
e-mail: karl.stampfer@boku.ac.at
Franz Holzleitner, PhD
e-mail: franz.holzleitner@boku.ac.at
University of Natural Resources and Life Sciences
Department of Forest and Soil Sciences
Instiute of Forest Engineering
Peter-Jordan-Straße 82/3
A-1190 Vienna
AUSTRIA
* Corresponding author
Received: January 16, 2019
Accepted: May 15, 2019
Original scientific paper