
What Do We Observe When We Equip a Forestry Crane with Motion Sensors?
doi: https://doi.org/10.5552/crojfe.2019.501
volume: 40, issue:
- Author(s):
-
- La Hera Pedro
- Ortiz Morales Daniel
- Article category:
- Original scientific paper
- Keywords:
- hydraulic forestry manipulator, data analytics, motion sensors, trajectory planning, boom-tip control, forestry crane joystick control, motion optimization, human-generated motion
Abstract
HTML
Forestry machines have the power to efficiently move very heavy loads, but they are not very smart at communicating information, especially information regarding motion. Understanding how a system produces motion is one of the main stepping stones towards the world of automation. However, to acquire motion data requires sensor hardware that is not largely available in forestry machines today. As a result, at the moment there is no motion data analysis for forestry machines. Therefore, the objective of this article is to present this data, and discuss how we can use such data in regards to technology development. To this end, we have equipped a commercial forestry machine with state-of-the-art sensors and a data acquisition unit. Our aim is to understand what possibilities exist for automation, when we analyze how machine operators control forestry cranes. Among our objectives is to show how motion data can: a) give a better comprehension of the way forestry operators control cranes, b) be useful to analyze crane motion patterns, and c) show additional information that can be estimated via mathematical algorithms. The topics we cover only touch the surface of future applications, where sensor data analysis will be able to team up with other technologies to improve operator’s work, including automation, decision making, motion optimization, and operators’ training, just to mention some.
What Do We Observe When We Equip a Forestry Crane with Motion Sensors?
Pedro La Hera, Daniel Ortiz Morales
https://doi.org/10.5552/crojfe.2019.501
Abstract
Forestry machines have the power to efficiently move very heavy loads, but they are not very smart at communicating information, especially information regarding motion. Understanding how a system produces motion is one of the main stepping stones towards the world of automation. However, to acquire motion data requires sensor hardware that is not largely available in forestry machines today. As a result, at the moment there is no motion data analysis for forestry machines. Therefore, the objective of this article is to present this data, and discuss how we can use such data in regards to technology development. To this end, we have equipped a commercial forestry machine with state-of-the-art sensors and a data acquisition unit. Our aim is to understand what possibilities exist for automation, when we analyze how machine operators control forestry cranes. Among our objectives is to show how motion data can: a) give a better comprehension of the way forestry operators control cranes, b) be useful to analyze crane motion patterns, and c) show additional information that can be estimated via mathematical algorithms. The topics we cover only touch the surface of future applications, where sensor data analysis will be able to team up with other technologies to improve operator’s work, including automation, decision making, motion optimization, and operators’ training, just to mention some.
Keywords: hydraulic forestry manipulator, data analytics, motion sensors, trajectory planning, boom-tip control, forestry crane joystick control, motion optimization, human-generated motion
1. Introduction
Sensors and data analytics form a combination of hardware and software that have become essential technologies of our modern world. Just an average phone contains today a variety of sensors and software applications helping companies better analyze human motion and behavior. In the same way, sensing technology and data analytics help various industries to get insights into information that is not obvious with the naked eyes.
Automation is one of the fields where the major success relies on sensing technology. Robotics, among many other fields of automation, has seen a substantial increase in the need for sensors and data analytics to seek for new tasks that can benefit from automation. Repetitive motion is an example of such tasks, which we see performed by people when they monotonously execute some given work, as for example, in factories, operating machines, driving vehicles, moving objects, etc. Analyzing motion in itself is a research area finding application in various fields. From healthcare, biomechanics, to robotics, understanding how motion is performed has evolved into a variety of mechatronic devices automating complex actions that were once only performed by humans (Siciliano and Khatib 2016).
Just like any other industry, forestry continues to be radically altered by technology. To date, harvester and forwarder have been two important machines for Scandinavian forestry (Nurminen et al. 2006, Eriksson and Lindroos 2014). The former cuts trees into round-wood logs of specified lengths, while the latter transports logs out of the harvesting site – a working method known as cut-to-length. To perform this work, these machines use large hydraulic manipulators, known as cranes. To control these cranes, as well as the machine, operators use joysticks sitting inside the cabins. The problem, however, is that a machine operator sitting for an eight-hour shift faces a number of potential productivity-busters. One example is the complex coordination required to seamlessly produce the crane or vehicle motions using joystick commands. Precise control of the many crane links usually requires a series of expertly coordinated actions that can prove tiring over time (Häggström and Lindroos 2016). Today, the commercially available control technology is unintuitive to humans, because it involves controlling each cylinder of the machine separately. In view of this, machine manufacturers have started leaning towards the idea of smart forestry machines as a technology that can tackle questions about increased productivity and efficiency, and go beyond the limitation of human abilities (Lindroos et al. 2017).
An example technology related to automation of forestry machines is the computer-assisted support to operate cranes (Westerberg 2014). Technology of this kind involves using robotics software to help operating machines and has the objective to simplify the complex control related to operating forestry cranes, reaching an improved partnership between man and machine. For instance, joystick input commands such as up-down and left-right are more intuitive to humans than controlling each cylinder separately. Along this line of technology, an example is what became known as the intelligent boom-tip control, a control software technology where the operator controls directly the motions of the gripper or harvester head, instead of each cylinder – just like humans think about controlling their hands, rather than individually deciding how to move the elbow, shoulder, and wrist. In literature, there is an entire body of work addressing the development of boom-tip control methods. A comprehensive summary with the most advanced developments can be found in Westerberg (2014), and the references therein. In industry, a basic boom-tip control software for forwarder and harvester machines are now part of the automation products of the company John Deere (International forest industries 2013). Additionally, there are plenty of smaller consultancy firms providing similar solution around Scandinavia (Technion 2017).
One of the problems in this line of work is that despite the amount of publications on the topic of upgrading crane control via automation, there is no much information about the tools or methods involved in it, and what this technology could represent for forestry in general. In most publications, we find theoretical developments showing algorithms capable of doing tip-control, or some other automation features, but no explanations about the technologies that are relevant to physically implement said algorithms on machines. This information is important, because the fundamental technology of automation involves gathering data using sensors and performing data analysis. Data analysis of crane motions has the potential to provide information to a larger set of applications in the forestry industry. Understanding the data obtained from sensors is equally important as to understand what features could be developed afterward. Therefore, the correlation of this statement with the title: What can we observe when we equip a forestry crane with motion sensors? results in understanding that there is more than just automation when using sensors in forestry machines.
1.1 Problem Formulation
1.1.1 Use of motion data in forest industry
In Nordic countries, most of the forestry operations are executed using forestry machines. Maneuvering the crane constitutes the major part of the work for a machine operator. Understanding how operators produce crane motions is an important step towards advanced automation, particularly because logging is a pick-and-place operation, which should involve monotonous and repeatable motion patterns. Unlike the case of the intelligent boom-tip control described earlier, advanced automation refers to the case when entire pick-and-place log cycles are performed autonomously, but using human supervision. In robotics, motions to accomplish these tasks are often performed by imitating human recorded data.
In forestry itself, the usual method to analyze motion is by measuring the cycle times it takes to load trees. To this end, there are plenty of methods, ranging from manual (Nurminen et al. 2006), to automatic (Palander et al. 2013). This information is used for various ends, such as comparing machine designs/performance, comparing working methods, developing simulators, providing guidance to operators, or to plan forestry operations, just to mention some examples. The problem, however, is that time alone is not capable of providing sufficient information about movement, because motion is a dynamic phenomenon involving, as minimum, positions, velocity, acceleration, and forces. Certainly, using time alone as a factor for making these various decisions cannot lead to optimal results, and it provides insufficient information for the development of automation technology.
1.1.2 Purpose of this article
In view of this, the purpose of this article is to show the information obtained from motion sensors in forestry cranes, and show how this information can be used for analysis before taking steps towards automation. The focus is placed on the work of forwarder operators, and three analyses are presented. Our first analysis follows a modern analytical method used to observe whether or not machine operators control cranes using monotonous and repetitive movements. The second analysis shows how sensor data can be used to track log positions. The third analysis shows how this information can be used to present some brief concepts of automation.
However, we would like to emphasize that the analysis we present is not extensive, because the purpose is to highlight some of the key aspects of motion data analysis. Interested readers can find more complete examples of how we have used similar data in the area of robotics (La Hera and Morales 2015), machine learning (Ortiz Morales et al. 2014), and automatic analysis of human-operator performance (Morales et al. 2015), which are research results that include other development cases.
2. Materials and Methods
2.1 Materials
2.1.1 Experimental Setup
The machine used in this study is a Komatsu Forwarder 830 (Komatsu Forest AB 2011). This machine uses a crane CRF 5.1 from CRANAB (Cranab AB 2016) with a maximum length of 9.3 m. The crane itself is equipped with a G28 grapple, which rotates via a G121 hydraulic motor from Indexator (Indexator Rotator Systems 2011).
To gather data, we equipped the crane with motion sensors at every joint, i.e. four joints, as it is specified in Fig. 1. These sensors were installed externally, by adding static metallic holders in the frames of the joints. The sensors are quadrature encoders, a standard choice in the robotics and automation industry. The particular brand of these sensors is Heidenhain, with item number ROD 426−5000. They provide a measurement resolution of 5000 pulses per revolution, meaning that they can measure as low as 0.072 degrees (0.0012 rad) for the angular joints and 0.0007 m (0.7 mm) for the telescope. We also installed a real-time data acquisition unit (DAQ) able to record signals at a frequency of 1 Khz (1000 recordings every second). The sensors and the DAQ work in parallel to the Komatsu system, meaning that they have no interference with the regular machine operation.

Fig. 1 Forwarder crane; it is a hydraulic manipulator with four degrees of freedom, specified in this graph as the slewing , inner boom , outer boom , telescope ; it holds an end-effector attached at the boom-tip, serving as a tool to grab logs, also called gripper; including all electronic hardware, this particular experimental platform is the predecessor of a current commercial product of one of our companies (Cranab AB 2011)
2.1.2 Operators and terrain
The company Sveaskog (Sveaskog 2006) – the largest forest owner in Sweden – provided help contacting machine operators for this study. The work took place in a clear-cut area, where the machine needs to collect logs from the forest to the road site. In the present text, the data of two operators are examined, because in regards to automation there is no necessity for more to understand the actions of humans to operate a machine. According to research in haptic control, the patterns – seen as the specific actions of the hands operating joysticks – to control machines become correlated among people (Srimathveeravalli et al. 2006), even though some operators seem to do it better than others. In the remaining article, the operators under the study are referred to as operator-Y and operator-O, corresponding to younger (Y) and older (O). Between these operators, there is a difference of 15 years in experience. The younger operator had 5 years of experience.
2.1.3 Measurements and operator’s settings
To correctly characterize motion, data of both positions and velocities are needed. To express their magnitude, international units are used in this article, i.e. joint angles in radians (rad), telescopic displacement in meters (m), and time in seconds (sec). Adopting the reference frame presented in Fig. 1, the measurement of joint motion can be defined by the vector of generalized coordinates , orderly denoting the slewing, inner boom, outer boom, and telescope. Similarly, a vector of generalized velocities can be defined as .
An important observation is that, in general motion, sensors are capable of measuring position , but not velocity . Therefore, velocities are usually numerically estimated from sampled position data (Khalil 2002). To this end, the method known as Algebraic-Derivative estimation was applied, as it is a very robust and modern method of numerical differentiation for sampled data in modern robotics (Mboup et al. 2009). However, other approaches can provide similar estimation, as for example the standard Kalman filter (Belanger et al. 1998). In the case of automation, having information about velocity is perhaps more important than position data alone. For a forestry machine, velocities give an indication of how the machine operator uses the joysticks to affect the cylinders’ velocities. The velocities also reveal software properties, in the sense that it shows what the software of the manufacturer might be doing to the joystick signals. All these will be explored later in the article.
2.2 Methods
The task of planning a collision-free trajectory from a start to a goal position is fundamental in the field of automation. Although motion planning has been extensively investigated since the beginning of robotics, there is neither a standard algorithm providing the best possible solution, nor an agreement on how to measure the performance of a computer generated motion. The problem lays in the redundancy of degrees of freedom, which allow an infinite number of motions to accomplish similar behavior. Therefore, whether a motion planner performs well or not is subjective and depends on a variety of factors. These factors are related to the task for which the method is being used, and the performance metric applied in the motion planning algorithm.
Similarly, human operated machines for pick-and-place actions fall in a similar category, where the human operator is the motion planner. In any industrial field, there are no exact rules as to how a human operator should efficiently operate a machine. Forestry cranes, in particular, have endless ways to be controlled, and there is no ideal way to assess the performance of human operators from an engineering standpoint, or to draw comparisons against an ideal case. It is also not possible to seamlessly compare two machine operators, because they might be planning motions according to different criteria: one might be planning motions to work as fast as possible, while the second might be planning motions to work at optimal energy.
To learn how to operate a forestry machine, there are guidelines that instructors provide during schooling time. Nevertheless, over the years, machine operators individually evolve to a level that they find sufficient to achieve satisfactory work. Later on, they repeat that method of work monotonously, because logging tasks do not vary largely. The guidelines provided by instructors involve two aspects: 1) How is the log-bunk positioned in relation to the logs, 2) How to use the crane links to achieve motion patterns leading to »what they believe« are energy efficient actions. Time efficiency is a result of properly coordinating these actions.
2.2.1 Log bunk positioning

Fig. 2 Left: driver’s view and machine placing with respect to the logs; Right: crane boom-tip motion patterns for grabbing and releasing trees; 1) Retracting path to the load bunk; 2) Expanding path from the load bunk (in these figures, the paths are drawn as examples to show the direction of the motion; usually the retracting path is higher than the expanding path, because the crane needs to avoid hitting the log-bunk when holding logs; the expanding path, however, can be much lower, because the crane can go back to the side crossing through the empty spaces between the log-bunk poles)
Visualizing logs from a cabin is simple to the left and to the right of the machine. Therefore, the log-bunk is placed nearly perpendicular to the logs to reach optimal visibility, i.e. 90 degrees from the line of sight to the logs. This is represented by the Y-axis in the left of Fig. 2. The field of vision for the operator is obstructed in the direction of the log-bunk, i.e. the X-axis in the left of Fig. 2. Generally, the crane will attempt to grab logs located half distance to its maximum length, because this is when it has enough lifting force to move logs. For instance, if the length of our crane is 9.3 meters in total, most of the grabbing action should happen between 4 to 6 meters from the machine.
To understand how machine operators position the machine with respect to logs, we can use data of the boom-tip position when it is grabbing logs. Mathematically, the boom-tip position (see Fig. 1) can be calculated from joint measurements (see the right of Fig. 2). Therefore, one of the most accurate methods for estimating where the logs are grabbed is using joint sensors data. Information of this kind is not available today, but the ways to use such data in automation is relevant both for harvester and forwarder machines. For instance, this data enables the possibility to automate navigation (Ringdahl et al. 2011), automate the crane pick-and-place operation, perform highly accurate automatic time studies, reconstruct the work in virtual environments, and perform automatic forest operation planning. A more complete explanation of the reasons why such data is important is given by Lindroos et al. (2015).
Since we do not use a GPS system, our work will be limited to show the log positions with respect to the machine, despite the fact that the machine moves from place to place to pick up logs.
2.2.2 Crane motion patterns
Four different motion patterns are recognized for loading and unloading logs. Considering the sketch in the right of Fig. 2, these motions are defined by the traveling of the boom-tip for expanding or retracting the crane, occurring either to the right or to the left of the vehicle.
Despite the simplicity of these movements, the real operator skill consists in synchronizing the independent boom joint movements presented in Fig. 1. However, performing this type of coordination is difficult, because for a given path (see the right of Fig. 2), there is not one, but infinite ways to synchronize the joints, all leading to similar behavior. Additionally, a given task can be accomplished with many different paths, speeds, accelerations, energy levels, etc. From all these possibilities, a machine operator must choose an appropriate, comfortable, and profitable way to perform such actions.
Here, our interest is to determine from data the repeatable motion patterns that cranes undergo during a working task. Finding repeatable motions can help assess the feasibility to automate this system. It is believed that, for a given machine operator, forwarding tasks follow monotonous pick-and-place actions, which happen through variations of similar crane motions, especially after some years of practice. These pick-and-place actions are the result of coordinating the crane motions, which should also be somewhat similar among operators.
In this article, the method to find repeatable motions involves trimming the data of joint positions according to the actions of expanding or retracting the crane (see the right of Fig. 2). Consequently, our method involves reparametrizing trajectories according to a monotonic increasing variable o than time. The reason to reparametrize data is because extracting the motions 1 and 2, shown in Fig. 2, usually leads to ununiformed data with different time, length, and so on. Data of this kind looks messy and does not provide information that is simple to understand, as we will see later. However, reparametrizing data allows its normalization in order to get deeper insight into what is truly happening. Normalization is standard in the fields of robotics and machine learning, and it is used to better interpret data. The normalized data also ease the ability to observe whether or not two different machine operators are handling the work nearly similarly, as should be the case. This fact cannot be easily determined from normal time data.
2.2.3 Effects of driver’s settings in crane performance
It has been indicated above that joystick signals are somewhat correlated to the velocities of the joints. Thus, joint velocities indicate how machine operators are using the joysticks. In relation to this, the settings defined by operators when working with these machines are a very important factor. To understand this, a task of controlling a forestry crane using joysticks should be considered. The joysticks must be moved to coordinate the crane and pick-and-place logs from the ground to the log-bunk in the machine. Moving the crane, however, is a difficult task for the hydraulic system. The crane is heavy and becomes heavier when holding logs. To produce motion, the cylinders need to push oil and produce great forces as soon as you start using the joysticks. However, this hydraulic process, and the speed at which it happens, causes oscillations that propagate from the cylinders to the whole machine, causing the crane and machine to bounce unwantedly. This causes two problems. First, there is a safety concern that the gripper might oscillate uncontrollably and hit the crane or other trees. Secondly, if the crane is freely bouncing, it is difficult to position the gripper and logs effectively, thus affecting time-performance. In addition, oscillations are generally bad for the human body (Häggström et al. 2016), and the durability of the machine.
The reasons for these oscillations have to do with physics. On one hand, when the crane moves, it exerts unwanted accelerations to the gripper, which hangs like a free pendulum. On the other hand, the hydraulic oil compresses with the movement, making cylinders behave similar to springs (Manring 2005). To tackle this problem, companies provide software restricting both the amplitude and the speed of the joystick signals. The settings for these are provided to operators as part of a user interface in the machine computer. Thus, to reduce oscillations, first operators set how fast each cylinder will move according to the amplitude of the joysticks. Setting these limitations makes the machine perform much slower of what it is capable of doing, but in good relation to velocities that humans can handle. Secondly, operators define filter profiles for the joysticks to smoothly initiate and stop each cylinder motion. Defining appropriate settings is a task that can take years of trial and error to do well. On the other hand, these settings are operator dependent, and therefore, estimating the machine production and operator’s efficiency becomes a very difficult task, because the control systems are heavily involved in the motion. As the settings are an important item in motion performance, its influence will be presented in section 3.
To give an idea of the crane limitations, Table 1 shows the limits of the joints, both in terms of angular position and velocity. The limitations in position are due to the cylinder maximum range. The values for velocities correspond to the maximum velocities cylinders are physically able to reach before operators define any settings. The velocity of the cylinder is allocated to how fast the hydraulic system is able to provide oil flow.
Table 1 Limits on joint positions and velocities
|
Link |
Min. position |
Max. position |
Min. velocity |
Max. velocity |
|
1 |
−3 rad |
3 rad |
−0.8 rad/s |
0.8 rad/s |
|
2 |
−0.4 rad |
1.5 rad |
−0.5 rad/s |
0.5 rad/s |
|
3 |
−3 rad |
−0.15 rad |
−0.8 rad/s |
0.8 rad/s |
|
4 |
0 m |
3.5 m |
−1.2 m/s |
1.2 m/s |
3. Results
The aim of this section is to present:
Þ how the operator positions the log-bunk for grabbing logs
Þ the crane motion patterns for performing the work
Þ the effects of computer settings on these motions
Þ a procedure to plan motions for the case of automation.
The data presented below corresponds to nearly 9000 observations for each machine operator, i.e. 9000 motions of pick-and-place logs. The figures, however, do not illustrate all of them, because they become difficult to visualize. Nevertheless, all calculations use the entire data sets.
3.1 Log bunk positioning
Fig. 3 shows an example of reconstructing motions of the crane in Cartesian Space (world coordinates) using a virtual simulator. As explained in section 2, to extract these motions, software was developed that automatically trims the recorded joint data. Consequently, the Cartesian motions were mathematically calculated using this data and the equations of the crane forward kinematics (Spong et al. 2006).
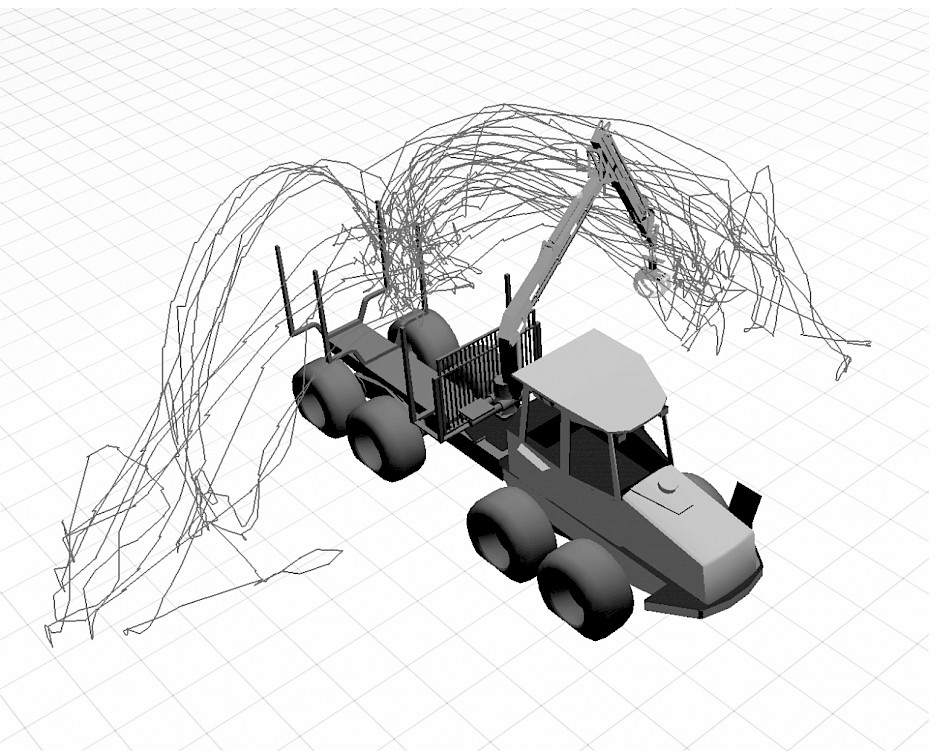
Fig. 3 Example of paths the boom-tip of the crane performs during work; this data was reconstructed using the recorded motion and additional formulas of forward kinematics, which interested readers can find readily available in (Mettin et al. 2009)
Reconstructing motions in Cartesian space allows calculating the coordinates where operators collected logs. This reconstruction is presented in Fig. 4, which shows how operators position the machine with respect to the logs they collect. The dots in Fig. 4 are the locations of the logs operators grabbed in different parts of the forest, but lumped in a single plot. As explained earlier, our machine is not equipped with GPS data to reconstruct the entire working scenario. Our interest is focused on the work with the crane and, therefore, the current data is sufficient for the purpose of this study. Other studies have shown how GPS data could be used for these purposes (Olivera et al. 2016). Nevertheless, locating the position of a system off-road is still a challenging subject in the field of robotics, requiring the combination of different technologies other than GPS.
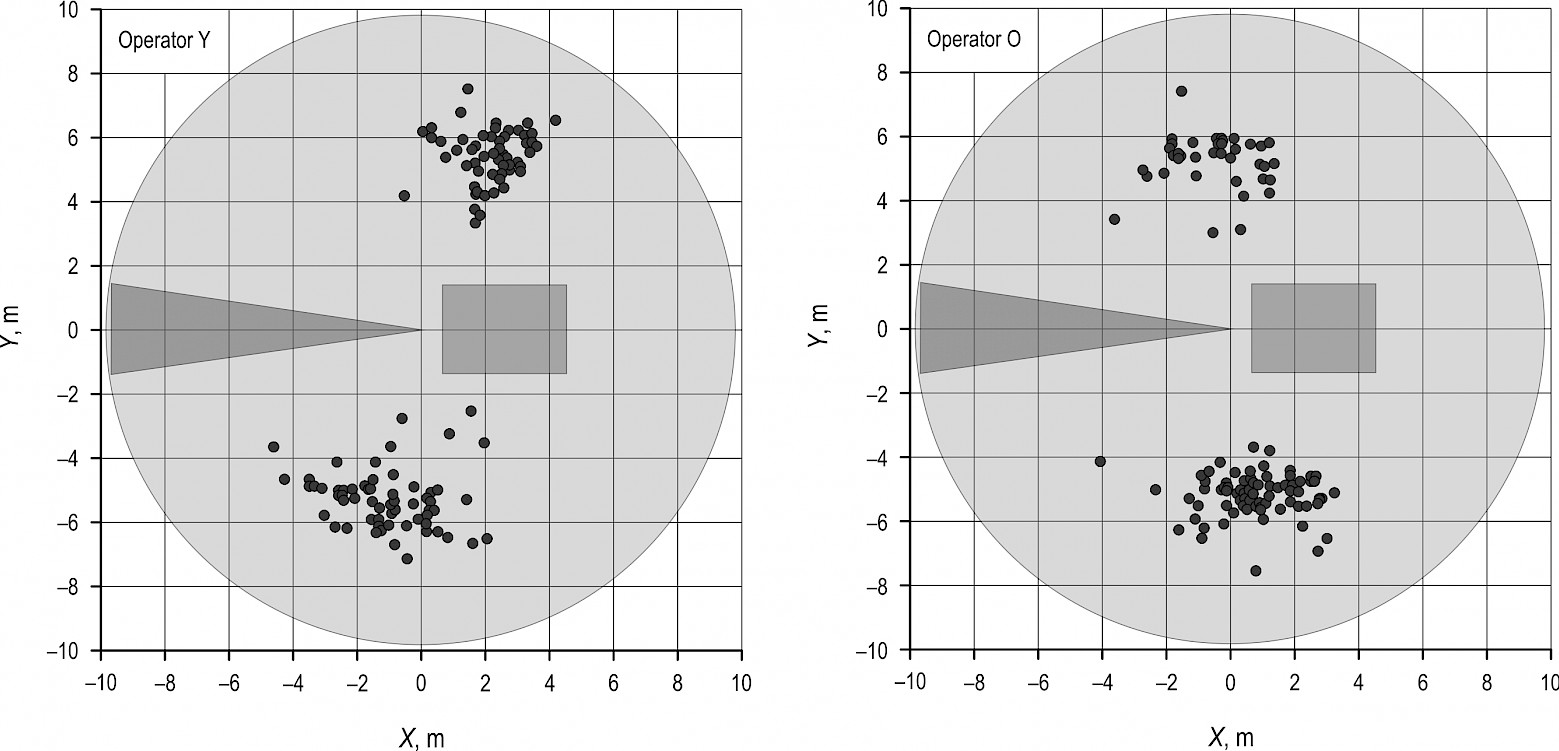
Fig. 4 Top view of the machine; the black dots represent the logs on level ground; the reference frame is centered as shown in Fig. 1; the positive y-axis represents the left side of the field of vision; the light gray area represents the coordinates that the crane can reach from its minimum to its maximum range (see Table 1); the dark gray area points to the coordinates that are unfeasible to reach; the gray rectangle represents the log bunk, with the cabin pointing to the left
3.2 Crane motion patterns
As observed in Fig. 2, two scenarios dominate the data: (1) the crane patterns to reach logs, and (2) the patterns to bring those logs back to the log-bunk. To show how this data looks like, we have developed a procedure to trim the data according to these actions. The parametrization explained in section 2 is done by using the boom-tip path curve length (see Fig. 2), since it is the only variable that monotonically increases or decreases along the motion. The curve length is found according to:
(1)
Where the values for ( , , ) can be numerically estimated from the Cartesian motions shown in Fig. 3. Since the curve length also varies according to individual motions, can be further normalized into a unity variable ranging from 0 to 1. To this end, a unity length reparametrization variable was proposed as:
(2)
Where points the last value of the curve length. To visualize both the standard trajectories and parametrized trajectories, the motions happening to the left of the vehicle are presented below.
3.2.1 Independent boom joint trajectory patterns for expanding the crane-tip
Fig. 5 and Fig. 6 show the trajectories of the independent boom joints for operator-Y and O correspondingly. In both cases, the left of these figures shows the independent joint trajectories after trimming the data. The right side of these figures shows the reparametrized version of the same data.
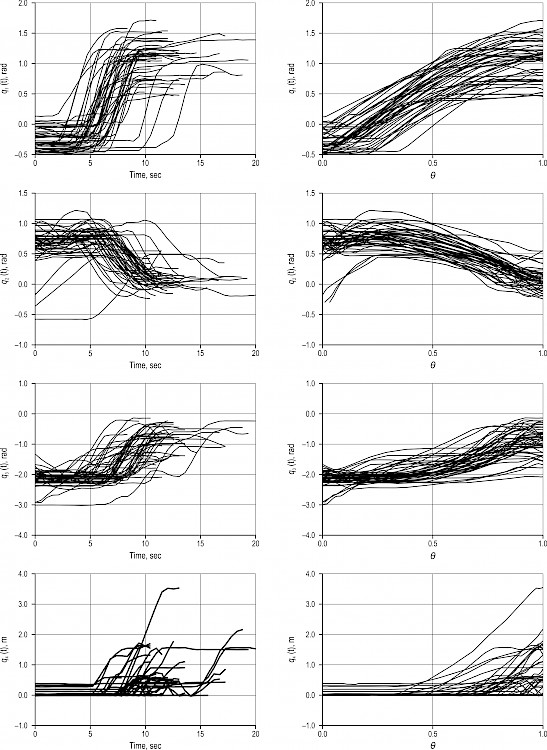
Fig. 5 Each of these plots refers to one joint in the crane (see Fig. 1); the final motion is for expanding the crane to reach logs to the left of the vehicle; this data is for the operator with less years of experience; the plots in the left side represent the joint motions with respect to time; the plots in the right side represent the joint motions with respect to the normalization variable ; this plot shows 200 data sets out of nearly 9000

Fig. 6 Each of these plots refers to one joint in the crane (see Fig. 1); the final motion is for expanding the crane to reach logs to the left of the vehicle; this data is for the operator with more years of experience; the plots in the left side represent the joint motions with respect to time; the plots in the right side represent the joint motions with respect to the normalization variable ; this plot shows 150 data sets out of nearly 9000
3.2.2 Independent boom joint trajectory patterns for retracting the crane-tip
Fig. 7 and Fig. 8 show the trajectories of the independent boom joints for operator-Y and O correspondingly. In both cases, the left of these figures shows the independent joint trajectories after trimming the data. The right side of these figures shows the reparametrized version of the same data.
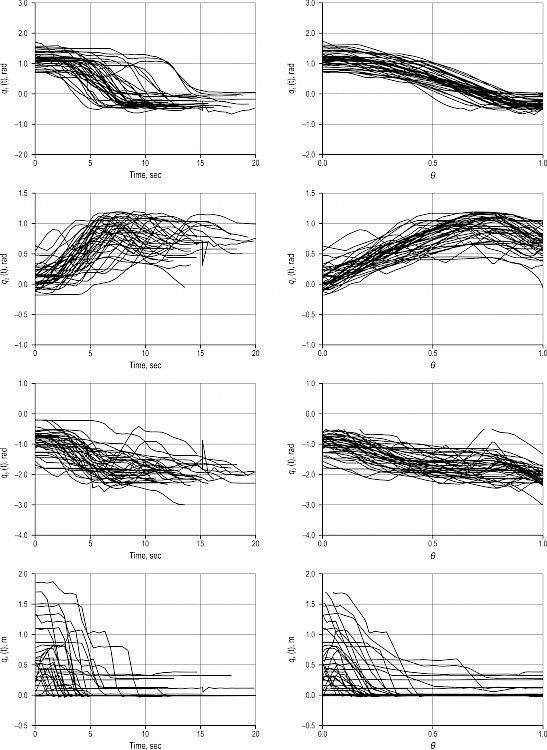
Fig. 7 Retracting motions from the left; crane independent boom joint movements for the operator with less years of experience; the plots in the left side represent the joint motions with respect to time; the plots in the right side represent the joint motions with respect to the normalization variable ; this plot shows 200 data sets out of nearly 9000
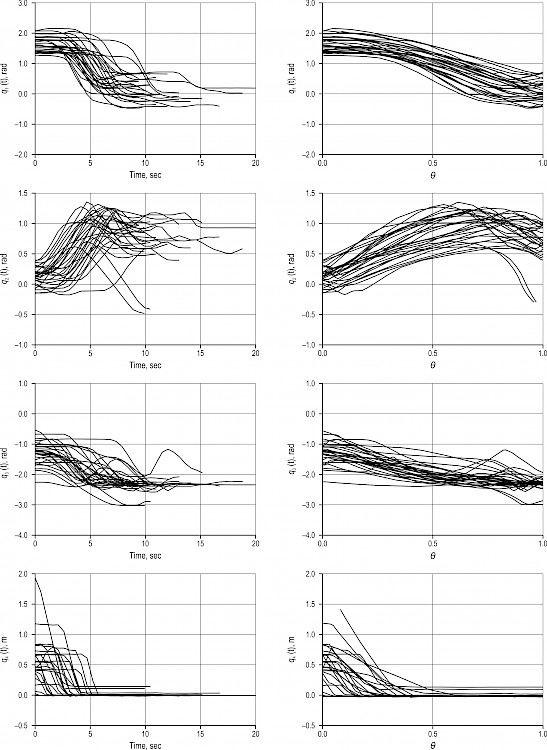
Fig. 8 Retracting motions from the left; crane independent boom joint movements for the operator with more years of experience; the plots in the left side represent the joint motions with respect to time; the plots in the right side represent the joint motions with respect to the normalization variable ; this plot shows 150 data sets out of nearly 9000
3.3 Crane velocities showing the effects of driver’s settings
Fig. 9 and Fig. 10 show the joint velocities of the independent boom joints for operator-Y and O correspondingly. In both cases, the left of these figures shows the independent joint velocities after trimming the data. The right side of these figures shows the reparametrized version of the same data.
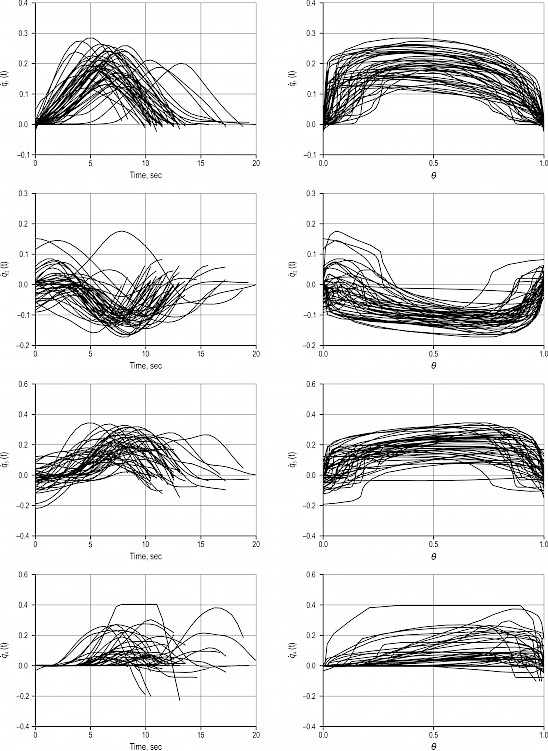
Fig. 9 Expanding motions to the left; crane independent boom joint velocities for the driver with less years of experience; the plots in the left side represent the joint velocities with respect to time; the plots in the right side represent the joint motions with respect to the normalization variable ; this plot shows 300 data sets out of nearly 9000

Fig. 10 Expanding motions to the left; crane independent boom joint velocities for the driver with more years of experience; the plots in the left side represent the joint velocities with respect to time; the plots in the right side represent the joint motions with respect to the normalization variable ; this plot shows 150 data sets out of nearly 9000
The normalized velocities show a clearer picture of the neighborhood where most of the velocity action takes place in both cases. An average of the maximum velocities that each degree of freedom undergoes during motions is shown in Table 2. This maximum average velocity refers to the highest peak (in case of positive) or lowest peak (in case of negative) of the bell shape-like trajectories observed in Fig. 9 and Fig. 10. Consequently, a calculation of the standard deviation from these values is also given in the last two columns of Table 2.
Table 2 Averaged maximum velocities and standard deviation calculated for each operator at each individual joint
|
Link |
Machine feasible maximum velocities |
Average Maximum velocity for Operator-Y |
Average Maximum velocity for Operator-O |
Units |
Standard deviation Operator-Y |
Standard deviation Operator-O |
|
1 |
0.8 |
0.1969 |
0.22 |
rad/sec |
0.0431 |
0.0282 |
|
2 |
0.5 |
0.1130 |
0.1130 |
rad/sec |
0.0418 |
0.0463 |
|
3 |
0.8 |
0.2026 |
0.1566 |
rad/sec |
0.0763 |
0.0506 |
|
4 |
1.2 |
0.0971 |
0.0999 |
m/sec |
0.1075 |
0.0441 |
Table 2 shows that both operators use the joints , and in the neighborhood of similar maximum velocities. This can also be verified observing Fig. 9 and Fig. 10, because most of the velocity action happens in a neighborhood of the same region. However, there is a difference in the values for . Table 2 also helps revealing at what percentage of the maximum machine velocity our particular operators feel comfortable operating the machine. Table 3 presents an estimation of these quantities, by calculating the ratio between the second column, with the third and fourth column of Table 2.
A final calculation is to show the percentage of velocity that machine operators use in relation to what the machine is able to achieve. This is calculated by the ratio between the second column with the third and fourth columns of Table 2. This ratio represents the level of velocity amplitude that machine operators feel comfortable using when they work with this machine. The result of such a calculation is presented in Table 3.
Table 3 Percentage from the maximum velocity that operators use at each link
|
Link |
Operator-Y, % |
Operator-O, % |
|
1 |
25 |
27 |
|
2 |
24 |
22 |
|
3 |
31 |
19 |
|
4 |
4 |
8 |
3.4 Using computer software for planning similar trajectories
In industrial robotics, using parametric polynomial functions is one of the many methods used for planning robot trajectories. Polynomials help defining a trajectory from an initial to a final state, while considering specific position, velocity, and acceleration profiles. To represent the motions of machine operators, the example of a fifth order parametric polynomial can be used:
(3)
Such polynomial is standard in industrial software for defining motions in robotic mechanisms (Spong et al. 2006). In (3), the coefficients encode the motion patterns by considering the initial and final positions for the motion, as well as the maximum velocities and accelerations intended. To define the time duration of the motion, the variable can be defined in terms of time:
(4)
Defining the coefficients will define the speed of motion. For the cases shown in Fig. 5 and Fig. 6, a computer generated approximation of the averaged data sets is shown in Fig. 11, i.e. the average of the trajectories in each case. For the case of retracting the crane, as shown in Fig. 7 and Fig. 8, a computer reconstruction encoding the average characteristics is presented in Fig. 12.
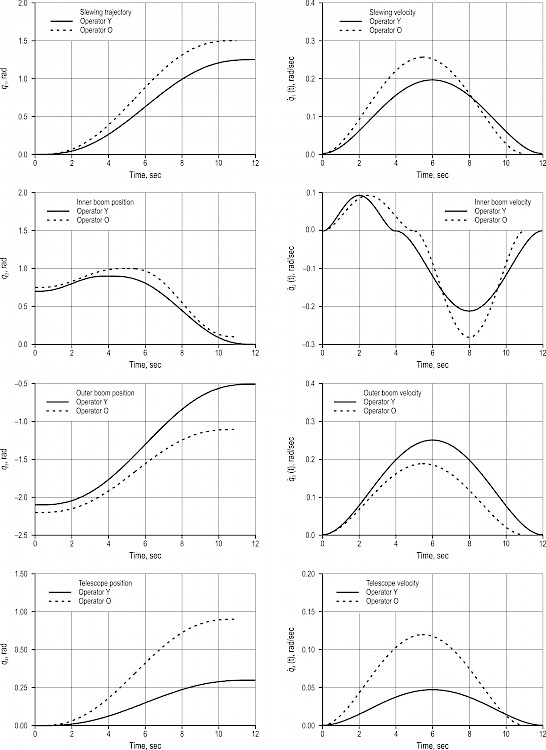
Fig. 11 Trajectories planned according to fifth order polynomial functions for expanding motions to the left; plots on the left are position trajectories, whereas velocity profiles are plotted on the right
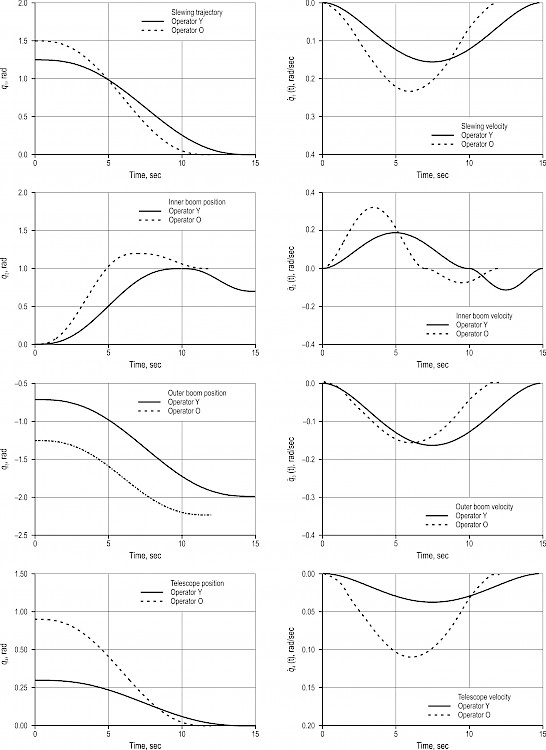
Fig. 12 Trajectories planned according to fifth order polynomial functions for retracting the crane from the left; figures on the left are position trajectories, whereas the velocity profiles are plotted on the right
4. Discussion
Nowadays, analyzing the work of machine operators is done by measuring time cycles, because the volume of production per hour is an important metric to industry. However, if we were to use time alone for developing solutions in the areas of automation, operator training, real-time data analysis, or any other technological development, this metric would not be suitable to fulfil these goals. Time alone is a variable providing insufficient information to characterize motion.
Particularly for us, the overall aim of understanding how humans generate motions when they work with machines is to use this information for getting insights into the possibilities to develop advanced automation to facilitate the work of operators. One method to use this information is to develop autonomous crane capabilities, where computer generated motions are imitation of what humans perform. As it is common in the field of robotics, imitating what humans do often leads to faster development than developing complex motion planning algorithms. This is one of the main reasons why areas such as machine learning and deep learning are speeding up the process of developing automation.
However, there are important aspects to highlight before proceeding with our discussions. The first aspect consists of comparing machine operators. As explained in section 2.2.1, it is mathematically incorrect to compare two different trajectory planning algorithms, unless these algorithms are designed to fulfill similar performance criteria. Similarly, comparing the trajectories of two operators is a mathematically ill problem, unless it is certain that these operators are aiming for similar performance criteria. Therefore, this will not be the subject of this article. A second aspect refers to assessing the work of an operator. As explained in section 2.2.1, machines in general do not have an ideal way to be manually controlled, and in the absence of an ideal situation, it is mathematically impossible to state how good an operator is working. Nevertheless, an assessment in this matter can be drawn according to how consistent a machine operator repeats pick-and-place motions according to his own ability. Additionally, it is possible to assess how much faster an autonomous system would be able to work in relation to this person for the case of achieving time-optimal motions. These kinds of motions, however, are not energy optimal, and this is the main reason why we believe that human operators perform mentally a multi-criteria optimization, even though they are not aware of this fact. Given these explanations, our findings are further discussed.
4.1 Log bunk positioning
Fig. 4 and Fig. 5 present a reconstruction of the crane motions in Cartesian space. A calculation of this kind helps finding the locations where logs are grabbed on the ground, giving a direct view of how machine operators position the machine with respect to their work. In section 2, we explained that machine operators are usually instructed to keep the machine perpendicular to the logs, and maintain a working range near half the total distance of the crane to preserve potential energy. Calculating the average distance of the crane-tip position becomes readily available when using the data of the log locations. In average, the operators in this study use the crane in an average distance range of 5.33 (m), as may be visualized in Fig. 4. Considering that the total range of the crane is 9 meters, this value goes into agreement with what we would be expecting, and it gives a valuable range that can be used in automation software for planning motions according to human data (Ortiz Morales et al. 2014). It is also observed that both machine operators place the machine mostly perpendicular to the logs at all times, although with some slight variations.
In several articles, e.g. (Lindroos et al. 2017, Lindroos et al. 2015), researchers explain how measuring the tip position will enable other areas of automation to come forward. An immediate application of this result is the possibility to develop highly accurate automatic time studies. This interest comes from authors, such as (Palander et al. 2013), who use the machine computer data to this end. However, computer data without sensing technology is neither reliable, nor accurate, because the computers of current commercial machines do not have any information about the motion of the crane.
Apart from the above, there are other areas in robotics where measuring the tip position becomes important. For instance, autonomous driving and fully autonomous crane control using cameras for recognizing the logs on the ground. To enable these possibilities, however, more advances in the areas of machine location and computer vision are needed, as the current technology using GPS or systems of such kind are insufficient in outdoor applications. Having robotic systems moving in the outside world is currently a difficult topic in the robotics community. Nevertheless, having measurements of crane-tip positions and log locations is one of the first steps to achieve these goals.
4.2 Crane motion patterns
For the task of commanding crane motions, two patterns fairly well summarize the entire pick-and-place operation. These are the motions to approach logs, and the ones to bring logs back to the machine. Along this article, these motions have been named as the expanding and retracting motions, as these are the operations the crane undergoes to accomplish them. Our particular interest has been to observe the extent at which operators consistently repeat the same motion patterns, and how these patterns look like if they exist.
The reconstruction of motion in Cartesian coordinates, shown in Fig. 4, gives already an indication that there are repeatable patterns for pick-and-place actions. More specifically, the individual joint trajectories, plotted in Fig. 5 to Fig. 8, follow very specific patterns. To show these patterns clearer, we have used the method of re-parametrization, as it is standard in data analytics for robotics. Results of reparametrizing these trajectories can be observed in the right of Fig. 5 to Fig. 8. The reparametrized trajectories show a clear boundary where the individual joints perform motion. Having this information is important for the tasks of automation, as it helps understanding that operating forestry machines follows a sequence of repeatable patterns that can be automated, and the boundaries of how this automation can be done. Although the tasks of autonomously identifying and grabbing logs present many challenges today, having automated motions for portions of the work, as shown in Fig. 5 to Fig. 8, represent an initial step towards achieving autonomous logging. This scenario of partial automation has formerly been discussed in many articles, e.g. (Ortiz Morales et al. 2014), but to the best of our knowledge, the present article is the first showing the data supporting such claims.
Another important observation is how data from Fig. 5 to Fig. 8 can be used in the context of machine learning and/or optimization. Considering optimization, one of the main tasks is to use performance criteria to optimize a given problem. To this end, suitable performance criteria for forestry cranes would involve minimizing the way motions consume the machine energy. In such a case, optimizing mechanical work is a quantity that is often used in robotics, and correlated to the energy expenditure in a given system. For forestry cranes, optimization can be achieved by optimizing the telescopic joint motion because it is the redundant link that can lead to different solutions (Spong et al. 2006). To verify this statement, it can be observed in Fig. 5 to Fig. 8 that the joint operators are using differently exactly the telescopic link , leading to small variations in how they perform in general. However, computer optimization can be developed to find a better solution to what is observed in these figures, and data of this kind can be used to train new machine operators, or to improve the operators work. In fact, currently no teaching is provided to machine operators according to optimal motion methods and, therefore, much of how operators perform nowadays is a matter of trial-and-error practice in the field. Unfortunately, calculating the energy consumed during motion falls out of the scope of the present article, because measuring energy requires extra set of sensors. Nevertheless, some preliminary work along these concepts can be found in literature (Morales et al. 2015).
Considering machine learning, one of the main problems consists in training a mathematical model to deliver similar output as a given system. To this end, the mathematical model is said to be trained according to data, meaning that the model is tuned to follow the measured data of a real process. In robotics, training a system according to human generated data is called »learning by demonstration«, and it is becoming one of the most applied methods to plan motions for unstructured and difficult environments. In forestry machines, having data of human operators opens a huge possibility to fully automate the working cycles of the machine, and apply optimization on top of this. The main problem is that planning every single motion of the crane via standard industrial robotics methods is unfeasible, because it would involve a tedious and slow process. However, training a computer system according to how humans operate machines opens up larger possibilities. All these are only some examples of the reasons why so much time is dedicated to analyze human motion data.
4.3 Crane velocities showing the effects of driver’s settings
In section 2.2.2, we explained how oscillations negatively influence the work of machine operators. For safety and to avoid oscillations, machine manufacturers usually use software to reduce the velocities allowed to cylinders. Thus, operators can use only a portion of the maximum velocities. Table 1 and Table 2 show the maximum velocities that each link is capable of performing when no software has been added to the machine. Afterwards, the reduction from factory value is usually 70% of the values shown in these tables. On top of this, machine operators individually set their own preferences. The problem of automation is to understand the range of velocities that seem comfortable for machine operators, which is most likely preset in the machine settings.
Table 3 shows that, in average, machine operators are capable of using 20% of the maximum velocity. Fig. 9 and Fig. 10 show that the main difference between operators lies in how they control the outer boom link . However, despite the differences, both operators show working cycles of nearly similar time. Morales et al. (2015) explained how the work with forestry cranes could be speeded up using automation software. According to Morales et al. (2015), time-efficiency could increase by at least three-fold if done by an autonomous control system. The reason for this claim, as shown in Table 4, has to do with the fact that machine operators – and humans in general – are not able to work quickly in multitasking problems. If machine operators use only an average of 20% of the machine ability, then that leaves plenty of room to attain time-optimal motions.
However, achieving faster motion is not only a problem of planning faster motions, but also a problem of whether or not the hydraulic system is capable of controlling the machine smoothly. Smartly controlling the hydraulic system is an area of intelligent hydraulic control systems, and this is a young area of development. Nevertheless, some initial hardware products are appearing in the market that could facilitate the development of intelligent hydraulic control. Some initial products featuring applications of this kind of hardware are the John Deere Smooth Boom Control (John Deere 2012), and Komatsu’s Smart Flow (Morales et al. 2015). Development of intelligent hydraulics represents a stepping stone towards automation of crane motions (La Hera and Morales 2015).
A second reason to understand velocities has to do with how machine operators define setting in the machine user interface. The 20% value explained above gives an indication of how operators preset the settings in the main computer. Additionally, an important observation in Fig. 9 and Fig. 10 is that the velocity profiles follow a near bell shape function. These bell shape functions are the result of software filters that operators also need to preset to work smoothly. The problem with settings is that defining them to properly operate a machine is a task involving long trial-and-errors, and it can take beginner operators years to do well. Efficiency of machine operators would greatly benefit from software that can automatically define settings according to sensor data. Therefore, a new method to automatically define settings according to crane smoothness and to operate the machine has been presented in Morales et al. (2015).
A final observation provided as an attempt to quantify the performance of an operator is related to repeatability. This is an idea derived from industrial robotics, where accuracy and repeatability are two characteristics used to measure the efficiency of robot motion. In simple words, repeatability is doing the same task over and over again at a consistent tempo, while accuracy is hitting your target each time with minimum error. Forestry cranes that pick-and-place logs follow similar characteristics. The difference, however, is that industrial robots are often programmed to reach a single specific target over and over, while forestry cranes pick-and-place logs at different places each time. Thus, accuracy is not a characteristic that can be used in forestry cranes. Repeatability, on the other hand, has to do with moving the robot at a similar tempo over and over. An indication of this characteristic is given by velocity. If the velocity sequences have small variations at each motion, then they indicate a form of repeatability. To this end, the maximum velocities of each cylinder can be calculated at each consecutive motion (see Fig. 9 and Fig. 10). The variations from the maximum velocity indicate the level of repetition in each sequence. The last two columns of Table 2 show such values, which are determined by the standard deviation. If these two operators were compared according to this characteristic, it would be concluded that operator-O has better repeatability patterns in his way to control the crane, because his standard deviations have smaller values compared to operator-Y. A graphical representation showing a clearer indication of this concept is given in Fig. 13.
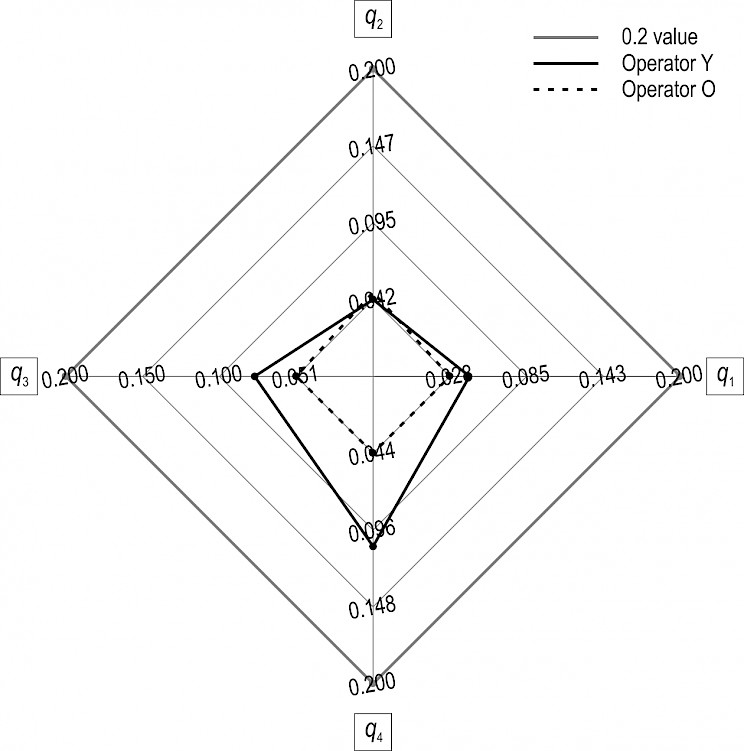
Fig. 13 Radar chart showing the repeatability of each operator according to the standard deviation of their maximum velocities; this chart is based on data given in Table 4
4.4 Using computer software for planning similar trajectories
Observing data for pick-and-place log operations, particularly the right plots of Fig. 6 to Fig. 9, it can be seen that the joint motions highly resemble repeatable patterns. It was mentioned in section 4.2 that data of this kind can be used for various ends with regards to automation. As an example, section 3.4 shows a case of using parametric polynomials that were tuned to match the average data of each operator. Results of the performance of these polynomials are presented in Fig. 11 and Fig. 12. These polynomials are standard in industrial robotics, and they can be used to automate portions of the work; for instance, retracting the crane back to the log bunk, once it has grabbed logs. Ortiz Morales et al. (2014) and Hansson and Servin (2010) presented experimental tests with such a development. Automated motions could be applied directly to a new form of user interfaces, and machine operators could control the crane just by touching a screen or pressing a button. To give an idea, Fig. 14 shows a computer 3D user interface to various log locations. The locations are chosen according to results presented in Fig. 4.
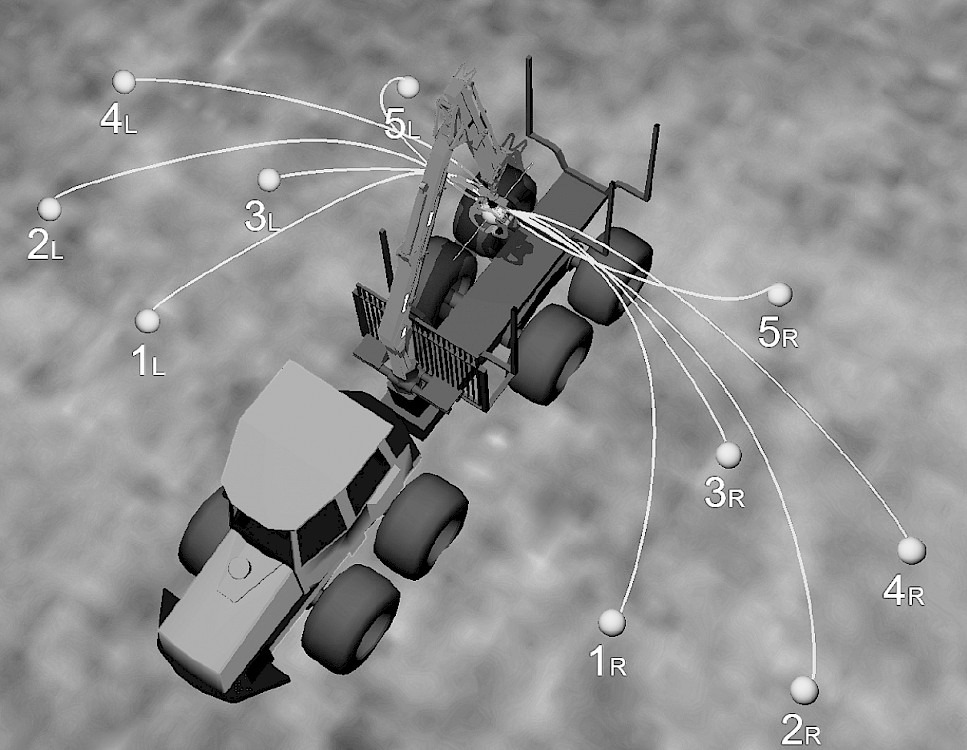
Fig. 14 Cartesian boom-tip paths achievable by a computer via trajectory planning algorithms
Nevertheless, it is a challenging problem to fully automate logging operations, because technology that is undergoing research is required to successfully automate these operations; for instance, recognizing logs in the ground (Westerberg 2014), navigating the vehicle throughout the forest (Ringdahl et al. 2011), and autonomously plan crane motions according to different tasks (Ortiz Morales et al. 2014). Although there are laboratory results along these lines, these developments are far from being successful in real world conditions.
On the other hand, developments in the areas of motion optimization and machine learning for forestry cranes show potential to improve operators training and efficiency. Machine learning, also known as robot programming by demonstration, is a powerful tool to plan motions by imitation, rather than carefully tuning polynomials as presented in this article. Using such technology, not only to automate the work, but also as a new learning mechanism for beginners, draws the interest of industry.
5. Conclusions
Data were presented to explore how operators of forestry machines work with cranes. The main objective was to observe the trajectories operators generate for each degree of freedom. To this end, we equipped a forwarder crane with motion sensors and recorded human generated motions when operators were working. Analyzing this data helped unveil many characteristics that are not obvious without sensing hardware. For example, how operators position the machine, how operators command motions, how good they are at multitasking, and even, how motion trajectories look like, or how operators settings influence the crane motion. As sensing technology is starting to appear in the forestry market, it can be expected that in coming years motion data analysis will be important to optimize work efficiency and to develop technological innovations. Therefore, our results cannot be used as final conclusions. On the contrary, they can be used to initially understand what motion sensing technology shows, to consequently propose solutions to improve operator’s work, or to develope automation features. Our former articles are a complement to these objectives.
An improvement of our solution will be to study motions from a dynamic point of view, involving sensors to measure hydraulic dynamics. Dynamics of motion is used to analyze overall energy, and this form of data will be useful to give the first suggestions of how machine operators should be instructed to truly optimize energy efficiency. Similarly, analyzing energy will open the possibility to show the performance of machine operators in the mathematical sense, to complement what was presented in Fig.13. This will be the topic of another article.
6. References
Belanger, P., Dobrovolny, P., Helmy, A., Zhang, X., 1998: Estimation of angular velocity and acceleration from shaft-encoder measurements. The International Journal of Robotics Research 17(11): 1225–1233. https://doi.org/10.1177/027836499801701107
Cranab AB, 2016: Manufacturers of forestry cranes. Retrieved from http://www.cranab.se.
Cranab AB, 2011: Cranab presents an entirely new generation of cranes. Retrieved from http://www.cranab.se.
Eriksson, M., Lindroos, O., 2014: Productivity of harvesters and forwarders in ctl operations in northern Sweden based on large follow-up datasets. International Journal of Forest Engineering 25(3): 179–200. https://doi.org/10.1080/14942119.2014.974309
Häggström, C., Lindroos, O., 2016: Human, technology, organization and environment–a human factors perspective on performance in forest harvesting. International Journal of Forest Engineering 27(2): 67–78. https://doi.org/10.1080/14942119.2016.1170495
Häggström, C., Öhman, M., Burström, L., Nordfjell, T., Lindroos, O., 2016: Vibration exposure in forwarder work: Effects of work element and grapple type. Croatian Journal of Forest Engineering 37(1): 107–118.
Hansson, A., Servin, M., 2010: Semi-autonomous shared control of large-scale manipulator arms. Control Engineering Practice 18(9): 1069–1076.
Indexator Rotator Systems, 2011: Rotator G121. http://www.indexator.se/sv/produktdatablad/rotator_-_g_121.
International forest industries, 2013: John Deere first with crane tip control on forest machines. http://www.internationalforestindustries.com.
John Deere, 2012: Smooth boom control. Retrieved from http://www.deere.co.uk/.
Khalil, H., 2002: Nonlinear systems. Prentice Hall, New Jersey, 3rd edition.
Komatsu Forest AB, 2011: Forwarder 830.3. http://www.komatsuforest.se/default.aspx?id=10876.
La Hera, P., Morales, D.O., 2015: Model-based development of control systems for forestry cranes. Journal of Control Science and Engineering 2015: 27. http://dx.doi.org/10.1155/2015/256951
Lindroos, O., La Hera, P., Häggström, C., 2017: Drivers of advances in mechanized timber harvesting–a selective review of technological innovation. Croatian Journal of Forest Engineering 38(2): 243–258.
Lindroos, O., Ringdahl, O., La Hera, P., Hohnloser, P., Hellström, T.H., 2015: Estimating the position of the harvester head–a key step towards the precision forestry of the future? Croatian Journal of Forest Engineering 36(2): 147–164.
Manring, N.D., 2005: Hydraulic Control Systems. John Wiley & Sons, New York, USA, first edition.
Mboup, M., Join, C., Fliess, M., 2009: Numerical differentiation with annihilators in noisy environment. Numerical algorithms 50(4): 439–467.
Mettin, U., Westerberg, S., Shiriaev, A., La Hera, P., 2009: Motion analysis and trajectory replanning of human-operated manipulators: Application to a forestry crane. In Proc. 2009 IEEE/RSJ International Conference on Intelligent Robots and Systems, 1–6 p.
Morales, D.O., La Hera, P., Westerberg, S., Freidovich, L.B., Shiriaev, A.S., 2015: Path-constrained motion analysis: An algorithm to understand human performance on hydraulic manipulators. IEEE Transactions on Human-Machine Systems 45(2): 187–199. https://doi.org/10.1109/THMS.2014.2366873
Nurminen, T., Korpunen, H., Uusitalo, J., 2006: Time consumption analysis of the mechanized cut-to-length harvesting system. Silva Fennica 40(2): 335–363.
Olivera, A., Visser, R., Acuna, M., Morgenroth, J., 2016: Automatic GNSS-enabled harvester data collection as a tool to evaluate factors affecting harvester productivity in a Eucalyptus spp. harvesting operation in Uruguay. International journal of forest engineering 27(1): 15–28. https://doi.org/10.1080/14942119.2015.1099775
Ortiz Morales, D., Westerberg, S., La Hera, P.X., Mettin, U., Freidovich, L., Shiriaev, A.S., 2014: Increasing the level of automation in the forestry logging process with crane trajectory planning and control. Journal of Field Robotics 31(3): 343–363. https://doi.org/10.1002/rob.21496
Palander, T., Nuutinen, Y., Kariniemi, A., Vaatainen, K., 2013: Automatic time study method for recording work phase times of timber harvesting. Forest Science 59(4): 472–483. https://doi.org/10.5849/forsci.12-009
Ringdahl, O., Lindroos, O., Hellström, T., Bergström, D., Athanassiadis, D., Nordfjell, T., 2011: Path tracking in forest terrain by an autonomous forwarder. Scandinavian Journal of Forest Research 26(4): 350–359. https://doi.org/10.1080/02827581.2011.566889
Siciliano, B., Khatib, O., 2016: Springer handbook of robotics. Springer.
Spong, M., Hutchinson, S., Vidyasagar, M., 2006: Robot Modeling and Control. John Wiley and Sons, New Jersey, third edition.
Srimathveeravalli, G., Gourishankar, V., Thenkurussi, K., 2006: Haptic attributes and human motor skills. In Haptic Interfaces for Virtual Environment and Teleoperator Systems, 2006 14th Symposium on, pages 453–459. IEEE.
Sveaskog, 2006: Sveaskog. Retrieved from http://www.sveaskog.se/en/.
Technion, 2017: Crane control systems. Retrieved from https://technion.fi/crane-control-systems/.
Westerberg, S., 2014: Semi-automating forestry machines: Motion planning, system integration, and human-machine interaction. PhD thesis, Umeå Universitet.
© 2018 by the authors. Submitted for possible open access publication under the
terms and conditions of the Creative Commons Attribution (CC BY) license (http://creativecommons.org/licenses/by/4.0/).
Authors’ addresses:
Pedro La Hera, PhD *
e-mail: xavier.lahera@slu.se
Swedish Cluster of Forest Technology
Box 27
922 21 Vindeln
Swedish University of Agricultural Sciences
Department of Forest Technology
Skogsmarksgränd 17
901 83 Umeå
Daniel Ortiz Morales, PhD
e-mail: daniel.om@skogstekniskaklustret.se
Swedish Cluster of Forest Technology
Box 27
922 21 Vindeln
CRANAB Corporation
922 21 Vindeln
SWEDEN
* Corresponding author
Received: September 26, 2017
Accepted: October 23, 2018
Original scientific paper