
Multi-Product Forwarder-Based Timber Extraction: Time Consumption and Productivity Analysis of Two Forwarder Models Over Multiple Products and Extraction Distances
doi: https://doi.org/10.5552/crojfe.2020.736
volume: 41, issue:
pp: 12
- Author(s):
-
- Gagliardi Kayla
- Ackerman Simon A.
- Ackerman Pierre A.
- Article category:
- Original scientific paper
- Keywords:
- cut-to-length, cycle time, fuel consumption, plantation, South Africa, Pinus patula
Abstract
HTML
Accurate predictions in forest operations can be used towards effective planning, costing, and maximizing the productivity of machines in mechanised cut-to-length (CTL) harvesting. There is a general and substantial gap in forwarder productivity data available for pine sawtimber in South Africa at present, and as the number of product assortments being harvested increase there is a need for more work to quantify the effects of extracting products of different dimensions. The aim of this study was to calculate the time consumption and productivity of two models of Ponsse forwarders (15 t and 20 t capacity) to consider and compare the effects of multiple variables including machine capabilities, product assortment, load size, extraction distance and fuel consumption. Productivity averaged at 34.08 m3 per productive machine hour excluding delays longer than one minute (PMH1) for the smaller machine, and 55.94 m3/PMH1 for the larger machine. Productivity and average log volume were strongly positively correlated. Regression models were created for each machine where load volume and extraction distance were both significant factors for predicting productivity. Average fuel consumption of the smaller machine was 15.55 l/PMH1 and 0.47 l/m3, and 20.57 l/PMH1 and 0.43 l/m3 for the larger machine. The product with the largest volume was found to require the least fuel per m3. The models developed could aid in predicting system productivity and potentially carbon emissions under similar conditions in a South African context of industrial plantation forestry.
Multi-Product Forwarder-Based Timber Extraction: Time Consumption and Productivity Analysis of Two Forwarder Models Over Multiple Products and Extraction Distances
Kayla Gagliardi, Simon Ackerman, Pierre Ackerman
Abstract
Accurate predictions in forest operations can be used towards effective planning, costing, and maximizing the productivity of machines in mechanised cut-to-length (CTL) harvesting. There is a general and substantial gap in forwarder productivity data available for pine sawtimber in South Africa at present, and as the number of product assortments being harvested increase there is a need for more work to quantify the effects of extracting products of different dimensions. The aim of this study was to calculate the time consumption and productivity of two models of Ponsse forwarders (15 t and 20 t capacity) to consider and compare the effects of multiple variables including machine capabilities, product assortment, load size, extraction distance and fuel consumption. Productivity averaged at 34.08 m3 per productive machine hour excluding delays longer than one minute (PMH1) for the smaller machine, and 55.94 m3/PMH1 for the larger machine. Productivity and average log volume were strongly positively correlated. Regression models were created for each machine where load volume and extraction distance were both significant factors for predicting productivity. Average fuel consumption of the smaller machine was 15.55 l/PMH1 and 0.47 l/m3, and 20.57 l/PMH1 and 0.43 l/m3 for the larger machine. The product with the largest volume was found to require the least fuel per m3. The models developed could aid in predicting system productivity and potentially carbon emissions under similar conditions in a South African context of industrial plantation forestry.
Keywords: cut-to-length, cycle time, fuel consumption, plantation, South Africa, Pinus patula
1. Introduction
Fully mechanized cut-to-length (CTL) harvesting comprises two machines: a harvester that fells and processes trees into log assortments, and a forwarder that extracts and transports the logs to the roadside landing (McNeel and Rutherford 1994). The high initial investment and associated operating costs of these machines require production of as much quality timber in the shortest times possible to be financially feasible (Purfürst 2010). Therefore, accurate predictions for maximizing the overall productivity of these systems are paramount for planning, costing, and management of CTL forest operations (Eriksson and Lindroos 2014). The most common way of investigating and identifying the main factors affecting productivity of CTL harvesting is to analyse effective time consumption, from which realistic models can be developed and employed towards optimizing operations and efficiency (Nurminen et al. 2006). Since repetitive work cycles are observed, time consumption can be divided into separate cycle elements (Stankić et al. 2012). By recording time consumption and the main factors that affect it, it is possible to establish productivity, which provides a reference point towards costing and operational planning (Nurminen et al. 2006). When it comes to mechanized harvesting systems, the productivity of forwarders is typically more complex to predict than for harvesters since there are several additional predictor variables involved, such as extraction distance and load capacities (Eriksson and Lindroos 2014). These variables also influence fuel consumption, which is important to consider for overall costs, emissions, and potential environmental consequences associated with mechanized harvesting operations (Nordfjell et al. 2003, Williams and Ackerman 2016). However, through effective planning to achieve and maintain the highest productivity levels, it can be possible to reduce fuel consumptions and emissions (Cosola et al. 2016).
Forwarder efficiency is intrinsically dependent on multiple interacting variables affecting time consumption that need to be considered simultaneously for accurate productivity predictions (Stankić et al. 2012, Eriksson and Lindroos 2014). Many studies have identified extraction distance as a major factor affecting forwarder time consumption and productivity, and it is well known that productivity is negatively correlated (Nurminen et al. 2006, Jiroušek et al. 2007, Ghaffariyan et al. 2012, Eriksson and Lindroos 2014, Strandgard et al. 2017, Proto et al. 2018). Another principle variable that is known to be strongly positively correlated is load volume or machine payload; therefore, combining the largest load sizes with the shortest hauling distances should result in the highest productivity (Jiroušek et al. 2007, Ghaffariyan et al. 2012, Eriksson and Lindroos 2014, Strandgard et al. 2017, Proto et al. 2018). Machine size and capacities also have large effects on productivity rates. Although larger machines may be more expensive considering overall costs and fuel consumption, the capacity to hold larger load volumes should typically offset the price, since higher rates of productivity will lower the cost per cubic meter of timber extracted (Jiroušek et al. 2007). The number of product assortments being harvested is an additional variable to consider for forwarder productivity since it will affect the densities of timber infield – for example the smallest product assortments tend to be further spaced apart, which can affect loading times (Nurminen et al. 2006). The extraction of various product assortments can therefore affect productivity by requiring more time to load, which is typically the case for smaller assortments (Nurminen et al. 2006, Strandgard et al. 2017). Since the number of product assortments being extracted has increased over the years, there is a need for more research towards quantifying the effects of different products on forwarder time consumption and productivity (McNeel and Rutherford 1994, Nurminen et al. 2006).
There have been many studies to date regarding predictions of productivity for mechanized harvesting operations globally, although it is often difficult to compare and maintain the accuracy of predictive models between sites when there is limited data (Eriksson and Lindroos 2014). Today there is still a substantial gap in basic productivity data available when considering pine sawtimber in South Africa, as mechanized CTL systems are still a relatively new technology in the country (Williams and Ackerman 2016, Ackerman et al. 2017). Preliminary pine sawtimber CTL harvesting research by Williams and Ackerman (2016) contributed to this productivity database, however the comparability of the forwarder data obtained is limited since only one assortment of sawtimber log and one machine size were studied. This study will therefore continue to expand on productivity data and models that can incorporate different variables such as machine sizes, different products, and load volumes over varying extraction distances. This study will also estimate fuel consumption rates, which can be compared to other averages that have been established internationally as well as what is available under the conditions of South African pine plantations.
In order to calculate and model productivity, a time study was conducted to obtain: the division of work time spent per element and per cycle, the distances travelled, and the speed of the forwarder while driving loaded and unloaded. A medium and large forwarder were used for the study to compare differences between load sizes and capacities, travel speeds, and fuel consumption. Since hauling mixed loads requires sorting which increases time consumption (Kellogg and Bettinger 1994) and hauling single sawlog loads has been found to have a significantly higher efficiency over mixed loads (Nurminen et al. 2006), this study will focus on developing models for single product loads. Cycle specific time consumption factors per assortments will also be examined to compare productivity between the products of different sizes.
The main objective of this study is to continue building the database of average time consumption and productivity models from effective work time of forwarder machines in mechanised CTL operations in South African pine sawtimber plantations. More specifically, this study will go further in depth than previous similar research by aiming to determine individual productivity of different machine sizes while simultaneously considering multiple product assortments. From this it will be possible to quantify and examine the effect of log sizes on forwarder payload limits and observe which products should result in the highest productivity rates per machine as well as demonstrate how effectively the machine was utilized. Results obtained will also continue to build upon the currently limited productivity and fuel consumption database of forwarders under South Africa conditions. The applicable models developed should aid towards determining the operable productivity range of forwarders under similar conditions and stand characteristics as well improve operational management and costing methods.
2. Materials and Methods
The study took place in a Pinus patula sawtimber clear-felling compartment in the Jessievale Plantation of the Mpumalanga Highveld forestry region of South Africa. The compartment was characterized according to the National Terrain Classification for Forestry (Erasmus 1994) as having a consistent low level of ground roughness, good ground strength, and a level, negligible slope (max slope <11%) (Table 1). Two machines were studied: a Ponsse Buffalo forwarder with a load-bearing capacity of 15 t, and a larger Ponsse Elephant King forwarder designed for more extreme conditions and heavier loads with a 20 t carrying capacity (Table 2). The machines were observed for three days each from July 19th – July 25th, 2018. Weather throughout the study was consistently cool, dry, and sunny as expected for winter in the Mpumalanga region (Louw and Sholes 2002). Variation in operator performance was assumed as minimal, as they had similar training and at least two years of experience and familiarity with the machines in question. The machines and operators were observed under full operational conditions.
Table 1 Compartment characteristics of forwarder work site
|
Site Attribute |
|
|
Total area, ha |
29.7 |
|
Species |
Pinus patula |
|
Age, years |
20.1 |
|
Initial planting espacement, m |
3.0x3.0 |
|
SPH, stems/ha |
372 |
|
Average DBH, cm |
30.9 |
|
Average height, m |
25.9 |
|
Average tree volume, m3 |
0.901 |
|
Slope |
Level |
|
Ground roughness |
Even |
|
Ground strength |
Firm |
Table 2 Machine characteristics of the forwarders studied
|
Characteristic |
Make and model |
|
|
Ponsse Buffalo |
Ponsse Elephant King |
|
|
Minimum weight, kg |
17,200 kg |
22,900 kg |
|
Typical weight, kg |
18,400 kg |
23,700 kg |
|
Length, mm |
9610–10,770+700 (glide bunk) |
10,150–11,060+700 (glide bunk) |
|
Width, mm |
2895–3085 |
3070-3210 |
|
Ground clearance, mm |
680 |
800 |
|
Transportation height, mm |
3860 |
3990 |
|
Loader |
K90+ |
K100+ |
|
Reach, m |
7.8/10 |
7.8/9.5 |
|
Engine model |
MB OM906 LA EU Stage IIIA |
MB OM906 LA EU Stage IIIA |
|
Engine power, kW |
205 |
205 |
|
Tractive force, kN |
185 |
240 |
|
Driving speed, km/h |
0–20 |
0–20 |
|
Fuel tank volume, l |
200 |
260 |
|
Load carrying capacity, t |
15 |
20 |
|
Load space cross-sectional area, m2 |
4.5–5.5 |
5.8–6.7 |
|
Load space length, mm |
4210–5410+700 (glide bunk) |
4540–5450+700 (glide bunk) |
|
Number of wheels |
6 |
8 |
Trees were felled and processed infield by a Ponsse Beaver harvester which left a harvested 300 m long corridor, the actual width of the selected stand, for each forwarder to follow and extract timber. Each corridor was approximately 12 m wide (4 tree rows). The various assortments were stacked separately by the harvester. Each forwarder was assigned two adjacent corridors per shift with a total of roughly 280 m3 of logs available to extract. The work method for each machine was as follows: the large machine loaded timber from one side only, while the smaller forwarder loaded from both sides. The four log assortments harvested throughout the study were long sawlogs (length = 6.0–6.6 m, average volume = 0.340 m3), short sawlogs (length = 4.2–4.8 m, average volume = 0.183 m3), Hewsaw assortments (length = 3.0 m, average volume = 0.078 m3), and ply logs (length = 2.55 m, average volume = 0.190 m3). Each assortment had a 10 cm trimming allowance over and above the actual log length. The operators followed normal operational procedures, driving in bunk first to a maximum extraction distance of 300 m (end of prepared corridor), from which they would begin loading logs as they returned to the roadside landing. Since all loads throughout the study consisted of only one assortment at a time, no additional sorting for loading by the forwarder operator was required. Once the forwarder was loaded, it would drive to the roadside to unload the logs into separate piles per assortment. To account for the highly variable driving distance between piles at the roadside, a standardized point was set and used for each shift as the point where unloading occurred. After unloading, the operators would continue the process where they left off for the particular product, which resulted in the varying extraction distances observed among cycles per product. Once a specific product was completed, the operator was instructed to return to the 300 m point to begin again using the same technique with the next assortment. In this study, extraction distance was defined as the complete distance travelled unloaded, from the unloading point to the first stop to load logs. This definition was chosen to provide an adequate representation and to be able to model the exact and varying extraction distances that occurred according to the products that were available in field.
Since repetitive work cycles are observed when forwarders are extracting timber, time consumption was recorded by cycle and broken down into different cycle elements (Stankić et al. 2012). Each cycle started from when the forwarder began driving unloaded from the landing and ended when the forwarder grapple came to rest on the bunk after the last grapple load was unloaded. Each cycle was split into the following four cycle elements: driving unloaded, loading (including driving), driving loaded, and unloading at the landing. The elemental time study method was used to evaluate machine productivity as per the standards for the South African forestry industry (Ackerman et al. 2014) by use of a handheld MultiDAT recording device equipped with a global positing system (GPS) receiver. Time was recorded in decimal-minutes. The GPS was set to record a point every 2.0 m and any speed change over 1 km h-1. The MultiDAT internal motion sensor was enabled to record a stop if vibration was less than threshold for more than one minute, since utilizing the output of the sensor combined with the GPS data can enhance more accurate recordings of delays that are sometimes missed by the GPS alone (Strandgard and Mitchell 2015). Data obtained from the time study allowed for the division of work time spent per cycle element as well as per full cycle. The total scheduled machine hours (SMH) recorded were then converted to productive machine hours by removing all working delays longer than one minute from each cycle (PMH1).
Independent variables associated with machine productivity also recorded were product assortment, number of logs per load and approximate load volumes, speed while driving loaded and unloaded, distances travelled throughout each cycle, and fuel consumption. Machine productivity was measured according to the volume of logs (m3) extracted per PMH1. Fuel consumption was estimated during the study by recording the difference in diesel (l) consumed between the start and end of each shift from the machine’s on-board computer. The amount of fuel consumed per shift was then divided by the length of the shift in productive machine hours (l/ PMH1) as well as by volume of logs extracted (l/m3). Although only the overall litres consumed per machine were recorded, it was possible to use these amounts to calculate logical rough estimations for the fuel consumed per product in l/m3. This was done by dividing the total litres consumed per machine by the proportion of PMH1 time spent per cycle for each of the assortments, and then by the total volumes extracted.
3. Results
3.1 Time Consumption
A total of 78 forwarding cycles were recorded resulting in a total of 1986 productive machine minutes, of which 36 cycles were from the Buffalo machine (1076 minutes) and 42 cycles were from the Elephant King machine (910 minutes). The overall breakdown and proportion of average times spent for each element of a cycle is illustrated in Fig. 1.
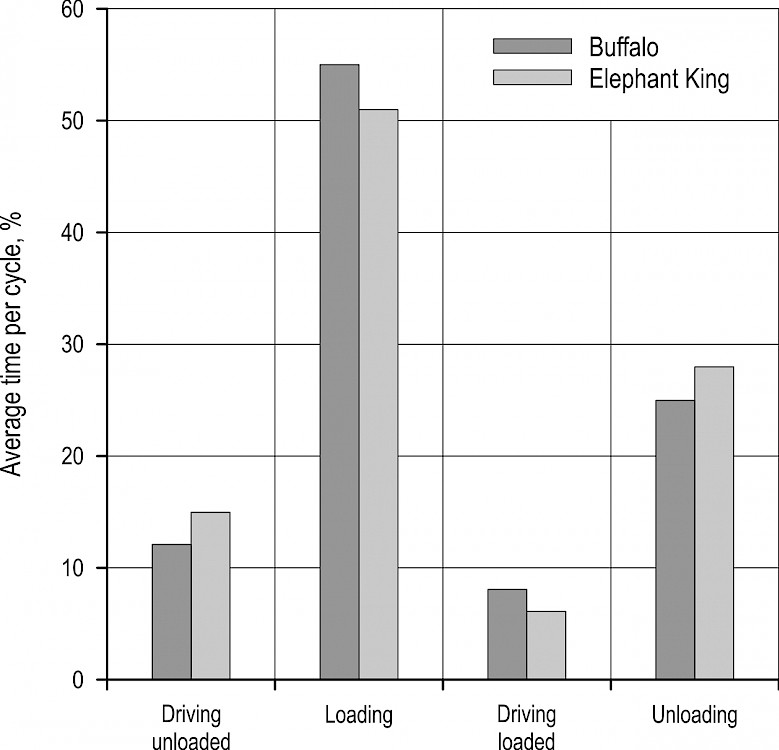
Fig. 1 Average division of forwarder cycle times based on manually recorded time study data
The overall average time consumption per cycle was 25.47 minutes (SD = 8.99, range = 6.73–45.63). It should be noted that cycle times were dependant on factors such as the distance travelled loaded and unloaded, which was highly variable based on the amount and concentration of products in the field. Also, not all loads were to full capacity based on the haulage instructions of the study and what was remaining in the field for the specific cycle.
Table 3 Average cycle times recorded per machine and per product
|
Machine |
Product |
Total cycles |
Proportion of total log number, % |
Cycle time, min |
|||
|
Average |
Min |
Max |
SD |
||||
|
Buffalo |
Hewsaw |
6 |
25.3 |
25.84 |
24.15 |
28.98 |
1.62 |
|
Short SL |
18 |
10.7 |
31.53 |
24.78 |
39.95 |
5.45 |
|
|
Long SL |
8 |
40.23 |
28.64 |
11.12 |
37.25 |
6.17 |
|
|
Ply |
4 |
23.76 |
35.00 |
13.65 |
45.63 |
9.27 |
|
|
Overall |
36 |
41.65 |
29.91 |
11.12 |
45.63 |
7.17 |
|
|
Elephant King |
Hewsaw |
5 |
33.73 |
38.77 |
31.82 |
44.67 |
4.27 |
|
Short SL |
22 |
7.26 |
16.88 |
14.52 |
19.17 |
1.71 |
|
|
Long SL |
10 |
36.38 |
17.31 |
6.73 |
23.47 |
4.11 |
|
|
Ply |
5 |
22.62 |
25.10 |
7.90 |
33.43 |
7.40 |
|
|
Overall |
42 |
58.35 |
21.67 |
6.73 |
44.67 |
8.64 |
|
3.2 Productivity Variables
Throughout the study, a total of 6416 logs of different assortments were extracted resulting in a total volume of 1364.64 m3 (Buffalo = 2672 logs, 599.07 m3, Elephant King = 3744 logs, 765.58 m3). The overall average extraction distance was 212.7 m (range = 25–316.6). Average load volume was 17.5 m3 (range = 5.91–24.42) and the average number of logs per load was 82 (range = 19–288). The large ranges for load volume and average number of logs per load can be attributed to the average log diameters of the assorted products extracted, as well as what was available in the field per cycle as previously mentioned. Basic study data regarding the variables recorded specific to each machine size is presented in Table 4.
Table 4 Overview of variables examined overall and between machines
|
Variable |
Buffalo |
Elephant King |
Overall |
||||||
|
Min |
Average |
Max |
Min |
Average |
Max |
Min |
Average |
Max |
|
|
Extraction distance, m |
31.3 |
204.9 |
315 |
25 |
219.4 |
316.6 |
25 |
212.7 |
316.6 |
|
Number of logs per load, n |
19 |
74 |
127 |
20 |
89 |
288 |
19 |
82 |
288 |
|
Log volume, m3 |
0.076 |
0.250 |
0.400 |
0.075 |
0.252 |
0.375 |
0.075 |
0.251 |
0.400 |
|
Load volume, m3 |
6.08 |
16.64 |
24.42 |
5.91 |
18.23 |
24.07 |
5.91 |
17.5 |
24.42 |
3.3 Forwarder Productivity
Mean productivity per machine and per product was calculated according to Ackerman et al. (2014) from the recorded productive cycle times and volume (m3) of logs extracted throughout each cycle. The Elephant King machine showed a higher mean productivity overall (Buffalo = 28.99 m3/PMH1, Elephant King = 44.77 m3/PMH1) as well as for all four product assortments compared to the Buffalo machine. The ranking of mean productivity for each product was the same for both machines, where long sawlog was the highest, ply was second, followed by short sawlogs, and with Hewsaw assortments as the lowest (Table 5). The difference between productivities for ply and short sawlogs was however quite small for the Buffalo machine.
Table 5 Productivity data per machine and per product
|
Machine |
Product |
Cycles |
Productivity, m3/PMH1 |
|||
|
Mean |
Standard Error |
Min |
Max |
|||
|
Buffalo |
Hewsaw |
6 |
20.46 |
12.75 |
14.47 |
23.17 |
|
Long SL |
18 |
44.22 |
39.78 |
32.79 |
60.71 |
|
|
Ply |
8 |
25.77 |
19.10 |
21.47 |
30.88 |
|
|
Short SL |
4 |
25.50 |
16.06 |
21.42 |
39.04 |
|
|
Elephant King |
Hewsaw |
5 |
30.40 |
21.10 |
23.73 |
68.43 |
|
Long SL |
22 |
73.48 |
69.46 |
52.69 |
105.82 |
|
|
Ply |
10 |
40.93 |
25.85 |
32.78 |
53.47 |
|
|
Short SL |
5 |
34.29 |
12.75 |
26.80 |
38.83 |
|
The same trend of increasing productivity with increasing log volume (m3) was observed per machine (Fig. 2). Productivity was strongly correlated with average log volume per cycle, with Pearson r values of 0.86 and 0.91 observed for the Buffalo and Elephant King machines, respectively.
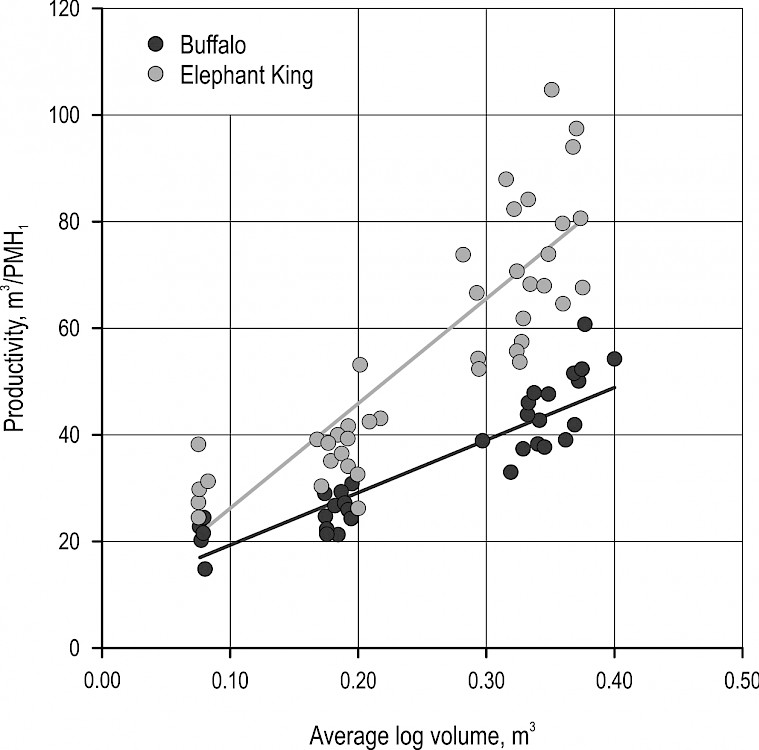
Fig. 2 Relationship between average log volume per cycle and productivity for each machine size
The larger Elephant King machine had higher mean productivities for each of the products extracted. When comparing between machines, post hoc comparisons found the difference in recorded means for long sawlogs and ply to be strongly significant (p<0.01), however the differences for Hewsaw and short sawlogs were not. The most productive product for each machine was long sawlogs, and for both machines there was a significant difference between the mean long sawlog productivities when compared to the remaining three products (Elephant King: p<0.01, Buffalo: p<0.05).
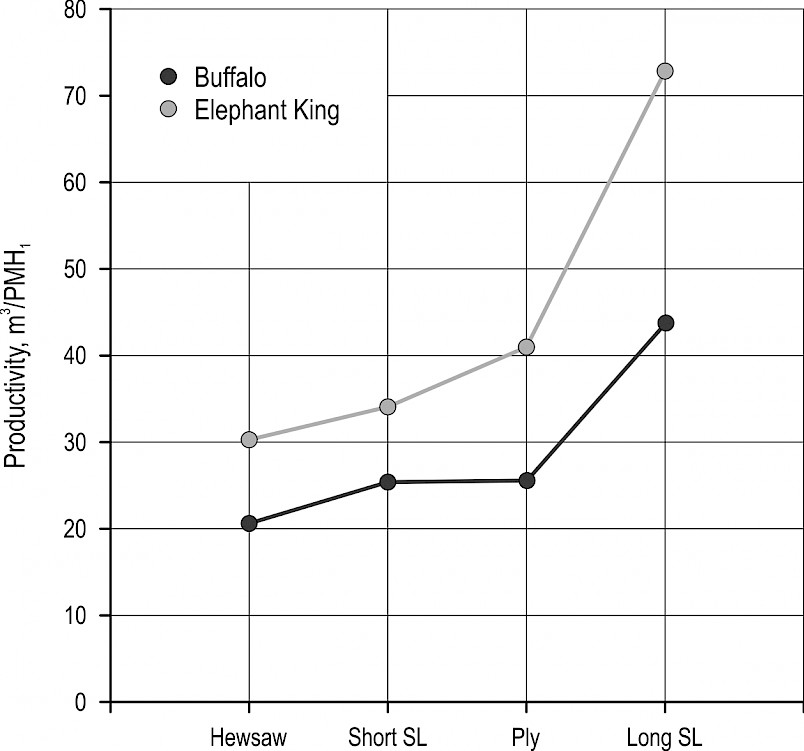
Fig. 3 Comparison of mean productivities per machine and per product
3.4 Productivity Regression Analysis
Generalized linear modelling (GLM) was firstly conducted to determine that, individually, extraction distance and load volume were both significant factors (p<0.01) when predicting productivity, where load volume was positively correlated and extraction distance was negatively correlated. A multiple regression analysis was then performed to explain the relationship of productivity to machine size, product assortment, extraction distance, and load volume as independent variables. Extraction distance and load volume were both found to have significant impact on the models overall and for each machine in accordance with the required assumptions for linear regression and ANOVA. Model goodness of fit and significance was therefore assessed using R2, RMSE, and ANOVA values. Combining the overall data of the two sizes of machines allows for a more robust model (Eq. 1), however, at the separate machine level, the regression equations developed accounted for more of the variation (Eq. 2–3). Load volume was found to be the strongest predictor variable for each of the three models; however, the difference in strength was only slight for the Elephant King machine. When considering correlation at the individual product assortment level for each machine, most of the models became less significant (p>0.05). This is likely attributed to the smaller sample sizes and these models were therefore not included in further analysis.

 (1)
(1)
n = 78, adjusted R2 = 0.43, SE = 15.89, p < 0.01

 (2)
(2)
n = 36, adjusted R2 = 0.80, SE = 5.30, p < 0.01

 (3)
(3)
n = 42, adjusted R2 = 0.50, SE = 15.59, p < 0.01
Where:
LV average load volume, m3
ED average extraction distance, m
Productivity volume extracted per productive machine hour, m3/PMH1
The linear fit of both modelled independent variables relative to the predicted output from each of the regression equations is presented in Fig. 4 and Fig. 5.

Fig. 4 Line fit plot of observed productivity vs predicted productivity based on load volume
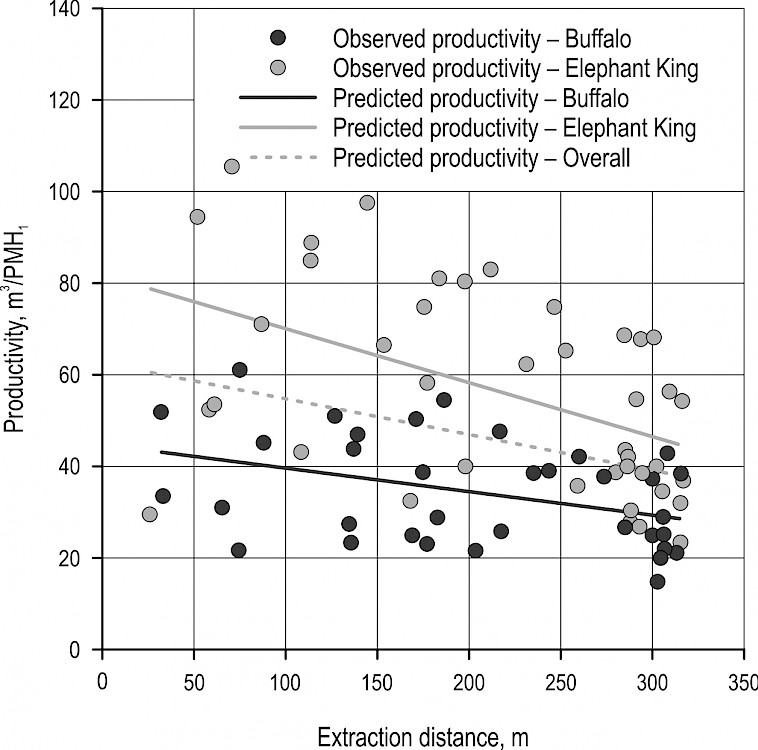
Fig. 5 Line fit plot of observed productivity vs predicted productivity based on extraction distance
3.5 Travel Speed
The overall average speed recorded was 65.34 m/min when driving unloaded and 53.32 m/min when driving loaded (Table 6). An F-test was performed to compare the variances between the average loaded and unloaded speeds recorded per cycle, followed by a t-test for comparing the means. When comparing the overall average speeds, the variances were found to be unequal and the means differed significantly (p<0.01). A Levene’s test demonstrated that the requirement of homogeneity was not met when comparing the loaded and unloaded speeds separately between machines. Therefore, a non-parametric Mann-Whitney U test was run to find that the difference in mean speeds was significant for the Elephant King machine (p<0.05), however not for the Buffalo machine.
3.6 Fuel Consumption
Fuel consumption rates were estimated in l/PMH1 and l/m3. When comparing machines by l/PMH1, the Buffalo machine had a notably lower rate (Buffalo = 15.55 l/PMH1, Elephant King = 20.57 l/PMH1); however, when comparing by l/m3, the rate of the larger Elephant King machine was slightly lower (Buffalo = 0.47 l/m3, Elephant King = 0.43 l/m3). Factors known to affect fuel consumption including speed, distance, load volume and productivity are included in Table 6.
Table 6 Summary of mean values
|
Machine |
Speed unloaded m/min |
Speed loaded m/min |
Cycle time min |
Extraction distance m |
Load volume m3 |
Fuel consumption l/m3 |
Productivity m3/PMH1 |
Fuel consumption l/PMH1 |
|
Buffalo |
56.05 |
52.45 |
29.91 |
102.47 |
16.64 |
0.47 |
34.08 |
15.55 |
|
Elephant King |
73.30 |
54.05 |
21.67 |
109.68 |
18.23 |
0.43 |
55.94 |
20.57 |
|
Overall |
65.34 |
53.32 |
25.47 |
106.35 |
17.50 |
0.41 |
45.85 |
17.85 |
When comparing fuel consumption rates per m3 amongst products, the smaller Buffalo machine had higher mean rates for each of the products extracted. The product that had the lowest fuel consumption rate per m3 for each machine was long sawlogs, and the highest fuel consumption occurred in the Hewsaw cycles (Fig. 6).
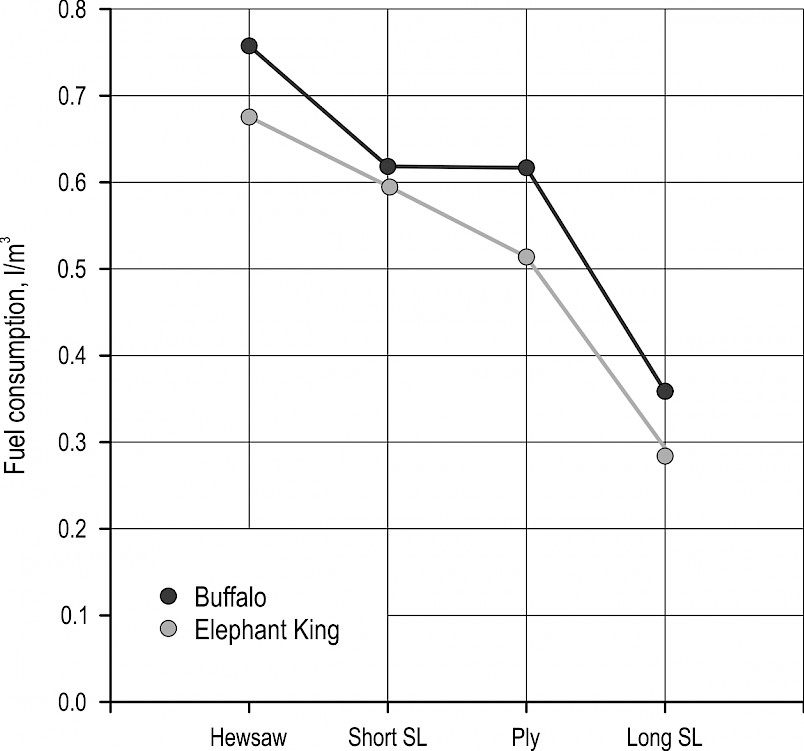
Fig. 6 Comparison of mean fuel consumption l/m3 per machine and per product
4. Discussion
4.1 Time Consumption
The greatest proportion of average time per cycle was spent in the loading phase (53%), which is similar although slightly higher compared to the findings of multiple studies (McNeel and Rutherford 1994, Ghaffariyan et al. 2012, Williams and Ackerman 2016, Strandgard et al. 2017, Proto et al. 2018). Since no product separation was required while loading in this study, it is likely to have shortened the loading and unloading times, however since only one product was extracted per cycle, more time could have been required based on the concentration of logs in the field. Exact log concentrations in the field were not measured throughout the study; however, the proportions of each product assortment extracted per machine were calculated to give a better idea of what was available for each product (Table 3). The second most time consuming cycle element was unloading (27%), which is also consistent with numerous studies (McNeel and Rutherford 1994, Ghaffariyan et al. 2012, Williams and Ackerman 2016). For the remaining cycle elements, driving unloaded was the third most time consuming (13%) and driving loaded was the least (7%). Since driving unloaded is typically at a faster speed than driving loaded it may appear to be contradicting that a greater proportion of time was spent driving unloaded; however, in order to maximize productivity, it is most efficient for the machine to drive the longest distances while unloaded to effectively utilize the difference in speed. The higher proportion of time spent driving unloaded can therefore likely be explained by farther travel distances throughout this phase as it coincided with the haulage instructions of the study for optimal productivity.
The mean time consumption per cycle in productive minutes was calculated to be 25.47 minutes overall, 29.91 minutes for the Buffalo, and 21.67 minutes for the Elephant King. The overall value is very similar to what was found by Strandgard et al. 2017 (25.4 minutes, SD = 1.2, range = 18.56–38.91) in a study examining a forwarder with an 18 ton nominal load capacity, which also extracted a variety of product assortments. At the individual machine level, the smaller Buffalo machine mean cycle time was higher, which is to be expected with machines of smaller sizes and capacities. This was also observed by Proto et al. 2018, where the small forwarder (12 ton capacity) mean cycle time was 33.2 minutes and the two larger forwarders (19 ton capacity) in the study averaged at 23.5 minutes per cycle.
It is well known that there are multiple interacting variables that affect the time consumption of forwarders such as driving speeds, extraction distance, volume of timber per load, number of products being extracted, and concentration/spacing of products in the field. Extraction distance is known to be especially related to cycle time and productivity and has been found to be a statistically significant variable in many studies (Jiroušek et al. 2007, Ghaffariyan et al. 2012, Strandgard et al. 2017, Proto et al. 2018). The average extraction distance of this study was 212.7 m overall (range = 25–316.6), 204.9 m for the Buffalo machine and 219.4 m for the Elephant King machine. These values are slightly lower than those reported by Strandgard et al. 2017 (428 m, range = 205–602); however, extraction distances are highly site-specific and they also varied considerably throughout this study based on availability of products in the field.
The concentration and spacing of products in the field is therefore another component to consider for predicting time consumption. When comparing cycle times of this study at the product level, much more variation occurred (Table 3). Previous studies involving multiple product assortments have found that the time consumption required for loading relied strongly on distance, which is related to log concentration in the field and the assortment being loaded (Nurminen et al. 2006, Strandgard et al. 2017). It has also been found that the loading of smaller products tends to require significantly more time due to their more uneven shape and likeliness of more scattered piles (Nurminen et al. 2006). The results of this study, however, show opposing trends between machines where on average Hewsaw, the product with the smallest volume, took the longest per cycle for the Elephant King machine but the shortest amount of time for the Buffalo machine. The second smallest product, ply, took the longest for the Buffalo and second longest for the Elephant King. The cause of these discrepancies is likely due to the differences in ways the operators loaded each machine as well as the spacing of the products in the field. It has been found that loading is most productive when the product is in larger and closer piles since it allows for the operator to load full grapples of timber more easily, which optimizes the machine’s capabilities (Nurminen et al. 2006). Although the time consumption required for driving empty and driving loaded is also dependant on volume and products per load, it is additionally strongly related to driving speed, extraction distance, and terrain conditions, although for this study terrain was consistent between machines (Nurminen et al. 2006, Strandgard et al. 2017). With regards to unloading, the factors known to affect time consumption most strongly are the number and size of assortments being unloaded (Nurminen et al. 2006).
4.2 Productivity Variables
Table 4 shows the means and ranges of the recorded variables, where overall average extraction distance was 212.7 m (range = 25–316.6), average load volume was 17.5 m3 (range = 5.91–24.42) and average number of logs per load was 82 (range = 19–288). The overall average load volume recorded is very close to that of Strandgard et al. 2017 (17.9 m3, range = 11.4–23.0 m3) for a forwarder with around the same average bunk capacity. In the same study, the mean number of logs per load was, however, much lower (47, range = 30–82), but this difference should be attributed to the smaller dimensions of the product assortments that were extracted throughout this study. The overall average load volume is also similar to what was found by Eriksson and Lindroos (2014), which was 16.4 m3 (range = 5–22), from a large-scale study that examined hundreds of machines. In this study, the larger Elephant King machine had a higher average load volume, which is to be expected based on the higher load capacity. McNeel and Rutherford (1994) found that their observed average load volume (7.48 m3 or 7.5 tons per cycle) was substantially lower than what the machine was capable of (10 ton capacity) and suggested that this discrepancy can happen due to the large amount of wasted space that can occur between smaller sized logs, which may have also been the case in this study.
The mean number of logs per load was not used for further analysis since it varied highly based on the product assortments of different sizes as well as the concentration that was available in the field. The two factors that were found to most strongly affect the productivity of the forwarders were extraction distance and load volume, which is consistent with many studies (Jiroušek et al. 2007, Ghaffariyan et al. 2012, Strandgard et al. 2017, Proto et al. 2018), and were therefore the focus of further modelling. Other factors known to affect productivity such as operator skills, slope, and natural site conditions were negligible, and therefore not further analysed.
4.3 Forwarder Productivity
The average productivity was 45.85 m3/PMH1 overall, which is similar to the range of previous studies such as by Williams and Ackerman 2016 (46.8 m3/ PMH1), Strandgard et al. 2017 (43.6 m3/ PMH1) and Ackerman et al. 2017 (45.92 m3/ PMH1). The average productivities per individual machine were 34.08 m3/PMH1 for the Buffalo and 55.94 m3/PMH1 for the Elephant King. This is much higher than the rates found by Proto et al. (2018), who recorded 18.9 m3/PMH1 for a medium sized forwarder and an average of 39.9 m3/PMH1 for two larger forwarders of similar capacities to the machines in our study, however their study sites had more difficult working conditions to consider like slope and wet ground conditions. The larger capacity Elephant King machine showed a higher productivity rate overall when compared to the Buffalo machine, as well as for each individual product. This is consistent with what was reported by Jiroušek et al. (2007) and Proto et al. (2018), who found that forwarders of higher carrying capacity will have higher productivities, which should in turn offset their higher overall costs by decreasing the costs per product unit (m3) extracted.
The ranking of the productivity for each product from highest to lowest was the same between machines, despite the small sample size of cycles for the smaller products. The average productivity of long sawlog cycles was by far the highest for each machine, and for each machine the long sawlog productivity was more than double than for the product with the lowest productivity rate, which was Hewsaw (Fig. 3). The second most productive product for each machine was Ply; however the difference between ply and short sawlogs for the Buffalo machine was very small (25.77 and 25.50 m3/ PMH1), likely due to the similar volumes of the two products (Table 5). Our results are consistent with studies that have also found forwarder productivity to vary with different product assortments (Kellogg and Bettinger 1994, Nurminen et al. 2006), which is clearly illustrated in Fig. 2. The recent study by Proto et al. (2018), however, found no significant differences in productivities observed between product assortments. Nonetheless, as previously discussed, smallest logs are typically associated with longer cycle times, which should therefore result in lower productivities (Nurminen et al. 2006, Strandgard et al. 2017), which was generally the case in this study.
4.4 Productivity Regression Analysis
General linear and multiple regression analysis was used for the development of equations for predicting forwarder productivity. Load volume and extraction distance were both found to be significant and the most important variables for predicting productivity overall as well as for each machine, as previously discussed and observed in many studies. The multiple regression models constructed accounted for 43% of variation overall, 80% of variation for the Buffalo, and 50% of variation for the Elephant King. These R2 values are slightly higher than what was produced by the model from Eriksson and Lindroos (2014) (R2=0.35), which also included extraction distance and load volume as variables; however, mean stem size was also included as an extra variable. This study’s R2 values fall within the common range acquired from other similar studies, where R2=0.36–0.91 (McNeel and Rutherford 1994, Nurminen et al. 2006, Jiroušek et al. 2007, Ghaffariyan et al. 2012, Williams and Ackerman 2016, Strandgard et al. 2017, Proto et al. 2018), all of which included extraction distance and load volume as variables in their model, although some also included slope.
To date, there have been many mixed results regarding slope as a significant factor for predicting forwarder productivity; however, since the slope was negligible for this study and both machines worked in the same compartment, it was not included in the models. The cause of the remaining unexplained variation may be attributed to other interacting variables that were not thoroughly examined, such as individual operator related factors and the quantity and concentration of products in the field. Similarly to Williams and Ackerman (2016), travel speeds were not found to be significant factors in attempts to model forwarder productivity and are therefore considered separately from the productivity models.
4.5 Travel Speed
The overall average speeds recorded are mostly similar to the findings of Nurminen et al. (2006), and Williams and Ackerman (2016), where the average speeds loaded were 43.9 and 53.0 m/min and average speeds unloaded were 56 and 58.1 m/min, respectively, both for similarly sized forwarders. Our averages were slightly higher than what was found for a 18 ton capacity forwarder by Strandgard et al. (2017) (loaded = 28.5 m/min, unloaded 44.5 m/min), although much lower than what was recorded by Proto et al. (2018) for both a 12 ton capacity forwarder (loaded = 62.5 m/min, unloaded = 111.33 m/min) and two 19 ton capacity machines (loaded = 61.33, 102.83 m/min, unloaded = 62.83 and 115 m/min). When comparing the average speeds per cycle overall, travelling loaded was significantly slower than travelling unloaded, which is consistent with the findings of numerous forwarder studies (Table 6). A much larger difference in average speed between driving loaded and unloaded was observed for the Elephant King machine, which likely corresponds to the heavier loads and overall characteristics of the machine, such as more wheels that facilitate faster driving in field, especially while driving unloaded. Speed is an important factor to consider for maximizing productivity, since as mentioned earlier, it is most optimal for the machine to drive the longest distances unloaded so it can travel at a faster speed. The recent study by Proto et al. (2018) found the difference in driving speeds of large forwarders in flat sites to be very similar and suggested that modern forwarders are powerful enough to only be limited by terrain factors instead of an empty or full load. It has, however, also been found that higher proportions of acceleration and stopping time tend to occur with shorter distances causing slower average speeds (Nurminen et al. 2006), which may be why a bigger difference was observed in this study, since it was designed to have the machines driving loaded for the shortest distances possible.
4.6 Fuel Consumption
Average fuel consumption was 15.55 l/PMH1 and 0.47 l/m3 for the Buffalo machine and 20.57 l/PMH1 and 0.43 l/m3 for the Elephant King machine. Truly accurate comparisons of fuel consumption rates are often difficult since there are multiple factors to consider such as machine characteristics, operator factors, site factors, and work load (Williams and Ackerman 2016). However, our findings were still relatively consistent with what was recorded by Williams and Ackerman (2016) under similar conditions in South Africa, where the average was 16.8 l/PMH1 and 0.41 l/m3 for the 18 ton capacity forwarder studied. Another known factor affecting fuel consumption rates is productivity, where higher productivity rates tend to correspond to lower fuel consumption (Nordfjell et al. 2003). As mentioned earlier, the more expensive associated costs of larger machines can be balanced by increased productivity per unit extracted, which is shown as the Elephant King machine had a lower average l/m3 rate of fuel consumption.
It is known that productivity should be positively correlated with efficiency of fuel consumption and emissions (Cosola et al. 2016). This was observed for both machines, as extracting long sawlog loads required significantly less fuel per m3 than the other products, which can be attributed to the higher productivity rate (m3/PMH1). As previously discussed, the longer associated loading times for products with smaller volumes should result in lower productivity and therefore higher fuel consumption rates (Nordfjell et al. 2003, Cosola et al. 2016). This trend was also observed between products as Hewsaw, the product with the smallest volume, required the most fuel per m3 extracted, while the product with the largest volume, long sawlogs, required the least. Nordfjell et al. (2003) also noted that, in order to maximize fuel consumption at the l/m3 level over long extraction distances, it is important to fully utilize the machine load capacity, which mostly occurred in this study when extracting larger products.
5. Conclusions
Accurate predictions for maximising the productivity of machines in mechanized cut-to length (CTL) harvesting are of high importance for planning and costing of forest operations. Time consumption and productivity were calculated and compared between two models of forwarders with different sizes and capacities. The effects of extracting products of four different sizes were also compared overall and between machines.,
Load volume and extraction distance were both significant factors in regression models for predicting forwarder productivity overall and for each size of machine. The larger machine obtained a higher rate of productivity overall as well as for each individual product when compared to the smaller machine. Average log volume was strongly positively correlated with productivity; therefore, the largest product assortment (long sawlog) was significantly the most productive to extract for each machine. The smaller machine consumed less fuel per PMH1 but the larger machine consumed less fuel per m3, suggesting that the higher associated costs of larger machines can still be offset or surpassed based on higher rates of productivity and lower extraction costs per unit. Preliminary estimates of fuel consumed per product showed that fuel consumption was lowest on average when extracting cycles of the largest product (long sawlogs), compared to highest for the product with the smallest volume (Hewsaw).
Results obtained can contribute to the database of forwarder productivity in mechanized harvesting operations in South Africa and the models developed could aid in predicting and planning for improved system productivity under similar conditions and stand characteristics.
Acknowledgments
We thank the management and operators at York Timbers for allowing data to be collected on their operations and work sites, as well as Mr. Dannyboy Seboa and Mr. Marius Terblanche for assisting with data collection.
Funding
This project was partly funded by TECH4EFFECT, a project that has received funding from the Bio-Based Industries Joint Undertaking under the European Union’s Horizon 2020 Research and Innovation programme under grant agreement No. 720757.
6. References
Ackerman, P., Gleasure, E., Ackerman, S., Shuttleworth, B., 2014: Standards for Time Studies for the South African Forest Industry.
Ackerman, P., Williams, C., Ackerman, S., Nati, C., 2017: Diesel Consumption and Carbon Balance in South African Pine Clear-Felling CTL Operations: A Preliminary Case Study. Croatian Journal of Forest Engineering 38(1): 65–72.
Cosola, G., Grigolato, S., Ackerman, P., Monterotti, S., Cavalli, R., 2016: Carbon Footprint of Forest Operations under Different Management Regimes. Croatian Journal of Forest Engineering 37(1): 201–217.
Erasmus, D., 1994: National Terrain Classification System for Forestry. Version 1.0. Institute for Commercial Forestry Research. ICFR. Pietermaritzburg, South Africa.
Eriksson, M., Lindroos, O., 2014: Productivity of harvesters and forwarders in CTL operations in northern Sweden based on large follow-up datasets. International Journal of Forest Engineering 25(3): 179–200. https://doi.org/10.1080/14942119.2014.974309
Ghaffariyan, M.R., Sessions, J., Brown, M., 2012: Machine productivity and residual harvesting residues associated with a cut-to-length harvest system in southern Tasmania. Southern Forests: a Journal of Forest Science 74(4): 229–235. https://doi.org/10.2989/20702620.2012.741770
Jiroušek, R., Klvač, R., Skoupý, A., 2007: Productivity and costs of the mechanised cut-to-length wood harvesting system in clear-felling operations. Journal of Forest Science 53(10): 476–482. https://doi.org/10.17221/2088-JFS
Kellogg, L., Bettinger, P., 1994: Thinning productivity and cost for mechanized cut-to-length system in the Northwest Pacific coast region of the USA. International Journal of Forest Engineering 5(2): 43–52. https://doi.org/10.1080/08435243.1994.10702659
Louw, J.H., Scholes, M., 2002: The influence of site factors on nitrogen mineralization in forest soils of the Mpumalanga escarpment area: South Africa. Southern African Forestry Journal 193(1): 47–63. https://doi.org/10.1080/20702620.2002.10433518
McNeel, J.F., Rutherford, D., 1994: Modelling Harvester-Forwarder System Performance in a Selection Harvest. International Journal of Forest Engineering 6(1): 7–14. https://doi.org/10.1080/08435243.1994.10702661
Nordfjell, T., Athanassiadis, D., Talbot, B., 2003: Fuel consumption in forwarders. International Journal of Forest Engineering 14(2): 11–20. https://doi.org/10.1080/14942119.2003.10702474
Nurminen, T., Korpunen, H., Uusitalo, J., 2006: Time consumption analysis of the mechanized cut-to-length harvesting system. Silva Fennica 40(2): 335–363. https://doi.org/10.14214/sf.346
Proto, A.R., Macrì, G., Visser, R., Harrill, H., Russo, D., Zimbalatti, G., 2018: Factors affecting forwarder productivity. European Journal of Forest Research 137(2): 143–151. https://doi.org/10.1007/s10342-017-1088-6
Purfürst, F.T., 2010: Learning Curves of Harvester Operators. Croatian Journal of Forest Engineering 31(2): 89–97.
Stankić, I., Poršinsky, T., Tomašić, Ž., Tonković, I., Frntić, M., 2012: Productivity Models for Operational Planning of Timber Forwarding in Croatia. Croatian Journal of Forest Engineering 33(1): 61–78.
Strandgard, M., Mitchell, R., 2015: Automated time study of forwarders using GPS and a vibration sensor. Croatian Journal of Forest Engineering 36(2): 175–184.
Strandgard, M., Mitchell, R., Acuna, M., 2017: Time consumption and productivity of a forwarder operating on a slope in a cut-to-length harvest system in a Pinus radiata D. Don pine plantation. Journal of Forest Science 63(7): 324–330. https://doi.org/10.17221/10/2017-JFS
Williams, C., Ackerman, P., 2016: Cost-productivity analysis of South African pine sawtimber mechanised cut-to-length harvesting. Southern Forests: a Journal of Forest Science 78(4): 267–274. https://doi.org/10.2989/20702620.2016.1183096
© 2019 by the authors. Submitted for possible open access publication under the
terms and conditions of the Creative Commons Attribution (CC BY) license (http://creativecommons.org/licenses/by/4.0/).
Authors’ addresses:
Kayla Gagliardi
e-mail: kaylagagliardi@hotmail.com
Simon Ackerman, MSc
e-mail: ackerman@sun.ac.za
Prof. Pierre Ackerman, PhD *
packer@sun.ac.za
Stellenbosch University
Faculty of AgriSciences
Department of Forest and Wood Science
Paul Sauer Building, Bosman Street
7600 Stellenbosch
Western Cape
SOUTH AFRICA
* Corresponding author
Received: August 18, 2019
Accepted: September 17, 2019
Original scientific paper