
Technical-Economic Analysis of Grapple Saw: A Stochastic Approach
doi: https://doi.org/10.5552/crojfe.2020.681
volume: 41, issue:
pp: 11
- Author(s):
-
- Miyajima Ricardo Hideaki
- Fenner Paulo Torres
- Batistela Gislaine Cristina
- Simões Danilo
- Article category:
- Original scientific paper
- Keywords:
- forest harvesting, Eucalyptus, production costs, Monte Carlo, productivity
Abstract
HTML
The processing of Eucalyptus logs is a stage that follows the full tree system in mechanized forest harvesting, commonly performed by grapple saw. Therefore, this activity presents some associated uncertainties, especially regarding technical and silvicultural factors that can affect productivity and production costs. To get around this problem, Monte Carlo simulation can be applied, or rather a technique that allows to measure the probabilities of values from factors that are under conditions of uncertainties, to which probability distributions are attributed. The objective of this study was to apply the Monte Carlo method for determining the probabilistic technical-economical coefficients of log processing using two different grapple saw models. Field data were obtained from an area of forest planted with Eucalyptus, located in the State of São Paulo, Brazil. For the technical analysis, the time study protocol was applied by the method of continuous reading of the operational cycle elements, which resulted in production. As for the estimated cost of programmed hour, the applied methods were recommended by the Food and Agriculture Organization of the United Nations. The incorporation of the uncertainties was carried out by applying the Monte Carlo simulation method, by which 100,000 random values were generated. The results showed that the crane empty movement is the operational element that most impacts the total time for processing the logs; the variables that most influence the productivity are specific to each grapple saw model; the difference of USD 0.04 m3 in production costs was observed between processors with gripping area of 0.58 m2 and 0.85 m2. The Monte Carlo method proved to be an applicable tool for mechanized wood harvesting for presenting a range of probability of occurrences for the operational elements and for the production cost.
Technical-Economic Analysis of Grapple Saw: A Stochastic Approach
Ricardo Hideaki Miyajima, Paulo Torres Fenner, Gislaine Cristina Batistela, Danilo Simões
Abstract
The processing of Eucalyptus logs is a stage that follows the full tree system in mechanized forest harvesting, commonly performed by grapple saw. Therefore, this activity presents some associated uncertainties, especially regarding technical and silvicultural factors that can affect productivity and production costs. To get around this problem, Monte Carlo simulation can be applied, or rather a technique that allows to measure the probabilities of values from factors that are under conditions of uncertainties, to which probability distributions are attributed. The objective of this study was to apply the Monte Carlo method for determining the probabilistic technical-economical coefficients of log processing using two different grapple saw models. Field data were obtained from an area of forest planted with Eucalyptus, located in the State of São Paulo, Brazil. For the technical analysis, the time study protocol was applied by the method of continuous reading of the operational cycle elements, which resulted in production. As for the estimated cost of programmed hour, the applied methods were recommended by the Food and Agriculture Organization of the United Nations. The incorporation of the uncertainties was carried out by applying the Monte Carlo simulation method, by which 100,000 random values were generated. The results showed that the crane empty movement is the operational element that most impacts the total time for processing the logs; the variables that most influence the productivity are specific to each grapple saw model; the difference of USD 0.04 m3 in production costs was observed between processors with gripping area of 0.58 m2 and 0.85 m2. The Monte Carlo method proved to be an applicable tool for mechanized wood harvesting for presenting a range of probability of occurrences for the operational elements and for the production cost.
Keywords: forest harvesting, Eucalyptus, production costs, Monte Carlo, productivity.
1. Introduction
In Brazil, commercial planting of forest species, mainly the genus Eucalyptus sp., is important from the economic perspective (3.7 million of jobs). They covers an area of 5.7 million hectares (BTI 2017), accounting for about 1% of the country’s gross domestic product (GDP). Under this perspective, the optimization of the mechanized forest harvesting operation, commonly used in Brazil, has paramount importance due to the capital necessary for providing the machinery, required for each forestry activity.
According to Enache et al. (2015), Lindroos et al. (2017), Norihiro et al. (2018), as a premise, it is important to understand the technical-economic factors, considering adequate design of machines and forest implements, as well as the financial sustainability of the entire forest production chain. In Brazil, the full tree system stands out as one of the most used forest harvesting systems (Malinovski et al. 2014).
Under this system, the processing of whole trees is carried out after the extraction phase. Therefore, it aims at log processing in lengths, which varies mainly according to the transportation mode and to industrial processes. This operation can be performed by a grapple saw, which has been already tested in other experiments (Spinelli et al. 2014, Spinelli et al. 2019).
A grapple saw delimits the length and processes tree bundles and typically is equipped with sensors, it measures length and diameter (Kellogg and Bettinger 1994) and allows crosscutting as a separate task, or as part of another task, such as prebunching, loading or stacking (Pottie and Guimier 1986).
Log processing is an essential part of the modal mechanized forest harvesting. It should be evaluated under the technical-economic aspect and above all, it should consider the uncertainties associated with the probability measurement of occurrence of variables of interest. One of the possibilities is to use probabilistic models, which according to Jastad et al. (2018), are the most appropriate to reality as they take the uncertainty factor into account, as well as the relations among the variables involved.
According to Raadgever et al. (2011) uncertainties can be defined as a situation in which there is no a unique and complete understanding of a particular management system. It is essential to identify the risks, and available methods and techniques applied in risk analysis as tool of investment measurement and management (Merkova and Drábek 2015). One of the techniques related to these uncertainties (technical and silvicultural) is the application of Monte Carlo simulation, which, according to Vajargah and Salimpour (2017), is an applied method for calculating the expected value of a random variable, flexible and simple tool that is widely used in the evaluation of random paths, based on the repetition of the same experiment and offering a higher degree of reliability (Chiacchio et al. 2016).
It is worth noting that this method can be applied in several areas, such as for a series of data, in order to obtain productivity projections of a given mechanized forest harvesting system (Robinson et al. 2016).
Given this context, it can be assumed that the logging activity has its associated uncertainties, and any failure to consider them could lead forest managers to wrong decisions, which justifies the development of models for the stochastic approach. Thus, the hypothesis of the study was that grapple saw with gripping area of 0.85 m2 compared to grapple saw with gripping area of 0.58 m2 will present differences in productivity and production cost.
Therefore, the objective of this study was to apply the Monte Carlo method for determining the probabilistic technical-economical coefficients of Eucalyptus logs processing using two grapple saw models with different technical characteristics.
2. Materials and Methods
2.1 Field Data
The study area was located in the geographical coordinates: 22º84' south latitude and 48º34' west longitude, in State of São Paulo, Brazil.
For the study, a 6-year-old Eucalyptus plantation was selected in a first rotation, initially planted in spacing 3×2 m. Based on pre-cut inventory data, the mean height of the trees was on average 20.87±3.28 m, with DBH of 14.95±3.62 cm and mean volume of 0.20 m3 per tree (merchantable timber).
2.2 Operation Productivity
For developing this study, a single operator with 18 months of experience in log processing was considered. Thus, only one machine with two different grapple saw heads was analyzed.
The machine was a John Deere model 2154D, with 13,514 hours of accumulated use, 159 hp of nominal power, with track and mass of 25,744 kg. At the front end, the machine was equipped with a hydraulic crane of 8.90 m, in which a J Souza grapple saw was attached, with the cutting speed of 4.55 m s-1. The grapple saw moved the tree bundles in the longitudinal direction towards the transverse saw for processing logs of 7.20 m in length along the forest roads.
Two operating conditions were evaluated, that is the grapple saw that differed in relation to the maximum opening of the claws, characterized as: grapple saw 1 (GS1) characterized by claws that allowed maximum opening of 2150 mm, with a gripping area of 0.58 m2, a 45" saw bar, total mass of 940 kg, purchased for USD 30,858.26; and grapple saw 2 (GS2) characterized by claws that allowed maximum opening of 2400 mm, i.e., with a gripping area of 0.85 m2, with a 52"saw bar, total mass of 1150 kg, purchased for USD 40,167.21.
In order to investigate the productivity (P), the ratio was determined of the volume of processed logs in cubic meters and the actual working time of the grapple saw. Then the protocol of time study was applied, with a digital timer by continuous reading of the operational cycle elements resulting in production, in accordance with Strandgard et al. (2019), excluding delays.
Thus, elements of the operational cycle (EOC) were divided into: picking up wood bundles (PWB), loading wood bundles (LWB), processing logs (PLO) and crane empty movement (CEM).
According to Howard (1989), time studies are usually performed by using sampling techniques. For calculating the minimum number of operating cycles, 60 operational cycles were used for a preliminary estimate of the sample size, therefore, 420 operational cycles were considered in order to obtain a sample with statistical validity, considering the mean EOC times and the sample standard deviation, according to Stevenson (2001), aiming at determining a 95% degree of accuracy and an error degree of 5%.
2.3 Operation Costs
Calculations of the estimated costs of the grapple saw programmed hour (CPH), according to Vangansbeke et al. (2015), Klepac and Mitchell (2016), based on the number of hours a machine is programmed to operate within a year, and on the utilization rate of the machine, were based on the cost control methods of the mechanized forest harvest recommended by the Food and Agriculture Organization of the United Nations (FAO 1992).
Fixed costs included the following cost elements (CE): depreciation, interest on the applied capital, labor, machine insurance and taxes. Variable costs included: fuel, maintenance and repairs, spare parts, lubricating oils and greases.
The machine was purchased for USD 238,796 and its expected economic life was five years, with a USD 47,759 residual value. In addition, the operator salary was USD 3.06 per work hour, to which 134% was added related to social charges. As for interests representing the remuneration of the applied capital, the Weighted Average Cost of Capital (WACC) was adopted, as the company owning the machine also owns the participation of the capital of third parties, that is, debt contraction. This, fundamentally, required the calculation of the cost for capital estimate, obtained by Capital Asset Pricing Model (CAPM).
Under this view, the machine production cost (MPC) used for processing logs was estimated assuming the traditional perspective, which refers to the ratio between the costs of the grapple saw programmed hour (CPH) and productivity (P).
2.4 Simulating Uncertainty
The protocol of the time study applied to forest harvest is a premise for sizing the modals; therefore, for determining the production costs, this protocol does not allow weighing the uncertainties associated to the parameters involved, mainly due to the fact that the time estimates are calculated for specific conditions. Besides, the machine programmed hourly cost was estimated in a direct and, therefore, in a deterministic manner, characterizing it under uncertainty conditions.
Thus, the following variables were defined as input parameters (inputs): cost elements, to which triangular probability distributions were attributed according to Stein and Keblis (2009), Simões et al. (2018), Fazlollahtabar (2019), based on the calculation of the base values, considering a variation of ±15.0%.
For the EOC field data and for the volume of processed wood (VPW) per cycle, the probability distributions were adjusted and, the Spearman's rank was calculated among EOCs due to the assumption of influence on the total time of the operational cycle.
Consequently, the Monte Carlo simulation method was applied by generating 100,000 random numbers, performed under @Risk software Copyright© 2018 Palisade Corporation (2018). The number generator was the Mersenne Twister, setting the initial parameter for the mathematical models. From continuous sample data obtained from simulated results, the analysis of the output variables (outputs) was carried out, namely the P, for CPH and MPC.
Under this perspective, the contributions of the variance of each input (EOC and VPW) were calculated for the P, that is, how much each input accounted for the output variance. For the CPH and MPC, Spearman's rank (Zhang et al. 2016, Kumar and Abirami 2018, Wang et al. 2019) was used to identify the monotonic relationship strength among the dependent and independent variables.
Finally, considering both inputs and outputs, probability distributions selection was performed via Bayes Information Criterium (BIC) (Burnham et al. 2011, Mehrjou et al. 2016, Campos et al. 2018) and for the normality assumption, the Kolmogorov-Smirnov (KS) test was applied at 1% level of significance (Xiao 2017, Baselice et al. 2019, Fang and Chen 2019).
3. Results and Discussion
3.1 Analysis of Operating Cycle Times of Grapple Saw
Once considering sampling adequacy, 134 and 286 operating cycles were analyzed, respectively, for grapple saw 1 (GS1) and grapple saw 2 (GS2). Concomitantly, the precision of the sample was 3.87% and 3.11%, based on the minimum sample size, which was 60 operating cycles. The total duration of the study was 13 hours and 20 minutes, which allowed the processing of 1466.80 cubic meters of wood.
When weighing the GS1, it was verified that the operational cycle average time was 96.94 seconds, due to 5.3 seconds demanded for PWB, 26.3 seconds consumed for LWB, 15.6 seconds for PLO and 39 seconds required for CEM. Therefore, the CEM was the EOC that explained most of the log processing time, corroborating with Minette et al. (2008) and Ghaffariyan et al. (2012) in studies on the P of the grapple saw.
Thus, Table 1 shows information on the probability distributions for the four EOCs that composed the GS1 operation, generated from real conditions, verifying that the field data of each element followed probability distributions, meaning that they have specific behaviors.
In the analysis of PWB, the best adjustment was through the distribution of exponential probability, which, according to Balakrishnan and Basu (1996), is one of the most significant and widely used distributions in the statistics area, and according to Lemonte (2013), it is a popular statistical model and probably one of the parametric models allowing application in several areas of knowledge.
As for LWB and PLO, the best adjustments obtained were the distribution of the Inverse Gaussian probability which, according to Lin and Wu (2011) and Wu and Li (2012), refers to an applied distribution, as a useful modeling tool in order to adjust data with asymmetry to the right and positive. Thus, these EOCs have an asymmetric and leptokurtic distribution and tend to approximate a normal distribution, which according to Ming, Yi and Shihua (2019) and Guan et al. (2019), can represent the uncertainties by obtaining a small standard deviation. With reference to CEM, the best probability was the gamma distribution that, according to Saitou (2013) and Tarbush (2018), is defined by the parameters of form (a>0) and scale (b>0), and has a fine right tail. Thus, the behavior of CEM was described by means of two parameters, based on a set of data with a known range of values.
Table 1 Parameters distributions of inputs of grapple saw 1
|
EOC |
Distributions |
α |
β |
µ |
λ |
|
PWB |
Exponential |
– |
2.29 |
– |
– |
|
LWB |
Inverse Gaussian |
– |
– |
13.85 |
19.40 |
|
PLO |
Inverse Gaussian |
– |
– |
9.87 |
15.80 |
|
CEM |
Gamma |
1.28 |
17.30 |
– |
– |
For analyzing the time of the elements of the operational cycle referring to GS2, it was verified that the average time of the operational cycle was 110.70 seconds; this way, the average time of the elements were: 6.7 seconds for PWB, 30.6 seconds for LWB, 19.5 seconds for PLO, and 49.4 seconds for CEM. This was an analogous condition to GS1, that is, the CEM element required the longest operating cycle, which was also confirmed by Fernandes et al. (2009) when analyzing grapple saws.
This way, analyzing the EOCs of the operational cycle for GS2 (Table 2), it was recognized that, for PWB, the best distribution adjustment was through the exponential distribution, and according to Balakrishnan and Davies (2013) and Ristic and Kundu (2015), one of the characteristics of this distribution is its application in several areas of study.
In addition, for LWB and PLO, the best adjustments were obtained for triangular probability distributions, which are a well-known class and often used in situations when the random variable cannot be determined (Glickman and Xu 2008, Nguyen and Mclachlan 2016). Regarding CEM, the best adjustment of probability was through the gamma distribution, which according to Gomes et al. (2008) and Boecket al. (2011), is often used to model data with right asymmetry, being a popular distribution.
Table 2 Parameters distributions of inputs of grapple saw 2
|
EOC |
Distributions |
Minimum |
Mean |
Maximum |
α |
β |
|
PWB |
Exponential |
– |
– |
– |
– |
3.68 |
|
LWB |
Triangular |
15.34 |
19.57 |
57.39 |
– |
– |
|
PLO |
Triangular |
6.21 |
11.00 |
41.12 |
– |
– |
|
CEM |
Gamma |
– |
– |
– |
1.25 |
25.05 |
By exploring the average EOC times, it was possible to verify that the technical characteristics of the machines influenced the total time of the operation, considering that other variables that could affect the time of the operating cycles were kept constant.
The difference in the mass of the forest implements, (210 kg) due to the gripping area and, consequently, the number of trees per cycle, required the intensification of mechanical force in the hydraulic arm of machine, requiring longer time for the elements, mainly by CEM, since it was the EOC that demanded greater movement of the forestry implement.
3.2 Stochastic Analysis of Productivity
The productivity with the grapple saw can be considered one of the most important cost drivers of the harvesting activity. In other words, from this technical coefficient, it is possible to establish the production cost of the operation.
Under this view, as a premise, it was found that the productivity data for GS1 do not follow a normal distribution (KS=0.0061). Thus, the P had the best adjustment (BIC=1,090,122.11) by the gamma probability distribution, with shape parameter a=4.30 and scale parameter b=29.29, with strong and positive asymmetry (0.96) and degree of platykurtic kurtosis (4.39). In accordance with Timpson et al. (2018) and Bobotas (2019), this probability distribution is an important model in statistical theory and practice, for considering parameters such as form and dispersion of data around the average. The average productivity was 144.33 m3h-1 and the standard deviation ±61.17 m3h-1.
As for GS2, the productivity data did not follow a normal distribution (KS=0.0098) either, and similarly to GS1, the best adjustment (BIC=1,122,784.92) was obtained by the gamma probability distribution model (a=2.85 and b=44.61). By observing the asymmetry and kurtosis coefficients, which according to Zhou (2002), aid in the quantification of distribution deviations, a strong and positive asymmetry (1.18) was measured, with a (5, 10) degree of kurtosis.
Thus, the mean productivity was 147.04 m3h-1 and standard deviation ±75.36 m3h-1, that is, higher values than those determined by Fiedler et al. (2008), who had found an average productivity of 84 m3h-1. However, this difference can be attributed to the gripping area of the grapple saw, followed by VPW, as reported by these authors.
Characterizing the association of EOC and VPW with P, it is observed in Fig. 1 that, for the GS1, VPW has a moderate positive nonlinear correlation (ρs=0.73), this is, the increase in VPW tends to increase the productivity.
This condition is corroborated by the studies carried out by Lopes et al. (2008) and Strandgard et al. (2014), who pointed out that the volume of trees was the most influential factor on the productivity of grapple saws.
In relation to CEM and PWB, the nonlinear correlation can be considered as moderate negative (0.50<|ρs|<0.51), and a weak nonlinear negative correlation can be detected for LWB and PLO (0.31<|ρs|<0.34).
Regarding GS2, correlations that can be considered as strong negative (0.80<|ρs|<0.82) between P and EOC have been verified, as well as a moderate positive correlation (ρs=0.56) between VPW and P; thus, there is a direct correlation. Therefore, the higher VPW per operating cycle, the higher is the increase in productivity.
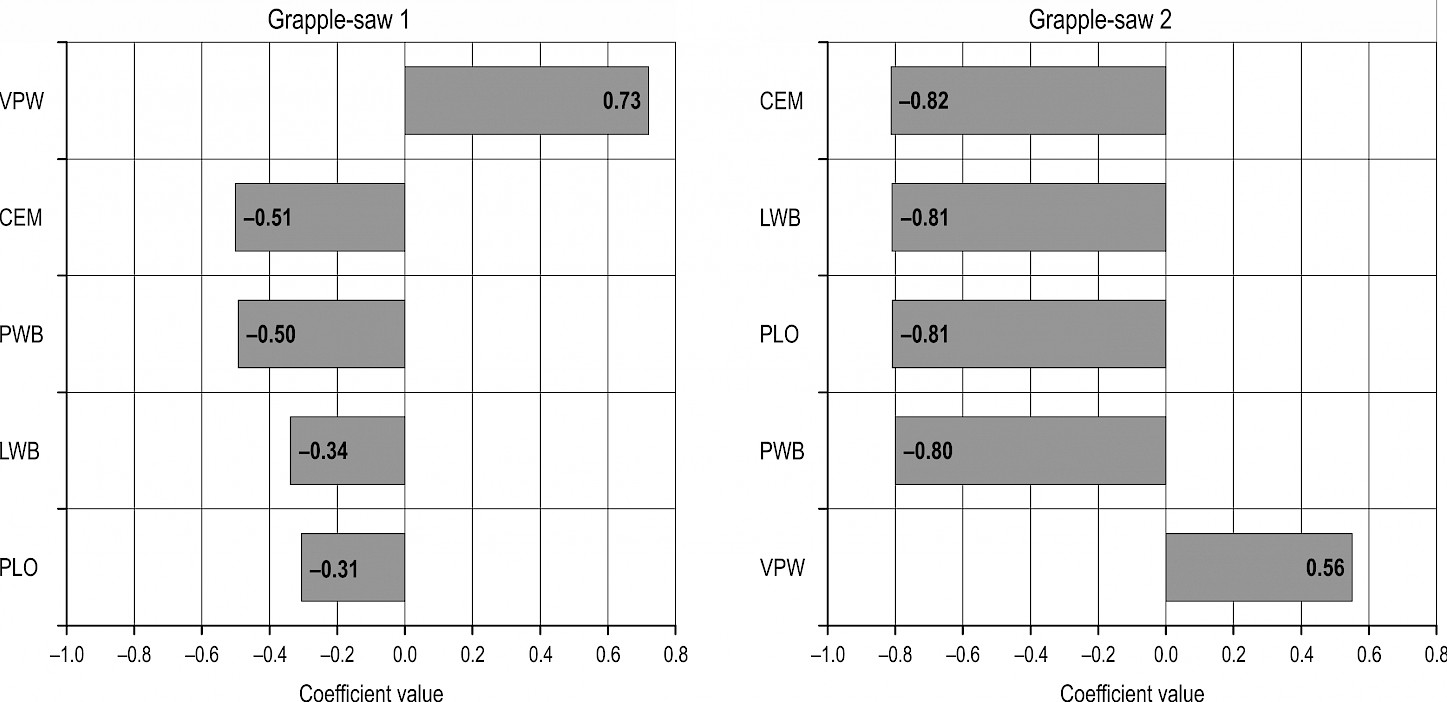
Fig. 1 Spearman´s rank of five dependent variables with the highest impact on productivity
3.3 Stochastic Analysis of Operating Costs
It is not easy to make estimates of the programmed hourly cost of machines and it has been a controversial issue both in the scientific community and in forest companies, especially due to the accuracy of the information from machine owners. Justifying this condition, it was possible to verify that the CPH data of GS1 does not follow a normal distribution (KS=0.0028) by applying the generation of random values, and under this situation, the best adjustment (BIC=374,640.72) was obtained by the beta distribution model with continuous shape parameters (a1, a2 > 0) a1 = 13.53 and a2 = 10.20.
Jung et al. (2019) and Du et al. (2019) point out that beta distribution allows for flexibility to model different dispersion environments. As for the asymmetry (–0.11), which can be considered weak and negative, according to Milanesi (2013), this value confirms that the probability does not follow a normal distribution, especially with a (2.79) degree of Platykurtic kurtosis.
It is worth noting that kurtosis refers to the degree of flattening or relative elevation of a distribution (Muzuel et al. 2014). Considering this, the average CPH of the GS1 was USD 67.11 h-1 and the standard deviation ±USD 1.58 h-1, considering the minimum value of USD 58.07 h-1. These monetary values were higher than the calculation estimates by Rocha et al. (2009), who obtained the value of USD 58.47 h-1 for similar forest conditions.
It should be highlighted that the differences in CPH calculation estimates can be explained by the calculations adopted, by means of direct methodologies, with different technical factors or yet, determined by the consumption of resources.
Among the CEs composing the CPH in the operation of GS1 (Fig. 2), the expenses related to fuel contributed the most (55.60%) to the variance of the mean value of CPH, meaning that the average CPH ranged between USD 65.01 h-1 and USD 69.04 h-1. Another CE assumed to be determinant was the labor, accounting for 20.15% of CPH variance; namely between USD 65.83 h-1 and USD 68.26 h-1.
When analyzing the CPH of GS2, it was found that the data did not follow a normal distribution (KS=0.0026), and the best adjustment (BIC=376,302.95) was obtained by the beta distribution model, with continuous shape parameters a1=13.90 and a2=10.47. This way, the average CPH was USD 68.11 h-1 and standard deviation ± USD 1.59 h-1, considering the minimum value of USD 58.87 h-1. The mean CPH was $ 15.25 lower than the CPH obtained by Magagnotti et al. (2013), who applied methods proposed by Miyata (1980). The difference between the CPH of GS1 and GS2 can be attributed due to the difference in the acquisition value of the grapple saw head, which was USD 9308.95. Moreover, this difference was still due to PHM, therefore, it was 1.87% higher for GS2. These were the main factors that influenced the difference between the CPH.
Observing the CE, respectively, it was verified that the monetary expenditure related to fuel was the most impacting over the value of the CPH variance, representing 54.69% of the variance of the CPH average value, this is, the average value ranged between USD 66.01 h-1 and USD 70.03 h-1. Shortly thereafter, labor accounted for 19.82% of the CPH variance, revealing a CPH variation between USD 66.83 h-1 and USD 69.25 h-1. Thus, the monetary expenditure related to fuel for both grapple saws is what impacted the CPH the most, as confirmed by Simões et al. (2014), who analyzed the production costs of a grapple saw while processing logs of Eucalyptus grandis Hill ex Maiden of 6 meters in length.
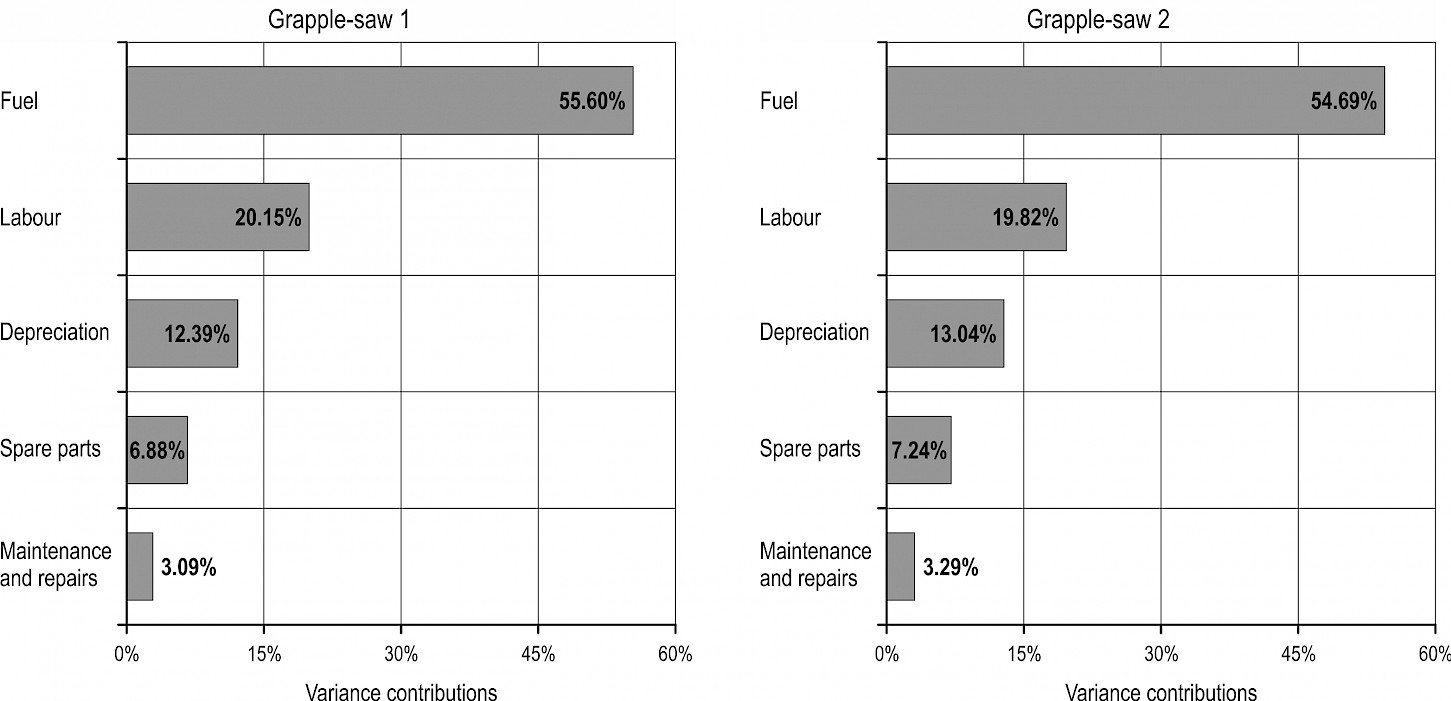
Fig. 2 Contribution of cost elements (USD h-1) to CPH variance
When considering the MPC with GS1, it was verified that it does not follow a normal distribution (KS=0.0027). Thus, the best adjustment (BIC=–21,888.61) was obtained by the inverse Gaussian distribution model. According to Ye and Chen (2014) and Lu (2016), this type of distribution is based on two parameters of continuous probability distributions, and being flexible to incorporate random effects and explanatory variables, it is still widely applied with strong and positive asymmetry (1.64) and degree of Platykurtic kurtosis (7.46). This way, the mean MPC was USD 0.56 m-3 and standard deviation ± USD 0.26 m-3, with the 5 and 95 percentiles (Fig. 3), meaning that 95% of the random values generated by the MPC are between USD 0.26 m-3 and USD 1.07 m-3.
For the analysis of the inputs that influenced the MPC the most, i.e. the Spearman's rank of GS1 in relation to the variable of interest, it was found that the VPW was the factor that most negatively influenced the MPC, due to the strong correlation (ρs=–0.72), followed by CEM and PWB, which presented moderate positive coefficients (ρs=0.50). Although these classifications may have an ambiguous character, the interpretations were ruled according to Daniel (1978).

Fig. 3 Probability Density Function (PDF) of the production costs of log processing operation for grapple saw 1
For the analysis of MPC with GS2, the data do not follow a normal distribution (KS=0.0068). Thus, the best adjustment (BIC=22,139.23) was obtained by the inverse Gaussian distribution model, with strong and positive asymmetry (1.87) and (8.80) degree of Platykurtic kurtosis. According to Hou and Wentzell (2011) and Liu et al. (2018), a Platykurtic kurtosis is characterized by wide and flat distributions.
This way, it resulted in a production cost of USD 0.60 m-3, and a standard deviation of USD 0.35 m-3, and yet with the percentiles 5 and 95 (Fig. 4), meaning that 5% of the random values generated by MPC are lower than USD 0.23 m-3 or higher than USD 1.27 m-3.
When considering the most significant inputs for the CPM with GS2, a Spearman correlation coefficient for the positive CEM, LWB, PLO and PWB elements (ρs=0.80) was found. The analysis of the MPC for GS1 and for GS2 showed that the values were lower than those reported in the study by Bolding et al. (2009) for the operation of a grapple saw in coniferous forest.
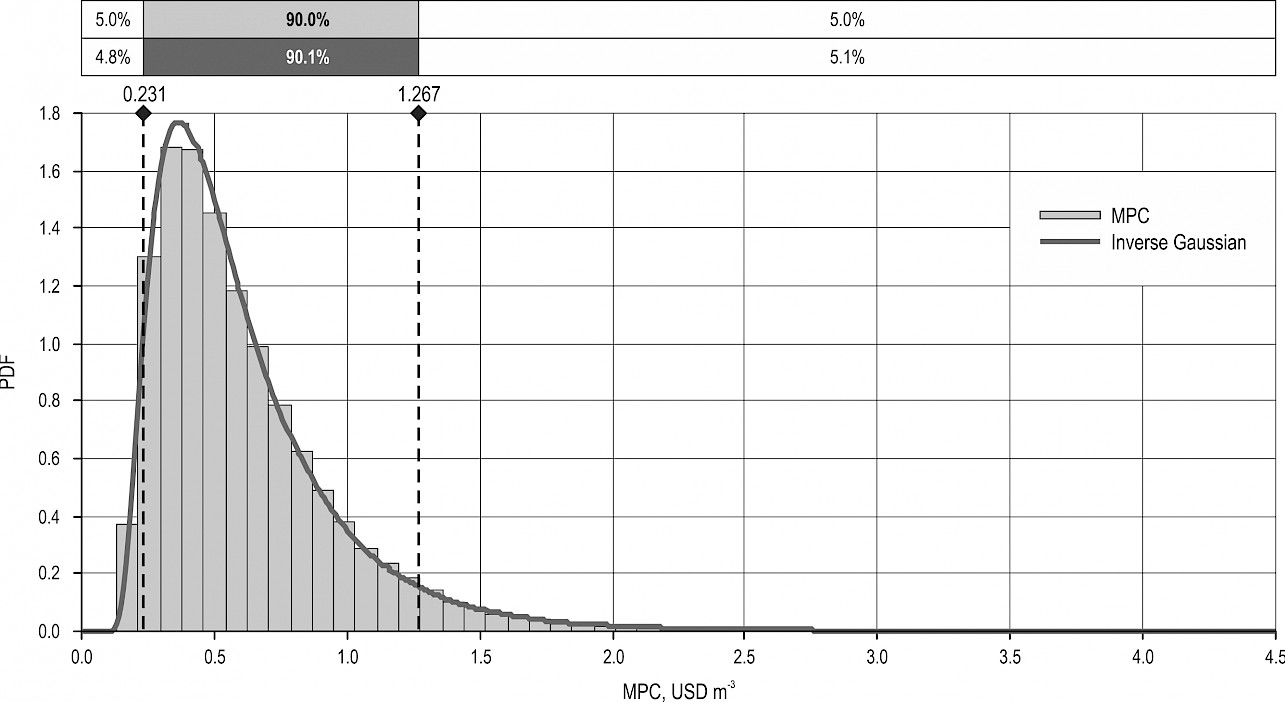
Fig. 4 Probability Density Function (PDF) of production costs of log processing operation of grapple saw 2
4. Conclusion
The Monte Carlo method was an applicable tool to compare the productivity and costs of timber processing by different grapple saws. The crane empty movement represented, on average, 48.86% of the total time of the operational cycle, or rather, it is the operational element with the highest impact on the total time of log processing. The difference in mass between the forest implements influences the time of empty crane movement during Eucalyptus log processing with grapple saw. The most relevant variable for determining the productivity of grapple saw with a gripping area of 0.58 m2 is the volume of processed wood, while the empty crane movement is the most relevant variable for the grapple saw with a gripping area of 0.85 m2. The production cost of the machine with grapple saw with a gripping area of 0.58 m2 was 6.67% lower than the production cost of the grapple saw with a gripping area of 0.85 m2.
Acknowledgements
The present work has been carried out with the support of the Coordination of Improvement of Higher Education Personnel – Brazil (CAPES) – Financing Code 001.
5. References
Alvares, C.A., Stape, J.L., Sentelhas, P.C., Gonçalves, J.L.M., Sparovek, G., 2013: Koppen`s climate classification map for Brazil. Meteorologishe Zeitschrift 22(6): 711–728. https://doi.org/10.1127/0941-2948/2013/0507
Balakrishnan, N., Basu, A.P., 1996: Exponential Distribution: Theory, Methods and Applications. CRC PRESS, 664 p.
Balakrishnan, N., Davies, K.F., 2013: Pitman closeness results for Type-I censored data from exponential distribution. Statistics & Probability Letters 83(12): 2693–2698. https://doi.org/10.1016/j.spl.2013.09.007
Baselice, F., Ferraioli, G., Pascazio, V., Sorriso, A., 2019: Denoising of MR images using Kolmogorov-Smirnov distance in a Non Local framework. Magnetic Resonance Imaging 57: 176–193. https://doi.org/ 10.1016/j.mri.2018.11.022
Bobotas, P., 2019: Improved estimation of the smallest scale parameter of gamma distributions. Journal of the Korean Statistical Society 48(1): 97–105. https://doi.org/10.1016/j.jkss.2018.08.007
Boeck, B., Thas, O., Rayner, J.C.W., Best, D., 2011: Smooth tests for the gamma distribution. Journal of Statistical Computation and Simulation 81(7): 843–855. https://doi.org/10.1080/00949650903520936
Bolding, M.C., Kellogg, L.D., Davis, C.T., 2009: Productivity and costs of an integrated mechanical forest fuel reduction operation in southwest Oregon. Forest Products Journal 59(3): 35–46.
Brazilian Tree Industry, 2017: Annual Report. Accessed March 14, 2019. https://iba.org/images/shared/Biblioteca/IBA_RelatorioAnual2017.pdf, 80 p. (in Portuguese)
Burnham, K.P., Anderson, D.R., Huyvaert, K.P., 2011: AIC model selection and multimodel inference in behavioral ecology: some background, observations, and comparisons. Behavioral Ecology and Sociobiology 65(1): 23–35. https://doi.org/10.1007/s00265-010-1084-z
Campos, C.P., Scanagatta, M., Corani, G., Zaffalon, M., 2018: Entropy based pruning for learning Bayesian networks using BIC. Artificial Intelligence 260: 42–50. https://doi.org/10.1016/j.artint.2018.04.002
Chiacchio, F., Urso, D.D., Manno, G., Compagno, L., 2016: Stochastic hybrid automaton model of a multi-state system with aging: Reliability assessment and design consequences. Reliability Engineering & System Safety 149: 1–13. https://doi.org/10.1016/j.ress.2015.12.007
Chu, X., 2011: Evolution of an airy beam in turbulence. Optics Letters 36(14): 2701–2703. https://doi.org/10.1364/OL.36.002701
Cunha, A.R., Martins, D., 2009: Climatic classification for the districts of Botucatu and São Manuel, SP. Irriga 14(1): 1–11.
Daniel, W.W., 1978: Applied nonparametric statistics. Boston: Houghton-Mifflin, 503 p.
Du, D., Jian, X., Hu, L., Tan, Y., Zeng, X., Tan, X., 2019: Angular beta distribution for 3D vehicle to vehicle channel modeling. Future Generation Computer Systems 91: 238–242. https://doi.org/10.1016/j.future.2018.09.021
Enache, A., Kühmaier, M., Visser, R., Stampfer, K., 2015: Forestry operations in the european mountains: A study of current practices and efficiency gaps. Scandinavian journal of forest research 31(4): 412–427. https://doi.org/10.1080/02827581.2015.1130849
Fang, F., Chen, Y., 2019: A new approach for credit scoring by directly maximizing the Kolmogorov-Smirnov statistic. Computacional Statistics and Data Analysis 133: 180–194. https://doi.org/10.1016/j.csda.2018.10.004
Fazlollahtabar, H., 2019: Triple state reliability measurement for a complex autonomous robot system based on extended triangular distribution. Measurement 139: 122–126. https://doi.org/10.1016/j.measurement.2019.02.016
Fernandes, H.C., Lopes, S.E., Teixeira, M.M., Minette, L.J., Rinaldi, P.C.N., Bernardes, A.M., 2009: Technical and economic evaluation of a full tree harvesting system. Scientia Forestalis 37(83): 225–232.
Fiedler, N.C., Rocha, E.B., Lopes, E.S., 2008: Analysis of productivity on complete tree harvesting system in north of the Goias State, Brazil. Floresta 38(4): 577–586. https://doi.org/ 10.5380/rf.v38i4.13153
FAO, 1992: Cost control in forest harvesting and road construction. Rome, Forestry Paper 99, 121 p.
Ghaffariyan, M.R., Acuna, M., Kellog, L., 2012: Productivity of roadside processing system in Western Australia. Silva Balcanica 13(1): 49–60.
Glickman, T.S., Xu, F., 2008: The distribution of the product of two triangular random variables. Statistics & Probability Letters 78(16): 2821–2826. https://doi.org/10.1016/j.spl.2008.03.031
Gomes, O., Combes, C., Dussauchoy, A., 2008: Parameter estimation of the generalized gamma distribution. Mathematics and Computers in Simulation 79(4): 955–963. https://doi.org/10.1016/j.matcom.2008.02.006
Guan, J., Yuan, P., Hu, X., Qing, L., Yao, X., 2019: Statistical analysis of concrete fracture using normal distribution pertinent to maximum aggregate size. Theoretical and Applied Fracture Mechanics 101: 236–253. https://doi.org/10.1016/j.tafmec.2019.03.004
Hou, S., Wentzell, P.D., 2011: Fast and simple methods for the optimization of kurtosis used as a projection pursuit index. Analytica Chimica Acta 704(1–2): 1–15. https://doi.org/10.1016/j.aca.2011.08.006
Howard, A.F., 1989: A sequential approach to sampling design for time studies of cable yarding operations. Canadian Journal of Forest Research 19(8): 973–980. https://doi.org/10.1139/x89-149
Jastad, E.O., Mustapha, W.F., Bolkesjo, T.F., Tromborg, E., Solberg, B., 2018: Modelling of uncertainty in the economic development of the Norwegian forest sector. Journal of Forest Economics 32: 106–115. https://doi.org/10.1016/j.jfe.2018.04.005
Jung, K., Shin, J.Y., Park, D., 2019: A new approach for river network classification based on the beta distribution of tributary junction angles. Journal of Hydrology 572: 66–74. https://doi.org/10.1016/j.jhydrol.2019.02.041
Kellogg, L.D., Bettinger, P., 1994: Thinning productivity and cost for mechanized cut-to-length system in the Northwest Pacific coast region of the USA. Journal of Forest Engineering 5(2): 43–54. https://doi.org/10.1080/08435243.1994.10702659
Klepac, J., Mitchell, D., 2016: Comparison of four harvesting systems in a loblolly pine plantation. Professional Agricultural Workers Journal 4(1): 1–14.
Kumar, A., Abirami, S., 2018: Aspect based opinion ranking framework for product reviews using a Spearman`s rank correlation coefficient method. Information Sciences 460: 23–41. https://doi.org/10.1016/j.ins.2018.05.003
Lemonte, A.J., 2013: A new exponential-type distribution with constant, decreasing, increasing, upside-down bathtub and bathtub-shaped failure rate function. Computational Statistics and Data Analysis 62: 149–170. https://doi.org/10.1016/j.csda.2013.01.011
Lin, S.H., Wu, I.M., 2011: On the common mean of several inverse Gaussian distributions based on a higher order likelihood method. Applied Mathematics and Computation 217(12): 5480–5490. https://doi.org/10.1016/j.amc.2010.12.019
Lindroos, O., La Hera, P., Haggstrom, C., 2017: Drivers of Advances in Mechanized timber harvesting a selective review of technological innovation. Croatian Journal of Forest Engineering 38(2): 243–258.
Liu, S., Hou, S., He, K., Yang, W., 2018: L-Kurtosis and its application for fault detection of rolling element bearings. Measurement 116: 523–532. https://doi.org/10.1016/j.measurement.2017.11.049
Lopes, S.E., Fernandes, H.C., Santos, N.T., Rinaldi, P.C.N., 2008: Technical and economical evaluation of a slacher, operating under different productivities. Scientia Forestalis 36(79): 215–222.
Lu, D., 2016: Certain approximations to achieve sharp lower and upper bounds for the Mills ratio of the inverse Gaussian distribution. Journal of Mathematical Analysis and Applications 444(1): 737–744. https://doi.org/10.1016/j.jmaa.2016.06.059
Magagnotti, N., Picchi, G., Spinelli, R., 2013: A versatile machine system for salvaging small-scale forest windthrow. Biosystem Engineering 115(4): 381–388. https://doi.org/10.1016/j.biosystemseng.2013.05.003
Malinovski, J.R., Camargo, C.M.S., Malinovski, R.A., Malinovski, R.A., Castro, G.P., 2014: Systems In: Machado, C. C. Colheita Florestal. 3. ed. Viçosa, MG: Editora UFV, 2014. cap. 6, 179–205.
Mehrjou, A., Hosseini, R., Araabi, B.N., 2016: Improved Bayesian information criterion for mixture model selection. Pattern Recognition Letters 69: 22–27. https://doi.org/10.1016/j.patrec.2015.10.004
Merkova, M., Drábek J., 2015: Use of risk analysis in investment measurement and management. Procedia Economics and Finance 34: 656–662. https://doi.org/10.1016/S2212-5671(15)01682-2
Miguel, E.P., Leal, F.A., Ono, H.A., Leal, U.A.S., 2014: Modeling in the prediction of individual volume in planting of Eucalyptus urograndis. Revista Brasileira de Biometria 32(4): 584–598.
Milanesi, G.S., 2013: Skewness and Kurtosis in the Binomial model for assessing real options: na application case for technological firms. Estudios Gerenciales 29(128): 368–378. https://doi.org/10.1016/j.estger.2013.09.011
Minette, L.J., Silva, E.N., Freitas, K.E., Souza, A.P., Silva, E.P., 2008: Technical and economical analysis of the automated forest harvesting in Niquelândia, Goiás. Revista Brasileira de Engenharia Agrícola e Ambiental 12(6): 659–665.
Miyata, E.S., 1980: Determining fixed and operating costs of logging equipment. 1. ed. Minnesota: USDA Forest Service General Technical Report NC-55. St Paul, Minnesota: US Department of Agriculture, Forest Service, North Central Forest Experiment Station, 16 p.
Ming, G.Z., Yi, J., Shihua, B., 2019: Detection probability for moving ground target of normal distribution using infrared satellite. Optik 181: 63–70. https://doi.org/10.1016/j.ijleo.2018.12.025
Nguyen, H.D., McLachlan, G.J., 2016: Maximum likelihood estimation of triangular and polygonal distributions. Computational Statistics and Data Analysis 102: 23–36. https://doi.org/10.1016/j.csda.2016.04.003
Norihiro, J., Ackerman, P., Spong, B.D., Langin, D., 2018: Productivity model for cut to length harvester operation in South African eucalyptus pulpwood plantations. Croatian Journal of Forest Engineering 9(1): 1–13.
Palisade Corporation, 2018. @Risk. V. 7.5.2 Newfield: Palisade Corporation.
Pottie, M., Guimier, D., 1986: Harvesting and transport of logging residuals and residues. FERIC special report SR-33, Pointe Claire, Quebec: Forest Engineering Res. Inst. of Canada.
Raadgever, G.T., Dieperink, C., Driessen, P.P.J., Smit, A.A.H., Rijswick, H.F.M.W., 2011: Uncertainty management strategies: Lessons from the regional implementation of the Water Framework Directive in the Netherlands. Environmental Science & Policy 14(1): 64–75. https://doi.org/10.1016/j.envsci.2010.11.001
Ristic, M.M., Kundu, D., 2015: Marshall-Olkin generalized exponential distribution. Metron 73(3): 317–333. DOI: 10.1007/s40300-014-0056-x
Robinson, A.P., McLarin, M., Moss, I., 2016: A simple way to incorporate uncertainty and risk into forest harvest scheduling. Forest Ecology and Management 359: 11–18. https://doi.org/10.1016/j.foreco.2015.09.027
Rocha, E.B., Fiedler, N.C., Alves, R.T., Lopes, E.S., Guimarães, P.P., Peroni, L., 2009: Productivity and costs of a full tree harvesting system. Cerne 15(3): 372–381.
Saitou, N., 2013: Gamma distribution. Brenner s Encyclopedia of Genetics, 2 ed., 157 p.
Santos, H.G., Almeida, J.A., Oliveira, J.B., Lumbreras, J.F., Anjos, L.H.C., Coelho, M.R., Jacomine, P.K.T., Cunha, T.J.F., Oliveira, V.A., 2018: Brazilian Soil Classification System. 5. ed. Brasília: EMBRAPA, 353 p.
Simões, D., Fenner, P.T., Esperancini, M.S.T., 2014: Productivity and costs of feller-buncher and forest processor in stands of eucalyptus in first cut. CiênciaFlorestal 24(3): 621–630. https://doi.org/10.1590/1980-509820142403010
Simões, D., Miyajima, R.H., Tonin, R.P., Fenner, P.T., Batistela, G.C., 2018: Incorporation of uncertainty in technical and economic analysis of a feller-buncher. Floresta 48(3): 403–412.
Spinelli, R., Ebone, A., Gianella, M., 2014: Biomass production from traditional coppice management in northern Italy. Biomass and Bioenergy 62: 68–73. https://doi.org/10.1016/j.biombioe.2014.01.014
Spinelli, R., Lombardini, C., Aminti, G., 2019: A low-investment technology for the simplified processing of energy wood from coppice forests. European Journal of Forest Research 138(1): 31–41. https://doi.org/10.1007/s10342-018-1150-z
Stein, W., Keblis, M., 2009: A new method to simulate triangular distribution. Mathematical and Computer Modelling 49(5–6): 1143–1147. https://doi.org/10.1016/j.mcm.2008.06.013
Stevenson, W.J., 2001: Administration of production operations 6. ed. Rio de Janeiro: LTC 701 p.
Strandgard, M., Alam, M., Mitchell, R., 2014: Impact of slope on productivity of a self leveling processor. Croatian Journal of Forest Engineering 35(2): 193–200.
Strandgard, M., Mitchell, R., Wiedemann, J., 2019: Comparison of productivity, cost and chip quality of four balanced harvest systems operating in a eucalyptus globulus plantation in Western Australia. Croatian Journal of Forest Engineering 40(1): 39–48.
Tarbush, B., 2018: Hotelling competition and the gamma distribution. Games and Economic Behavior 111: 222–240. https://doi.org/10.1016/j.geb.2018.06.009
Timpson, A., Gillis, R.E., Manning, K., Thomas, M.G., 2018: Modelling caprine age at death profiles using the gamma distribution. Journal of Archaeological Science 99: 19–26. https://doi.org/10.1016/j.jas.2018.08.015
Vajargah, B.F., Salimipour, A., 2017: Evaluating Wave Random Path Using Multilevel Monte Carlo. International Journal of e-Navigation and Maritime Economy 7: 1–10. https://doi.org/10.1016/j.enavi.2017.06.001
Vangansbeke, P., Osselaere, J., Van Dael, M., De Frenne, P., Gruwez, R., Pelkmans, L., Gorissen, L., Verheyen, K., 2015: Logging operations in pine stands in Belgium with additional harvest of woody biomass: yield, economics, and energy balance. Canadian Journal of Forest Research 45(8): 987–997. https://doi.org/10.1139/cjfr-2014-0521
Wang, B., Wang, R., Wang, Y., 2019: Compatible matrices of Spearman’s rank correlation. Statistics & Probability Letters 151: 67–72. https://doi.org/10.1016/j.spl.2019.03.015
Wu, L., Li, H., 2012: Variable selection for joint mean and dispersion models of the inverse Gaussian distribution. Metrika 75(6): 795–808. https://doi.org/10.1007/s00184-011-0352-x
Xiao, Y., 2017: A fast algorithm for two dimensional Kolmogorov-Smirnov two sample tests. Computational Statistics & Data Analysis 105: 53–58. https://doi.org/10.1016/j.csda.2016.07.014
Ye, Z.S., Chen, N., 2014: The Inverse Gaussian Process as a Degradation Model. Technometrics 56(3): 302–311. https://doi.org/10.1080/00401706.2013.830074
Zhang, W.Y., Wei, Z.W., Wang, B.H., Han, X.P., 2016: Measuring mixing patterns in complex networks by Spearman rank correlation coefficient. Physica A: Statistical Mechanics and its Applications 451: 440–450. https://doi.org/10.1016/j.physa.2016.01.056
Zhou, A., 2002: Modeling the volatility of the Heath–Jarrow–Morton model: a multifactor GARCH analysis. Journal of Empirical Finance 9(1): 35–56. https://doi.org/10.1016/S0927-5398(01)00044-5
© 2019 by the authors. Submitted for possible open access publication under the
terms and conditions of the Creative Commons Attribution (CC BY) license (http://creativecommons.org/licenses/by/4.0/).
Authors’ addresses:
Ricardo Hideaki Miyajima, PhD *
e-mail: richidetoshimiyajima@hotmail.com
São Paulo State University (Unesp)
Prof. Paulo Torres Fenner, PhD
e-mail: paulo.fenner@unesp.br
School of Agriculture, Botucatu
Avenue Universitária, 3780, Altos do Paraíso
BRAZIL
Prof. Gislaine Cristina Batistela, PhD
e-mail: gislaine.batistela@unesp.br
Prof. Danilo Simões, PhD
e-mail: danilo.simoes@unesp.br
São Paulo State University (Unesp)
Campus of Itapeva
Street Geraldo Alckmin, 519, Vila Nossa Sra. de Fátima
BRAZIL
* Corresponding author
Received: May 29, 2019
Accepted: December 02, 2019
Original scientific paper