
Temporal Patterns of Vehicle Collisions with Roe Deer and Wild Boar in the Dinaric Area
doi: https://doi.org/10.5552/crojfe.2020.789
volume: 41, issue:
pp: 13
- Author(s):
-
- Vrkljan Joso
- Hozjan Dubravka
- Barić Danijela
- Ugarković Damir
- Krapinec Krešimir
- Article category:
- Original scientific paper
- Keywords:
- game species, wild animals, collision dynamics, months, moon phase
Abstract
HTML
The purpose of this study was to determine the frequency of wildlife-vehicle collisions (WVC) based on the animal species, and to deepen the knowledge of temporal patterns of vehicle collisions with roe deer and wild boar. The study analyses the data from police reports on vehicle collisions with animals on state roads, by date and time, section of road, and animal species over a 5-year period (2012–2016). These data were analysed to determine the temporal dynamics of vehicle collisions with roe deer and wild boar by month, time of day, and moon phase. On the state roads in the Dinaric area, roe deer are most commonly involved in vehicle collisions (70.1% of all collisions), followed by wild boar (11.0%). Other large species involved in collisions were fallow deer (4.8%), brown bear (1.8%), red deer (0.9%), grey wolf (0.7%), and European mouflon (0.5%), respectively. Most collisions with roe deer occurred in the period April–August, with reduced frequency during autumn and winter. For wild boar, there was no association between month and frequency of collisions. At the annual level, collisions with roe deer were significantly higher during night (37%) and twilight (41%) than during the day (22%). For wild boar, most collisions occurred during twilight (26%) and night (72%), although the difference between these two periods was not statistically significant. For roe deer, collisions had no association with lunar phase, though wild boar collisions during twilight (dawn or dusk) were more common during twilight periods on days with less moonlight. Since vehicle collisions with wildlife showed certain temporal patterns, these should be taken into consideration in developing statistical models of spatial WVC patterns, and also in planning strategies and countermeasures to mitigate WVC issues.
Temporal Patterns of Vehicle Collisions with Roe Deer and Wild Boar in the Dinaric Area
Joso Vrkljan, Dubravka Hozjan, Danijela Barić, Damir Ugarković, Krešimir Krapinec
Abstract
The purpose of this study was to determine the frequency of wildlife-vehicle collisions (WVC) based on the animal species, and to deepen the knowledge of temporal patterns of vehicle collisions with roe deer and wild boar. The study analyses the data from police reports on vehicle collisions with animals on state roads, by date and time, section of road, and animal species over a 5-year period (2012–2016). These data were analysed to determine the temporal dynamics of vehicle collisions with roe deer and wild boar by month, time of day, and moon phase. On the state roads in the Dinaric area, roe deer are most commonly involved in vehicle collisions (70.1% of all collisions), followed by wild boar (11.0%). Other large species involved in collisions were fallow deer (4.8%), brown bear (1.8%), red deer (0.9%), grey wolf (0.7%), and European mouflon (0.5%), respectively. Most collisions with roe deer occurred in the period April–August, with reduced frequency during autumn and winter. For wild boar, there was no association between month and frequency of collisions. At the annual level, collisions with roe deer were significantly higher during night (37%) and twilight (41%) than during the day (22%). For wild boar, most collisions occurred during twilight (26%) and night (72%), although the difference between these two periods was not statistically significant. For roe deer, collisions had no association with lunar phase, though wild boar collisions during twilight (dawn or dusk) were more common during twilight periods on days with less moonlight. Since vehicle collisions with wildlife showed certain temporal patterns, these should be taken into consideration in developing statistical models of spatial WVC patterns, and also in planning strategies and countermeasures to mitigate WVC issues.
Keywords: game species, wild animals, collision dynamics, months, moon phase
1. Introduction
The expansion of the road network and increasing traffic density, together with increasing vehicle speeds, particularly in developed countries, have led to a major traffic issue – more frequent vehicle collisions with humans (Shad and Rahimi 2017) and wildlife (regardless of the species of vertebrate, Hell et al. 2005, Fahrig and Rytwinski 2009). An analysis of the frequency and outcome of wildlife-vehicle collisions (WVC), conducted in Sweden in the early 2000s, showed that 5% of all collisions with animals result in human injuries, and 10 to 15 cases per year end with human fatalities (Seiler and Folkeson 2006). At pan-European level, there is a strong tendency of WVC increase in the majority of European countries (Langbein et al. 2011).
In general, most experts agree that the increasing number of animal deaths on the transportation network (roads and railway lines) is due to the increasing density of roads, faster vehicle speeds and increasing number of certain animal species (especially even-toed ungulates, e.g. Seiler 2004, Apollonio et al. 2010). Animal mortality on roads accounts for 1–12% of the assessed population size of certain populations, or 10–100% of the set annual culling quotas (Seiler et al. 2004).
In Europe, collisions with larger animals most frequently occur with roe deer (Capreolus capreolus, e.g. Madsen et al. 2002, Pokorny 2006, Langbein et al. 2011, Putzu et al. 2014), followed by wild boar (Sus scrofa, e.g. Šprem et al. 2013, Putzu et al. 2014). Among other large even-toed ungulates in northern Europe, collisions are frequent (though at a much lower incidence) with red deer (Cervus elaphus, Mysterud 2004), and moose (Alces alces, Seiler et al. 2004).
Regardless of factors that reduce or increase the likelihood of collision, research to date has shown that the incidence of collisions shows daily, weekly (Groot Bruiderink and Hazebroek 1996, Dussault et al. 2006) and seasonal oscillations (Madsen et al. 2002, Pokorny 2006, Primi et al. 2009, Langbein et al. 2011, Morelle et al. 2013), caused by changes in animal activity in accordance with their reproductive or feeding cycles. Though some scientists believe that a share of collisions (especially with wild boar) is associated with human hunting activities, there is currently no solid evidence to support this claim (Primi et al. 2009, Díaz-Varela et al. 2011, Lagos et al. 2012, Morelle et al. 2013, Pokorny and Flajšman 2016). The reason for this is the inability to precisely define the reason for the collisions (hunting, resource cycles such as forest seed yields, or reproductive status).
Research to date on the temporal patterns of vehicle collisions with roe deer and wild boar has not considered the duration of day and night, or the influence of the lunar phase. The associations of lunar phase with the likelihood of vehicle collisions on certain cervid species have not been sufficiently examined (Steiner et al. 2014), and currently these data are only known for moose (Gundersen and Andreassen 1998) and white-tailed deer (Odocoileus virginianus) in different regions of North America (Pierce 2010). Therefore, the purpose of this study was to contribute to understanding these patterns in a relatively homogeneous climate and landscape area.
2. Materials and Methods
The study was conducted on state roads in the Dinaric region of Croatia (roads DC1, DC8, DC23, DC25, DC50, DC52, DC217, DC218, DC429, DC522, DC534) passing through Lika-Senj County (Fig. 1). The state roads run through an elevation range from 0 to 1012 m, and climatologically they pass through three areas (Filipčić 1998, Šegota and Filipčić 2003). The moderate warm wet climate with warm summers (Cfb) is found in the north-eastern and eastern part (covering 85.6%) of the study area. In the coastal region, 6.7% of the study area falls within the Mediterranean hot summer climate (Csa). The wet boreal climate (Df) is present in the peak areas of the mountain massifs over 1200 m in elevation, covering 7.7% of the study area. The total length of state roads in the area is 549 km, and the total surface of the study area is 535,113 ha, giving a road density of 1.03 km/1000 ha.
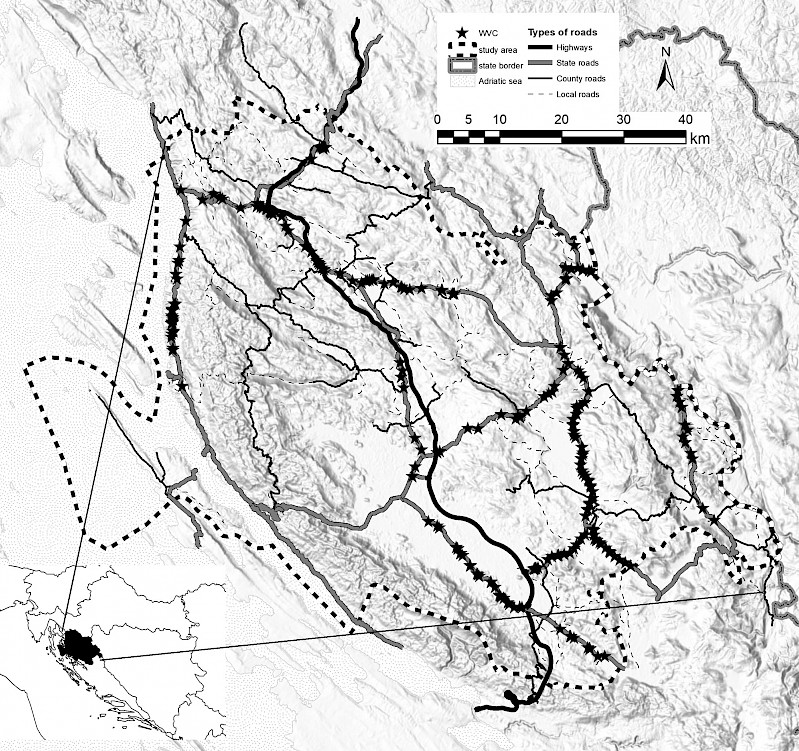
Fig. 1 Study area
According to http://www.bioportal.hr/gis/, the dominant types of land use in this area are forests (65%) and grasslands (21%). Data on vehicle collisions with game species (listing the date and time of collisions and species involved) were taken from police reports on vehicle collisions with wild animals, collected in the period from March 15th, 2012 to December 27th, 2016.
Given the difference in the time of dusk and dawn, the 24-hour day period was divided according to Rockhill et al. (2013): daytime period begins 1 hour after sunrise and ends 1 hour before sunset; night-time period begins 1 hour after sunset and ends 1 hour before sunrise; and twilight as the time period that lasts a total of four hours per day, with dawn as the morning twilight period and dusk as the event twilight period, each lasting 2 hours. Dawn begins 1 hour before sunrise and ends 1 hour after sunrise. Dusk begins 1 hour before sunset and ends 1 hour after sunset. The time of sunrise and sunset was calculated using an online algorithm (http://astrogeo.geoinfo.geof.hr/online_efemeride/sunrise_sunset/) by the Zagreb Observatory for each day of the study period. In the Republic of Croatia (as in most European countries), the basic time is winter time, while summer time (daylight savings) begins on the last Sunday in March, and ends on the last Sunday in October. It is calculated by adding one hour to the winter time, and vice-versa. We addressed a problem associated with the date of switching from winter time to daylight savings time, which is important in the display of data in the figures. For example, in 2012 the date of switching to daylight savings time was 25th March, while the following year it was 31 March, which gives a »shift« of 6 (7) days per year. This error was approximated by taking the median data of switching from winter to summer time between 25th and 31st March, i.e. 27th March.
Data on lunar cycles, i.e. moon phases, during the study period was taken from the American Navy Oceanography website (http://aa.usno.navy.mil/faq/docs/moon_phases.php); for the purpose of this study we used eight moon phases. During the lunar cycle, at night the Moon is not uniformly illuminated. The level of illumination changes in accordance with the following moon phases: the night during phase 1 (new moon) is not illuminated by moonlight, during periods 2 (waxing crescent) and 8 (waning crescent) only one-quarter of the Moon is illuminated, during periods 3 (first quarter) and 7 (last quarter) one-half of the Moon is illuminated, during periods 4 (waxing gibbous) and 6 (waning gibbous) three-quarters of the Moon is illuminated. The Moon fully illuminated only during the full moon (period 5).
This study was conducted over a 5-year period. Therefore, it was necessary to test whether there were any changes in the density of vehicle traffic or numbers of large mammals on the state roads during that period. The data on traffic (average annual daily and average summer daily traffic) were taken from Božić et al. (2013, 2014, 2015, 2016, 2017). Since data on the abundance of wildlife are relatively unreliable, the harvest data in individual hunting grounds were used instead as an indicator of population abundance of the studied species (source: https://sle.mps.hr/Loviste/LovisteIndex), calculated as units per hunting area (relative cull quota RCQ, number of harvested animal/100 ha). The hunting area is obtained by removing all fenced off or water areas from the total hunting ground area.
Testing for the normality of distribution was performed using the Kolmogorov-Smirnov test. Since the sample size was less than 50, the Shapiro-Wilk test was also used. Correlation analysis was performed using the Spearman rank correlation coefficient – Rs (Zar 1998). Since the data did not display normal distribution, they were transformed using the polynomic quadratic function. Testing differences between groups of data was performed using the χ2 test. All statistical analyses were performed using the program package Statistica 13.4.014 (TIBCO Software Inc. 2018).
3. Results
3.1 Frequency of Collisions with Animal Species
During the 5-year period of monitoring wildlife-vehicle collisions on state roads in the study area, a total of 436 collisions were recorded, all with fatal outcomes for the animal. The animals were primarily roe deer (in 70.9% of collisions) and wild boar (11.0%). Red deer was rarely involved (0.9%), while the lowest incidence of all large mammals in collisions was noticed for European mouflon (0.5%). However, in examining the number of collisions per length of state road passing by or through hunting groups where individual species are present (Table 1), roe deer was again the most common species affected, with 12.0 collisions per year per 100 km of roads, followed by fallow deer (Dama dama) with 5.2 collisions per year per 100 km, and wild boar with 1.9 collisions per year per 100 km of state roads, respectively. The likelihood of a vehicle collision with European mouflon was in fact higher than for red deer (0.5 vs. 0.2 collisions per year per 100 km of state roads).
Table 1 Number of vehicle collisions with different animal species during the 5-year period in the study area
|
Species |
WVC, count |
WVC, % |
Mean yearly number of WVC |
3D_road length km |
Mean yearly number of WVC per 100 km of state roads |
|
Roe deer (Capreolus capreolus) |
309 |
70.9 |
61.8 |
516 |
12.0 |
|
Fallow deer (Dama dama) |
21 |
4.8 |
4.2 |
81 |
5.2 |
|
Red deer (Cervus elaphus) |
4 |
0.9 |
0.8 |
516 |
0.2 |
|
European mouflon (Ovis orientalis musimon) |
2 |
0.5 |
0.4 |
81 |
0.5 |
|
Wild boar (Sus scrofa) |
48 |
11.0 |
9.6 |
516 |
1.9 |
|
Brown bear (Ursus arctos) |
8 |
1.8 |
1.6 |
516 |
0.3 |
|
Grey wolf (Canis lupus) |
3 |
0.7 |
0.6 |
541 |
0.1 |
|
Brown hare (Lepus europaeus) |
24 |
5.5 |
4.8 |
541 |
0.9 |
|
Red fox (Vulpes vulpes) |
11 |
2.5 |
2.2 |
505 |
0.4 |
|
European badger (Meles meles) |
2 |
0.5 |
0.4 |
417 |
0.1 |
|
Wild cat (Felis silvestris) |
4 |
0.9 |
0.8 |
540 |
0.1 |
The brown hare was the third most frequent species involved in collisions (5.5%; 0.9 collisions per 100 km of state roads). The most frequent carnivore perished on roads was red fox (5.5%; 0.9 collisions per 100 km of state roads), while brown bear and wolf perished relatively rarely (1.8%; 0.3 collisions per 100 km of state roads; and 1.7%; 0.1 collisions per 100 km of state roads, respectively). Carnivores least likely to perish on roads were European badger (0.5%; 0.1 collisions per 100 km of state roads), and wild cat (0.9%; 0.1 collisions per 100 km of state roads).
Populations of the majority of studied large mammals did not increase significantly during the study period, and statistical analysis showed that for most species there was no statistically significant increase in collision rates on state roads (Table 2). The exception was roe deer, which exhibited a statistically significant increase in the number of collisions during this period (Rs=0.90, p<0.05). Due to a relatively small number of cases of collisions with European mouflon and grey wolf, the correlation was not calculated for these species.
Table 2 Trends in abundance and trends in collisions with wildlife during the 5-year period in the study area (numbers in bold indicate statistically significant result, p<0.05)
|
Game species |
Correlation coefficient, Rs |
|
|
Abundance trends |
Collision trends |
|
|
Red deer |
–0.20 |
–0.58 |
|
Fallow deer |
0.30 |
0.40 |
|
Roe deer |
0.00 |
0.90 |
|
Wild boar |
–0.30 |
0.67 |
|
Brown bear |
–0.10 |
–0.67 |
|
Total |
–0.30 |
0.80 |
During the study period, there were no increases in the average daily or average summer daily traffic density at 27 out of 28 measurement sites. Only one site experienced a statistically significant increase in the average summer daily traffic density (Rs=0.9, p<0.05). However, during the 5-year study period, only one collision with roe deer occurred on that section of state road, and therefore this result should not have any impact on the accuracy of further analyses.
3.2 Temporal Patterns of Vehicle Collisions with Roe Deer and Wild Boar
The monthly dynamics of vehicle collisions with roe deer and wild boar indicate a certain sinusoid pattern (Fig. 2). For roe deer, this dependence was significant but very weak (R2=0.123, p<0.01), monthly accounting for only 12.3% of the variability of collisions. For wild boar, the dependence was not significant, i.e. there were no pronounced monthly culminations of collisions. According to the data, the increase of vehicle collisions with roe deer was visible from April to the end of August, with a peak in April and May.
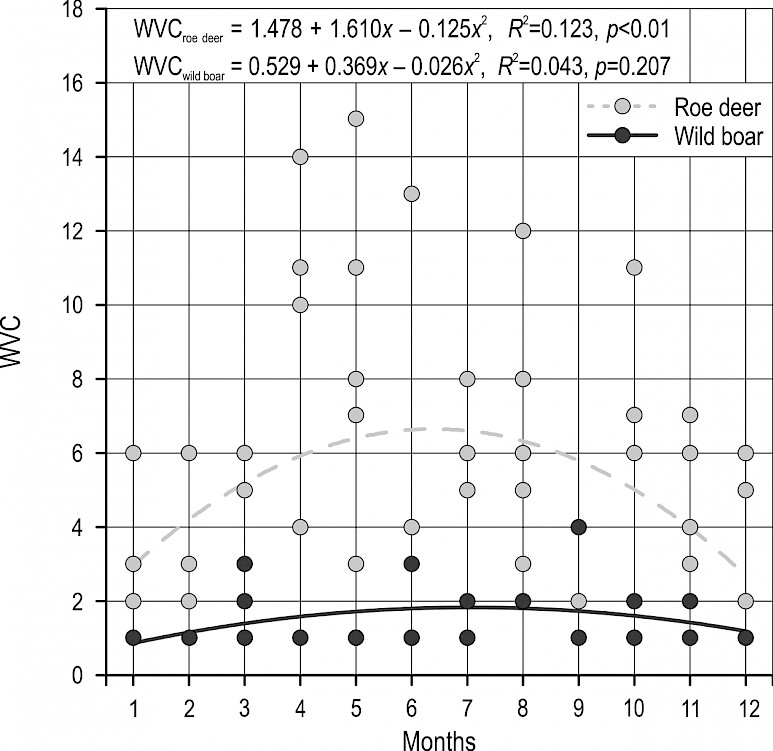
Fig. 2 Monthly dynamics of vehicle collisions with roe deer and wild boar on state roads in Lika-Senj County in the period 2012–2016. Single dots represent number of collisions per month in every year
At the annual level, collisions with roe deer were significantly less frequent during the day (22%) than during the night (37%) or twilight (41%) (F=11.3819, p<0.001). Night-time collisions with roe deer occurred throughout the year. During certain periods of the year, collisions also occurred during daytime hours. This was also the period of the highest intensity of collisions (April to August, Fig. 3). However, the frequency of collisions with regard to the quantity of daylight, or period of day, changed through the year. In January, collisions were most frequent at night, followed by twilight (Fig. 4). However, already during March, this changed rapidly, as collisions with roe deer became more frequent during dawn and dusk. This was already observed in February, although it was less pronounced. It was previously stated that collisions become markedly more frequent in early April, though at this time it can be observed that the frequency of collisions with roe deer by day and by night begins to even out. During May, night and twilight collisions became dominant again, although during June and July day collisions were more frequent. In August, there was a certain uniformity of the collision frequency during all periods (day, night, twilight), while in September, night collisions were again the most frequent (though the difference from twilight collisions is virtually negligible). After this, until the end of the year, twilight collisions were again most common, followed by night collisions. Generally, daytime collisions can occur year-round (the only exception being September when not a single collision was recorded during daylight hours), though day collisions were more frequent than night and twilight collisions during June and July.
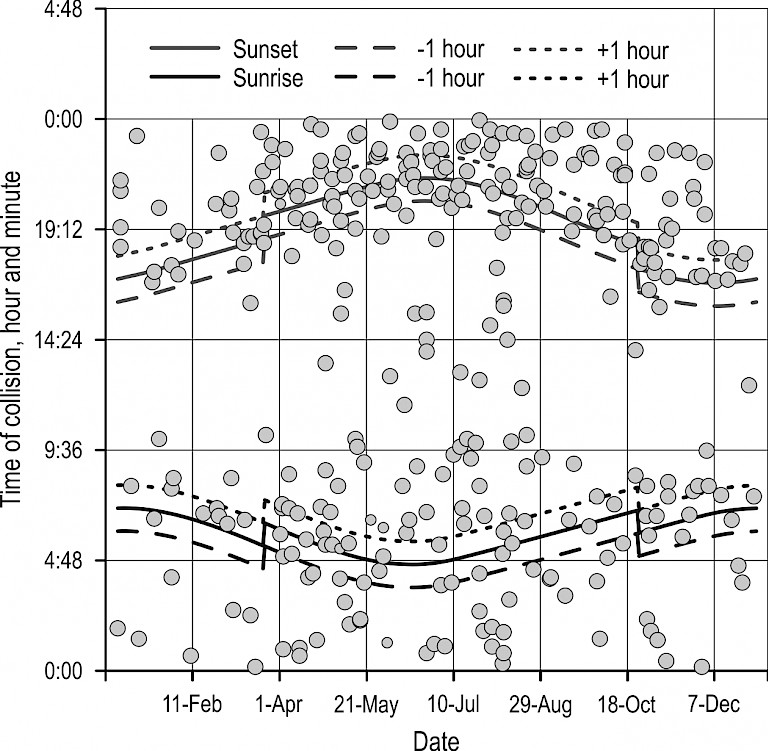
Fig. 3 Daily fluctuations of vehicle collisions with roe deer
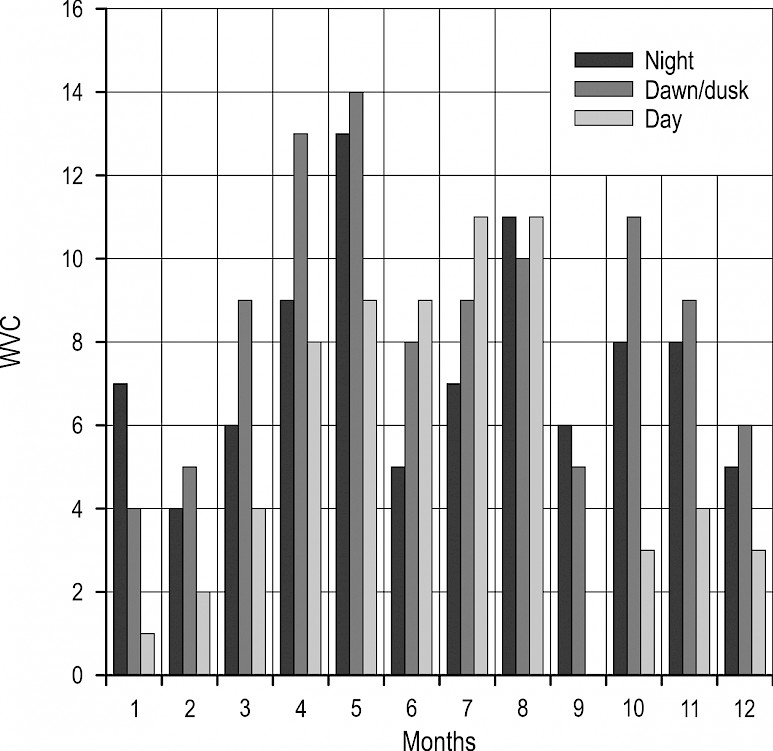
Fig. 4 Annual fluctuations in frequency of vehicle collisions with roe deer based on period of day
Unlike roe deer, wild boar showed a tendency of perishing on roads almost exclusively during twilight and night hours. Though the share of collisions at night was 72%, and during twilight 26%, there was no statistically significant difference in the number of collisions between those two periods (χ2=20.403, p=0.07), nor in between the frequency of collisions during twilight and day (χ2=20.403, p=0.14). However, wild boar perished more frequently during the night (26% of collisions) than during the day (2% of collisions), (χ2=20.403, p<0.0001). The time of collisions with wild boar during the night was relatively constant (Fig. 5), while during the twilight period collisions were more common at dusk than at dawn. Furthermore, the time of collisions with wild boar at dusk was almost immediately before the transition into night. Only one collision with this species was recorded during the day time in this period, one in the morning in early June. In generally, at the annual level, night collisions were dominant in all months. Twilight collisions appeared in March and October, and remained less than half the level of night collisions (Fig. 6).
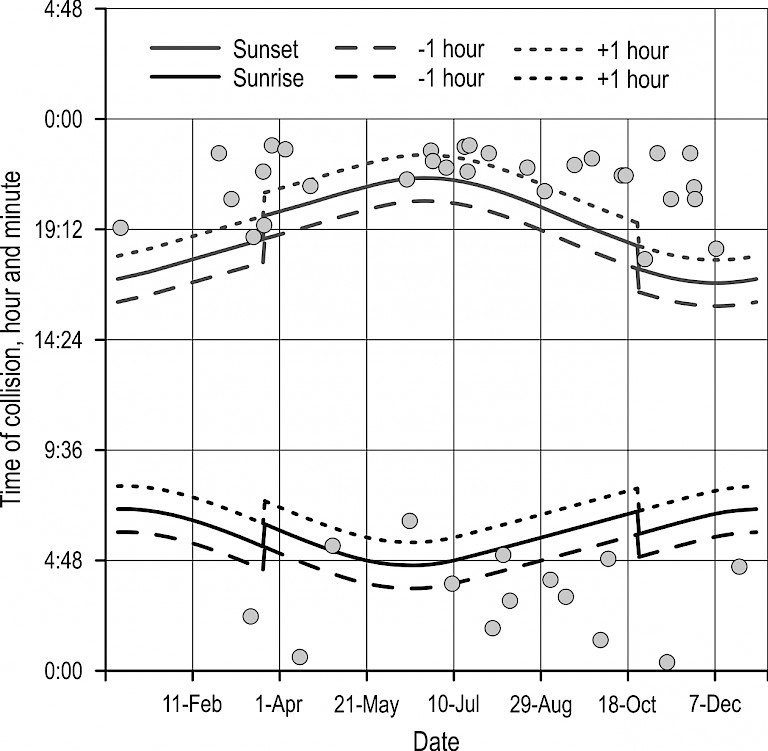
Fig. 5 Daily fluctuations of vehicle collisions with wild boar
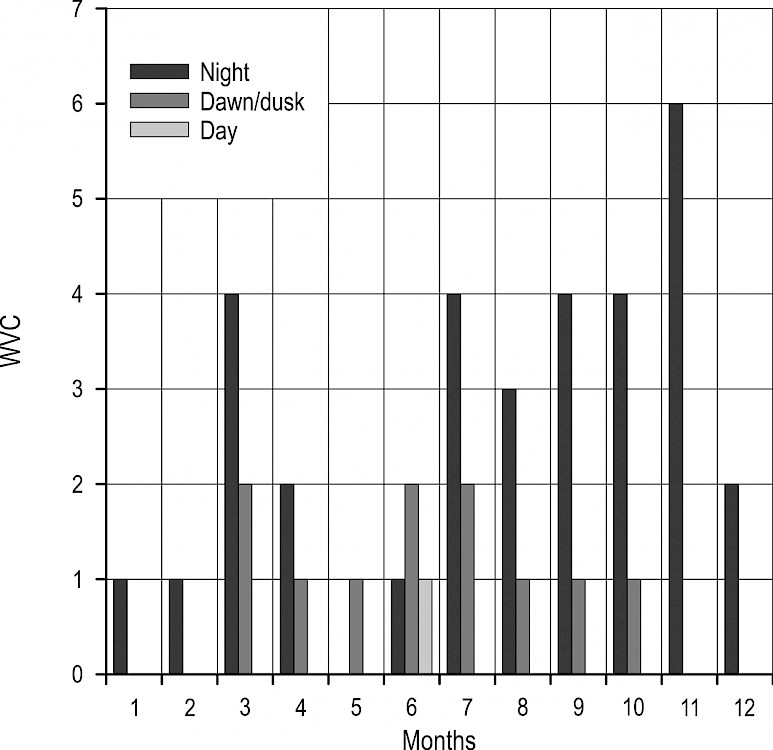
Fig. 6 Fluctuations in frequency of collisions with wild boar by period of day, and by month
Since moon phases can cause changes in animal behaviour during night and twilight (Prebanić and Ugarković 2015), a regression analysis was performed on the dynamics of collisions during those periods (night and twilight). During the night (Fig. 7), roe deer showed a tendency of increased collisions with increasing illumination (lunar phases 3 and 4), while during the new moon, the frequency of collisions suddenly decreased. For wild boar, there was a certain negative relationship with moon phase. It would appear that this species avoids nocturnal activities during the full moon, and even during phases with increased illumination of the Moon (phases 4 and 6). The regression analysis showed that there was no significant association between lunar phases and the intensity of collisions during the night (roe deer: R2=0.04, p=0.39; wild boar: R2=0.38, p=0.12).
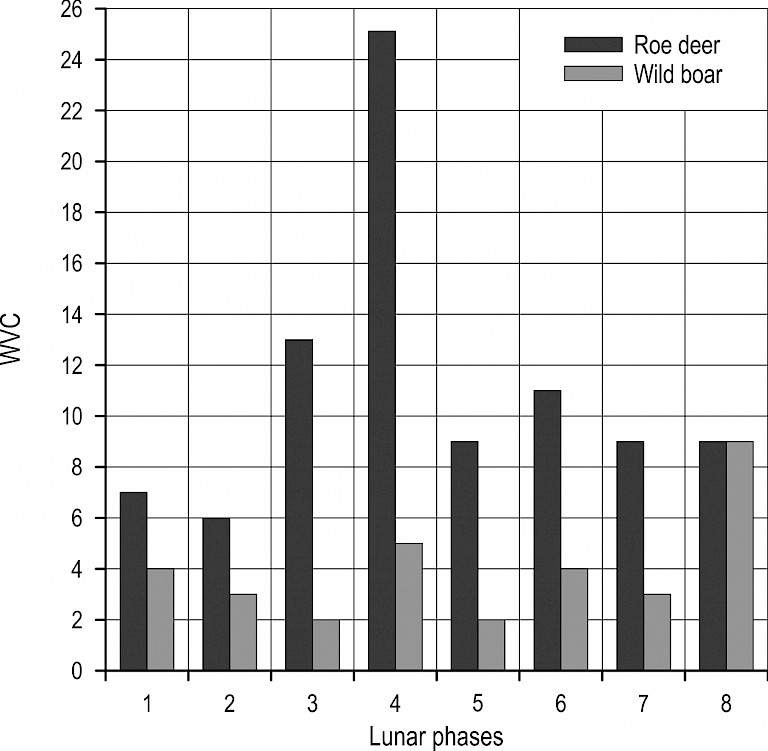
Fig. 7 Distribution of collisions with roe deer and wild boar during the night by lunar phases
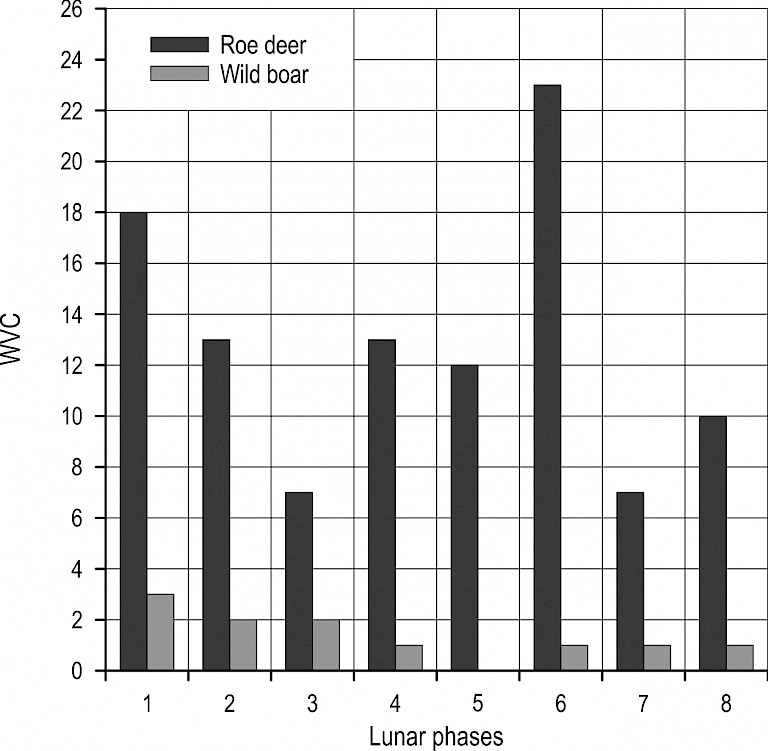
Fig. 8 Distribution of collisions with roe deer and wild boar during twilight by lunar phases
During twilight, trends were less regular (Fig. 8). For roe deer, a decrease in collisions could be observed from phases 1 to 3, followed by an increase to phase 6, and then a sudden drop, while again increasing from phase 7 to phase 1, however this relationship was not statistically significant (R2=–0.34, p=0.89). However, the incidence of collisions with wild boar during twilight showed a statistically significant association with lunar phases (R2=0.76, p<0.05). For this species, collisions were most common during the twilight periods when the Moon was least illuminated (phases 6 to 1), while no collisions were recorded during the full moon.
4. Discussion
According to Langbein et al. (2011), in spite of missing data from some European countries, a decade ago full toll of ungulates killed annually on European roads was assessed close to 1 million, and trends were very similar to the North American WVC evidence. WVC have two negative impacts on human community: (i) human injury and death, and (ii) damage to property, mostly cars. In our study, we did not register any case of human fatality.
Contrary to European mouflon and fallow deer, which are found exclusively in the Mediterranean region of the study area, all other species recorded in collisions inhabit the entire study area. Besides large mammalian species, which were registered to be road-killed there, in the area at higher elevations there are also northern chamois with two subspecies, i.e. Alpine chamois (Rupicapra rupicapra rupicapra) and Balkan chamois (R. r. balcanica) and their hybrids (Šprem and Buzan 2016), though no collisions were recorded with this species. Regardless of the size of the area, and the length of road on which collisions with wildlife are possible, roe deer was found to be the most common victim. This is in line with studies conducted throughout Europe, where depending on the region, this species is in the total number of road-killed large mammals (wild ungulates alone or ungulates + large carnivores) in the range from 64.7% (northern Italy, Putzu et al. 2014), 60–73% (Germany, Madsen et al. 2002), 75% (Croatia, Šprem et al. 2013), 88% (Denmark, Andersen and Madsen 2007) or even up to 96% (Slovenia, Pokorny 2006). However, even within one country, there can be pronounced differences in frequency of collisions with a given animal species; for example, in central Croatia, the share of collisions with roe deer in all collisions with large mammals was 85% (Pintur et al. 2009), while in this study it was 70%. Therefore, causes need to be sought in other facts (changes in habitat structure, lack of maintenance of roadside areas, increasing road network, etc.) and further study should be carried out.
Depending on the research, the proportion of registered wild boar mortality cases ranges from 9% (Šprem et al. 2013) to 29.5% (Putzu et al. 2014). However, given the size of the area it inhabits, and its abundance at the European level, this frequency is not high. According to Šprem et al. (2013), the frequency of collisions with red deer and fallow deer was only 2% of all cases. This was also similar in Slovenia (Pokorny 2006), where fallow deer was only the fifth most common species involved in collisions (after roe deer, red deer, wild boar and even chamois). However, in both countries, fallow deer inhabits only a small area, and when taking the size of its distribution range into the effect, fallow deer is the second most affected species after roe deer, as also confirmed in this study (roe deer vs. fallow deer – 12.0 vs. 5.1 collisions per year per 100 km of state roads in the relevant areas of species distributions). The cause for this phenomenon could be in the behaviour of fallow deer as it is a daily active species with relatively long-distance daily movements (Ueckermann and Hansen 2002), and hence with higher possibility to cross roads in the period of higher traffic density (daily activity coinciding with higher traffic density might be problematic). However again, the sample size is so small that it is very difficult to make any relevant comparisons and conclusions. Though European hares in this study were also reported at an incidence of 0.9 individuals per year per 100 km of state roads, which is in accordance with the research of Slater (2002), the actual number of individuals that perish on roads is definitely much higher. Indeed, due to a small body size, collisions with this species do not result in significant material damage, and the driver often takes the carcass without reporting the incident.
The strength of the correlation between the number of collisions and season varies from study to study, both within and between species. The annual (seasonal) dynamics of collisions with roe deer is uniform in most cases, and shows one or two peaks (Langbein et al. 2011). Though Madsen et al. (2002) stated that the number of vehicle collisions with roe deer is highest during autumn, they did not find a significant correlation between the dynamics and traffic density. Unlike this study, where there was a statistically significant correlation between season and frequency of collisions, Vincent et al. (1988) did not find a significant correlation, though they reported two peaks: in summer (June–July) and autumn (September–October). Similar critical periods of collisions with roe deer were also noted by Morelle et al. (2013), though they found spring (April–May) and autumn (September–November) peaks. In the present study, the peak was also found in the period April–May. The difference in these peaks could also be associated with sex, as males are most often involved in collisions during May, August and September, while females are the most affected in other months. Females are more often involved in collisions than males (63.4 vs. 36.6%, this study), particularly adult females (55.7% of all cases, Madsen et al. 2002). The spring peak of collisions is associated with increased searching for food after the winter, expansions into new areas (dispersal of yearlings, particularly males) and territorial behaviour of the species, while the autumn peak is associated with seeking for more favourable habitats during winter (Stubbe 2008). The mating period is a time of increased activity and movement of ungulates (Prebanić and Ugarković 2015), and the time of year with frequent vehicle collisions with wildlife. In addition to roe deer and red deer, which have strong rut-related peaks in the yearly distribution of collisions (Pokorny 2006), a peak of collisions related with mating activities has also been recorded among deer of the genus Odocoileus in North America (Ng et al. 2008), where the majority of collisions occur during November.
Although, in this study, the intensity of collisions with wild boar was not related to season (which is presumably due to a relatively small sample set), according to Primi et al. (2009), collisions with wild boar are more frequent during the period November–January, and August–October, or according to Lagos et al. (2012) from October to January (also reported by Rodríguez-Morales et al. 2013, Morelle et al. 2013, Pokorny and Flajšman 2016). Since within the population, individual females may show signs of oestrus during any month (e.g. Briedermann 2009), it is difficult to differentiate the causes in the annual fluctuation of collisions in this species. Lagos et al. (2012) tried to associate the likelihood of collisions with the hunting activities of humans. In their study, they found a somewhat higher frequency of collisions with roe deer and wild boar during hunting season (in Galicia, these two species are hunted on Thursdays and Sundays from September to January), though this could also be associated with other causes (e.g. yields of mast forest seeds, structure of agricultural crops, length of night), or with the autumn dispersion of young individuals or migrations in the winter feeding period (areas with little to no snow). In this context, Pokorny and Flajšman (2016) revealed huge increase of road-mortality of wild boar in Slovenia in October–November, i.e. when the period of intensive drive hunts starts, but they indicated that this is not directly connected to hunting (as they did not register any day-related peaks within weeks connected with hunting over weekends), but could be rather the influence of intensive disturbances in forests due to autumnal picking of forest fruits (mushrooms, chestnut). In Croatia, the hunting season for wild boar is open year-round, however there are significant differences in hunting dynamics between the Pannonian (lowland) and Dinaric (highland) areas (Vujnović 2016, Tomorad 2017, Milas 2018). Namely, during autumn and winter, this game species is primarily hunted in drive hunts in the lowlands, i.e. Pannonian region (hunting grounds with more than 50% forest), while in the Dinaric region hunting is most commonly performed by single hunters. Drive hunts typically include hounds and a large number of hunters, which leads to scattering of animals, contributing to increasing spatial dynamics, i.e. daily migrations or even dispersion (Maillard and Fournier 1995), though this may not always be pronounced (Keuling et al. 2008). Therefore, the lack of a peak of collisions with wild boar during the main drive hunting season (late autumn/early winter) in this study can also be a consequence of a small frequency of drive hunts in the study area. Generally speaking, there were no significant associations between months and the frequency of collisions with wild boar, while the statistically significant association of season and collisions with roe deer supports the claim that the patterns of roe deer collisions are defined by mating season.
Collisions with ungulates are not distributed randomly in space in time. Considering cervids, to which a large majority of studies in Europe were related (reviewed in Langbein et al. 2011), the most dominant factors affecting the accident rate are: (i) season and time of day; (ii) road type, traffic volume and speed; (iii) other environmental and landscape factors. Collisions usually occur during twilight or night. Morelle et al. (2013) stated that reduced visibility might be a cause, but also the fact that nocturnal activities are increased for certain wildlife species due to a more intensive search for food during that time (Groot Bruiderink and Hazebroek 1996, Dussault et al. 2006). Furthermore, traffic intensity is also higher as people go to or return from work. The daily dynamics of collisions with roe deer showed a bimodal distribution, with peaks at dawn and dusk (Pokorny 2006). Mysterud (2004) made a similar observation for red deer, while collisions for wild boar were more common during dusk, and lesser during the day and night (Primi et al. 2009). However, most studies have not taken into consideration the annual changes in sunrise and sunset times nor have they considered the time of collision by time of year (e.g. months), and all data were pooled at the annual level. From the studies that considered the daily dynamics of collisions with roe deer and wild boar with respect to the annual shifts in sunrise and sunset times (Díaz-Varela et al. 2011, Rodríguez-Morales et al. 2013), it is clear that collisions are associated with dawn and dusk (quantity of light), which was also confirmed in our study. Therefore, we confirmed that wild boar primarily perishes at night, while roe deer road-mortality dynamics is more associated with the time of year. During autumn and spring, collisions with roe deer occur primarily during dawn and dusk, and less during the night, while collisions during the day are only seen in the period June–August.
During the mating period, deer show increased activity during the lunar phases with greater illumination of the Moon. In addition to red deer (Prebanić and Ugarković 2015), a similar correlation was found for white-tailed deer and moose, as both species experienced increased vehicle collisions during nights with a full moon (Gundersen and Andreassen 1998, Pierce 2010). It was also found that the incidence of collisions was higher for white-tailed deer during the full moon if females were gravid or leading offspring. This pattern coincides with the results of this study for collisions with roe deer. However, for wild boar, the pattern is opposite, as the fewest collisions occurred during the full moon, and no collisions were recorded at all in twilight hours during the full moon. Our results might suggest that this species moves less during periods of greater illumination, when the likelihood of collision with a vehicle is reduced. However, if animal activity is associated with the quantity of light during night and twilight, then processing errors, such as increased variability, can be caused by nights with an overcast sky, which led to greater darkness than during clear nights. Further detailed analyses of these data should include cloud cover as a factor. However, since such analyses involve a relatively large area, this error would be difficult to remove.
A comparison of the results of this study with the literature showed that roe deer temporal patterns of collisions are fairly consistent throughout Europe, although there are certain regional differences. For wild boar, temporal patterns of collisions are still not sufficiently clear. The impacts of hunting as a possible cause for increased movement still remain a speculation. The relatively small number of registered vehicle collisions with this species does not enable deeper insight into the patterns of collisions, in the sense of separating variability due to age, time of day, or moon phase. Though greater or smaller changes in collision patterns can partly be due to differences in population densities among the studied species, part of the pattern is likely due to differences in road lines such as embankments and curves (Malo et al. 2004), different relief which again influences vehicle speed (Hartwig 1993, Seiler 2005, Ng et al. 2008), and the installation of other elements of road protection that prevent or restrict wild animals from accessing roads (Gunson et al. 2011). Though some studies have concluded that traffic intensity is not a deciding factor (Seiler 2005, Díaz-Varela et al. 2011), it should not be fully excluded. Although there are numerous studies on the spatial patterns of vehicle collisions with wildlife, few have considered the temporal aspect (Plug et al. 2011, Neumann et al. 2012, Rodríguez-Morales et al. 2013), which could more clearly define the sources of variability and increase the likelihood of assessing collision patterns. As such, analyses of spatial patterns of collisions should also take into consideration the season, time of day, and moon phases.
5. References
Apollonio, M., Andersen, R., Putman, R., 2010: European Ungulates and their Management in the 21st century. Cambridge University Press, Cambridge, 618 p.
Božić, M., Kopić, D., Mihoci, F., 2013: Traffic counts on the Croatian road network in the Year of 2012 (in Croatian). Prometis d.o.o., Zagreb, 442 p.
Božić, M., Kopić, D., Mihoci, F., 2014: Traffic counts on the Croatian road network in the Year of 2013 (in Croatian). Prometis d.o.o., Zagreb, 460 p.
Božić, M., Kopić, D., Mihoci, F., 2015: Traffic counts on the Croatian road network in the Year of 2014 (in Croatian). Prometis d.o.o., Zagreb, 557 p.
Božić, M., Kopić, D., Mihoci, F., 2016: Traffic counts on the Croatian road network in the Year of 2015 (in Croatian). Prometis d.o.o., Zagreb, 656 p.
Božić, M., Kopić, D., Mihoci, F., Marold, N., Gršetić, J., 2017: Traffic counts on the Croatian road network in the Year of 2016 (in Crotian). Prometis d.o.o., Zagreb, 764 p.
Briedermann, L., 2009: Schwarzwild – Neuausgabe bearbeitet von Burkhard Stöcker. Franckh-Kosmos Verlags-GmbH & Co. KG, Stuttgart, 596 p.
Díaz-Varela, E.R., Vazquez-Gonzalez, I., Marey-Pérez, M.F., Álvarez-López, C.J., 2011: Assessing methods of mitigating wildlife-vehicle collisions by accident characterization and spatial analysis. Transportation Research part D: Transport and Environment 16(4): 281–287. https://doi.org/10.1016/j.trd.2011.01.002
Dussault, C., Poulin, M., Courtois, R., Ouellet, J., 2006: Temporal and spatial distribution of moose-vehicle accidents in the Laurentides Wildlife Reserve, Quebec, Canada. Wild Biology 12(4): 415–425. https://doi.org/10.2981/0909-6396(2006)12[415:TASDOM]2.0.CO;2
Fahrig, L., Rytwinski, T., 2009: Effects of roads on animal abundance: an empirical review and synthesis. Ecology and Society 14(1): 21.
Fernández-Llario, P., 2004: Environmental correlates of nest site selection by wild boar Sus scrofa. Acta Theriologica 49(3): 383–392. https://doi.org/10.1007/BF03192536
Filipčić, A., 1998: Climatic regionalisation of Croatia according to W. Köppen for the standard period 1961–1990 in relation to the period 1931–1960 (in Croatian with English summary). Acta Geographica Croatica 33(1): 7–14.
Groot-Bruinderink, G.W., Hazebroek, E., 1996: Ungulate traffic collisions in Europe. Conservation Biology 10(4): 1059–1067. https://doi.org/10.1046/j.1523-1739.1996.10041059.x
Gundersen, H., Andreassen, H.P., 1998: The risk of moose Alces alces collision A predictive logistic model for moose-train accidents. Wildlife Biology 4(2): 103-110. https://doi.org/10.2981/wlb.1998.007
Gunson, K.E., Mountrakis, G., Quackenbush, L.J., 2011: Spatial wildlife-vehicle collision models: A rewiev of current work and its application to transportation mitigation projects. Journal of Environmental Management 92(4): 1074–1082. https://doi.org/10.1016/j.jenvman.2010.11.027
Hartwig, D., 1993: Auswertung der durch Wild verursachten Verkehrsunfälle nach der Statistik für Nordrhein-Westfallen. Z. Jagdwiss. 39(1): 22–33. https://doi.org/10.1007/BF02310214
Hell, P., Plavý, R., Slamečka, J., Gašparik, J., 2005: Losses of mammals (Mammalia) and Birds (Aves) on roads in the Slovak part of the Danube Basin. European Journal of Wildlife Research 51(1): 35–40. https://doi.org/10.1007/s10344-004-0068-6.
Keuling, O., Stier, N., Roth, M., 2008: How does hunting influence activity and space use in wild boar Sus scrofa. European Journal of Wildlife Research 54(4):729–737. https://doi.org/10.1007/s10344-008-0204-9
Lagos, L., Picos, J., Valero, E., 2012: Temporal pattern of wild ungulate-related traffic accidents in northwest Spain. European Journal of Wildlife Research 58(4): 661–668. https://doi.org/10.1007/s10344-012-0614-6
Langbein, J., Putman, R., Pokorny, B., 2011: Traffic collision involving deer and other ungulates in Europe and available measures for mitigation. In: Ungulate management in Europe: problems and practices, ed. Putman, R., Apollonio, M., Andersen, R., Cambridge University press, Cambridge, 215–259 p.
Madsen, A.B., Strandgaard, H., Prang, A., 2002: Facors causing traffic killings of roe deer Capreolus capreolus in Denmark. Wildlife Biology 8(1): 55–61. https://doi.org/10.2981/wlb.2002.008
Maillard, D., Fournier, P., 1995: Effect of shooting with hounds on home range size of wild boar (Sus scrofa L.) groups in Mediterranean habitat. Ibex Journal of Mountain Ecology 3: 102–107.
Malo, J., Suárez, F., Díez, A., 2004: Can we mitigate animal-vehicle accidents using predictive models? Journal of Applied Ecology 41(4): 701–710. https://doi.org/10.1111/j.0021-8901.2004.00929.x
Milas, T., 2018: Trophy quality of wild boar tusks in west and south part of Croatia during eight hunting years. (In Croatian). University in Zagreb, Faculty of Forestry, Master thesis, 43 p.
Morelle, K., Lehaire, F., Lejeune, P., 2013: Spatio-temporal patterns of wildlife-vehicle collisions in a region with a high-density road network. Nature Conservation 5: 53–73. https://doi.org/10.3897/natureconservation.5.4634
Mysterud, A., 2004: Temporal variation in the number of car-killed red deer Cervus elaphus in Norway. Wildlife Biology 10(3): 203–211. https://doi.org/10.2981/wlb.2004.026
Naval Oceanography Portal: Available online http://aa.usno.navy.mil/faq/docs/moon_phases.php (accessed 2nd of July 2019)
Natura 2000 – Bioportal. http://www.bioportal.hr/gis/. (accessed 6th of May 2019)
Neumannn, W., Ericsson, G., Dettki, H., Bunnefeld, N., Keuler, N., Helmers, D.P., Radeloff, V.C., 2012: Difference in spatiotemporal patterns of wildlife road-crossings and wildlife-vehicle collisions. Biological Conservation 145(1): 71–78. https://doi.org/10.1016/j.biocon.2011.10.011
Ng, J.W., Nielsen, C., St. Clair, C.C., 2008: Landscape and traffic factors influencing deer-vehicle collisions in an urban enviroment. Human-Wildlife Conflits 2(1): 34–47.
Pierce, A.M., 2010: Spatial and temporal relationships between deer harvest and deer-vehicle collisions at Oak Ridge Reservation, Tennessee. Master's Thesis, University of Tennessee, Knoxwille, 89 p.
Pintur, K., Duduković, D., Popović, N., Florijančić, T., Krapinec, K., Slavica, A., Šprem, N., 2009: Preliminary research of wildlife-vehicle collisions dynamic in Karlovac, Croatia (in Croatian with English summary). Proceeding of the 44th Croatian and 4th International Symposium on Agriculture, Opatija, Croatia, 16–20 February, Marić, S., Lončarić, Z., Faculty of Agriculture University of Josip Juraj Strossmayer in Osijek: Opatija, Croatia, 706–710.
Plug, C., Xia, J., Caulfield, C., 2011: Spatial and temporal visualization techniques for crash analysis. Accident Analysis and Prevention 43(6): 1937–1946. https://doi.org/10.1016/j.aap.2011.05.007
Pokorny, B., 2006: Roe deer-vehocle collisions in Slovenia: situation, mitigation strategy and countermeasures. Veterinarski Arhiv 76(Suppl.): 177–187.
Pokorny, B., Flajšman, K., 2016: Značilnosti povoza parkljaste divjadi v Sloveniji: divji prašič. Lovec 10: 470–476.
Prebanić, I., Ugarković, D., 2015: Analysis of seasonal activities of red deer (Cervus elaphus L.) in relation to the mating season, lunar phases and air temperature. Russian Journal of Ecology 46(4): 393–395. https://doi.org/10.1134/S1067413615040153
Primi, R., Pelorosso, R., Ripa, M.N., Amici, A., 2009: A statistical GIS-based analysis of Wild boar (Sus scrofa) traffic collisions in a Mediterranean area. Italian Journal of Animal Science 8(Suppl.2): 649–651. https://doi.org/10.4081/ijas.2009.s2.649
Rockhill, A.P., DePerno, C.S., Powell, R.A., 2013: The effect of illumination and time of day on movements of Bobcats (Lynx rufus). PLoS ONE 8(7): e69213. https://doi.org/10.1371/journal.pone.0069213
Rodríguez-Morales, B., Díaz-Varela, E.R., Marey-Pérez, M.F., 2013: Spatiotemporal analysis of vehicle collisions involving wild boar and roe deer in NW Spain. Accident Analysis & Prevention 60: 121–133. https://doi.org/10.1016/j.aap.2013.07.032
Seiler, A., 2005: Predicting locations of moose-vehicle collisions in Sweden. Journal of Applied Ecology 42(2): 371–382. https://doi.org/10.1111/j.1365-2664.2005.01013.x
Seiler, A., Folkeson, L., 2006: COST 341 – The Swedish State-of-the-art concerning Habitat fragmentation due to transport infrastructure. Office for Official Publications of the European Communities, Luxembourg, 153 p.
Shad, R., Rahimi, S., 2017: Identification of road crash black-sites using geographical information system. International Journal for Traffic and Transport Engineering 7(3): 368–380. http://dx.doi.org/10.7708/ijtte.2017.7(3).07
Slater, F.M., 2002: An assessment of wildlife road casualties – the potential discrepancy between numbers counted and numbers killed. Web Ecology 3(1): 33–42. https://doi.org/10.5194/we-3-33-2002
Steiner, W., Leisch, F., Hackländer, K., 2014: A rewiev on the temporal pattern of dee-vehicle accidents: Impact of seasonal, diurnal and lunar effects in cervids. Accident Analysis & Prevention 66: 168–181. https://doi.org/10.1016/j.aap.2014.01.020
Stubbe, C., 2008: Rehwild – Biologie, Ökologie, Bewirtschaftung. 5., neubearbeitete Auflage. Franckh-Kosmos Verlags-GmbH, 398 p.
Sunrises and sunsets – online ephemeris – application to calculate the moments for Sunrise and Sunset and the associated azimuth to any location on the Earth’s surface. http://astrogeo.geoinfo.geof.hr/online_efemeride/sunrise_sunset/ (accessed 25th of June 2019)
Šegota, T., Filipčić, A., 2003: Köppen's Classification of Climates and the Problem of Corresponding Croatian Terminology (in Croatian with English summary). Geoadria 8(1): 17–37. https://doi.org/10.15291/geoadria.93
Šprem, N., Buzan., E., 2016: The genetic impact of chamois management in the Dinarides. Journal of Wildlife Management 80(5): 783–723. https://doi.org/10.1002/jwmg.21081
Šprem, N., Duduković, D., Keros, T., Konjević, D., 2013: Wildlife-vehicle collisions in Croatia – A hazard for humans and animals. Collegium Antropologicum 37(2): 531–535.
Tomorad, V., 2017: Trophy quality of wild boar tusks in northern part of Croatia during eight hunting years. (In Croatian). University in Zagreb, Faculty of Forestry, Master thesis, 32 p.
Ueckermann, E., Hansen, P., 2002: Das Damwild – Biologie, Hege und Jagd. 4. Auflage, Franckh-Kosmos Verlags-GmgH and Co., Stuttgart, 327 p.
Vincent, J., Bideau, E., Cibien, C., Quéré, J., 1988: Verkehrsopfer beim Rehwild (Capreolus capreolus). – Z. Jagdwiss 34(1): 63–68. https://doi.org/10.1007/BF02241282
Vujnović, Z., 2016: Trophy quality of wild boar tusks in eastern part of Croatia during last eight hunting years. (In Croatian). University in Zagreb, Faculty of Forestry, Master thesis, 46 p.
Zar, J.H., 1999: Biostatistical Analysis. 4th edition. Prentice Hall, New Jersey, 123 p.
© 2019 by the authors. Submitted for possible open access publication under the
terms and conditions of the Creative Commons Attribution (CC BY) license (http://creativecommons.org/licenses/by/4.0/).
Authors’ addresses:
Joso Vrkljan, MSc
e-mail: joso.vrkljan@likaceste.hr
Lika ceste Ltd.
Smiljanska 41
53000 Gospić
CROATIA
Assoc. Prof. Dubravka Hozjan, PhD
e-mail: dubravka.hozjan@fpz.unizg.hr
Assoc. Prof. Danijela Barić, PhD
e-mail: danijela.baric@fpz.unizg.hr
University of Zagreb
Faculty of Transport and Traffic Sciences
Department of Road Transport - Chair of Road Transport Technology
Borongajska 83a
10000 Zagreb
CROATIA
Assoc. Prof. Damir Ugarković, PhD
e-mail: dugarkovic@sumfak.hr
University of Zagreb
Faculty of Forestry
Institute of Ecology and Silviculture
Svetošimunska 25
10000 Zagreb
CROATIA
Prof. Krešimir Krapinec, PhD *
e-mail: kkrapinec@sumfak.hr
University of Zagreb
Faculty of Forestry
Institute of Forest Protection and Wildlife Management
Svetošimunska 25
10000 Zagreb
CROATIA
* Corresponding author
Received: December 8, 2019
Accepted: March 26, 2020
Original scientific paper