
Effectiveness of Erosion Control Structures in Reducing Soil Loss on Skid Trails
doi: 10.5552/crojfe.2021.742
volume: 42, issue:
pp: 15
- Author(s):
-
- Solgi Ahmad
- Naghdi Ramin
- Zenner Eric K.
- Farshad Keivan Behjou
- Vatani Leila
- Article category:
- Original scientific paper
- Keywords:
- best management practices, ground-based skidding, runoff, sediment yield, water bar
Abstract
HTML
Forest operations can lead to increased runoff and soil loss on roads and skid trails. Best management practices (BMPs) aim to minimize erosion and water quality problems, but the efficacies of various BMP options such as water bars are not well documented. The aim of this study was to evaluate the effects of different densities of water diversion structures (water bars) on runoff volume and soil loss on different skid trail gradients on two soils with different textures in the Shenrood forest, Guilan province, northern Iran. The treatments included combinations of four densities of water bars (1, 2, 3 or 6 water bars per 150 m length of skid trail section [overland trail]), on two levels of trail gradient (≤20% and >20%) and two soil textures (clay loam and silt loam). Average runoff volume and soil loss per m2 of skid trail surface area were significantly greater (P≤0.05) on silt loam than on clay loam textured soils, and on slope gradients >20% (23–28%) than on gradients ≤20% (5–13%). Average runoff volume increased, and average soil loss decreased significantly (P≤0.05) with increasing density of water bars on both gradients and on both soil textures. On both soil textures, the lowest surface runoff volumes were observed with one water bar and the greatest volumes with six water bars installed. In contrast, the smallest amount of soil loss on both soil textures was observed with six water bars, and the greatest soil loss when only one water bar was installed. The installation of additional water bars led to significant differences in both responses at each level of density and led to reductions in soil loss of 77%, 57% and 27% in the clay loam, and 79%, 60% and 30% in the silt loam soil compared to the single water bar treatment. The reduced soil loss per unit of surface runoff volume is likely due to the reduced velocity of surface water runoff in the skid trail. The greater density of water bars appears to effectively divert more but slower flowing water from the skid trail, leading to reduced soil loss. While additional water bars thus better meet the objective of BMPs to minimize soil loss, managers need to balance the cost of the construction of additional water bars against the ecological benefits of reduced soil loss. An investment into additional water bars may be worthwhile if the additional structures are able to divert surface runoff more effectively to nearby vegetation and reduce the input of soil from skid trails to streams, thereby preventing the loss of water quality of these streams.
Effectiveness of Erosion Control Structures in Reducing Soil Loss on Skid Trails
Ahmad Solgi, Ramin Naghdi, Eric K. Zenner, Farshad Keivan Behjou, Leila Vatani
Abstract
Forest operations can lead to increased runoff and soil loss on roads and skid trails. Best management practices (BMPs) aim to minimize erosion and water quality problems, but the efficacies of various BMP options such as water bars are not well documented. The aim of this study was to evaluate the effects of different densities of water diversion structures (water bars) on runoff volume and soil loss on different skid trail gradients on two soils with different textures in the Shenrood forest, Guilan province, northern Iran. The treatments included combinations of four densities of water bars (1, 2, 3 or 6 water bars per 150 m length of skid trail section [overland trail]), on two levels of trail gradient (≤20% and >20%) and two soil textures (clay loam and silt loam). Average runoff volume and soil loss per m2 of skid trail surface area were significantly greater (P≤0.05) on silt loam than on clay loam textured soils, and on slope gradients >20% (23–28%) than on gradients ≤20% (5–13%). Average runoff volume increased, and average soil loss decreased significantly (P≤0.05) with increasing density of water bars on both gradients and on both soil textures. On both soil textures, the lowest surface runoff volumes were observed with one water bar and the greatest volumes with six water bars installed. In contrast, the smallest amount of soil loss on both soil textures was observed with six water bars, and the greatest soil loss when only one water bar was installed. The installation of additional water bars led to significant differences in both responses at each level of density and led to reductions in soil loss of 77%, 57% and 27% in the clay loam, and 79%, 60% and 30% in the silt loam soil compared to the single water bar treatment. The reduced soil loss per unit of surface runoff volume is likely due to the reduced velocity of surface water runoff in the skid trail. The greater density of water bars appears to effectively divert more but slower flowing water from the skid trail, leading to reduced soil loss. While additional water bars thus better meet the objective of BMPs to minimize soil loss, managers need to balance the cost of the construction of additional water bars against the ecological benefits of reduced soil loss. An investment into additional water bars may be worthwhile if the additional structures are able to divert surface runoff more effectively to nearby vegetation and reduce the input of soil from skid trails to streams, thereby preventing the loss of water quality of these streams.
Keywords: best management practices, ground-based skidding, runoff, sediment yield, water bar
1. Introduction
The potential degradation of forest soils is a major problem in ground-based skidding in mountainous forests. Field traffic with heavy machinery is the main cause of top and subsoil compaction that can change the physical and chemical properties of the soil, soil fauna, and plant diversity (Naghdi et al. 2016, Farrakh Nawaz et al. 2013) and result in extensive damage that can persist for many years (McColl 1995). Soil compaction refers to the compression of pores, which leads to decreased porosity and pore continuity, increased bulk density and soil strength, decreased gas exchange rates between soil and atmosphere and lower water infiltration, which in turn leads to increased runoff (Solgi et al. 2014, Solgi et al. 2019). Skid trails can produce significant increases in surface runoff and sediment yield, especially when bare soils are exposed to high traffic frequency or when soil bearing capacity is exceeded and rutting occurs (Swift and Burns 1999, McBroom et al. 2008, Solgi et al. 2014).
Two major subcategories of skid trails are distinguished that differ in their potentials for soil loss: overland skid trails and bladed skid trails. Overland skid trails are temporary pathways that do not require pre-skidding construction but are created by repeated equipment passes (Halleux and Greene 2003). Bladed skid trails often entail bulldozer construction of an outsloped cut and fill road on a sidehill road template (Aust et al. 2015), which exposes considerable mineral soil to potential erosion. Overland skid trails generally cause less soil disturbance and potential erosion than bladed skid trails (Sawyers et al. 2012, Wade et al. 2012). Both types of skid trails expose bare soil (Liu et al. 2014, Cerdà 2007), whose lack of protective surface cover can generate significant amounts of soil loss during the rainy season (Arnáez et al. 2004, Jordán-López et al. 2009, Bochet et al. 2009). Once severely degraded, poor soil conditions make natural restoration of ground cover vegetation on skid trails difficult (Bochet and García-Fayos 2004).
The severity of adverse impacts of skid trails is further related to the traffic frequency (Akay et al. 2008, Solgi et al. 2014), slope gradient of the trail (Akbarimehr and Naghdi 2012 a,b), residual vegetation cover (Lee et al. 2013, Solgi et al. 2019), mechanical pressure (Battiato et al. 2013), rainfall intensity (Martínez-Zavala et al. 2008), soil texture (Croke et al. 2001, Naghdi et al. 2020), and the time since construction of the skid trail (Fu et al. 2010). Although erosion is affected by many factors, the soil type/texture, the gradient of the slope, and the presence/absence of ground vegetation seem to play pivotal roles in determining soil erodibility potential (Morgan 1986). Soil texture determines the susceptibility of a soil to erosion in that erosion rates can differ among various soil types under the same conditions of rainfall intensities, slope gradients and amounts of vegetation cover (Hussein et al. 2007, Mohamadi and Kavian 2015, Solgi et al. 2019). The slope gradient affects soil loss (Solgi et al. 2014) through its effects on surface runoff velocity that can increase with increasing slope gradients and lead to excessive soil loss (Koulouri and Giourga 2007, Kateb et al. 2013). Indeed, sediment yields per unit surface area of skid trails strongly depend on the gradient of the trail (Masumian et al. 2017), whereas even the largest storm events do not generate any runoff and sediment on flat control plots (Solgi et al. 2014).
To minimize soil loss, most forestry Best Management Practices (BMPs) were developed with a focus on erosion associated with transportation networks, including roads, landings, skid trails, and stream crossings (Aust and Blinn 2004, Anderson and Lockaby 2011). Typical BMPs for roads, skid trails, and landings include proper planning and location, control of gradient, use of buffer strips, control of water, surfacing, and road or trail closure recommendations to facilitate revegetation following harvesting and minimize continued post-harvest soil disturbance (Swift 1985, Aust and Blinn 2004, Shepard 2006, Akbarimehr and Naghdi 2012a).
Soil erosion control techniques focus on controlling major factors that contribute to soil erosion and primarily emphasize measures that reduce the severity and extent of soil erosion to reduce nutrient export from the site and suspended sediment in streams (Aust and Blinn 2004). Installing water diversion structures such as water bars to reduce runoff generation and sediment yields is a very effective sediment control strategy for limiting sediment delivery to adjacent areas (Wallbrink and Croke 2002). Water bars can be installed where other BMPs are less effective for controlling soil erosion and sediment discharge due to soil condition, steep slopes or long slope lengths. To be most effective for minimizing soil erosion, water bar installation should be complemented by the utilization of logging residues (brush) that accrues during the processing phase or the application of mulch. Alternatively, increasing water-bar density and surface roughness on machine operating trails utilizing litter, brush or woody debris may be considered to minimize the amount of sediment deposited into nearby streams (Litschert and MacDonald 2009). Further, the spacing interval of water bars should be reduced in areas with large amounts of rainfall and on steep slopes (Virginia Dept. For., 2011). The height of water bars should sufficient so that water flow will not overtop them, which would lessen their effectiveness. Finally, water bars should also be constructed at a 30 to 40 degree angle to the centerline of the road and tied to the upslope bank to ensure that water diverted off the road will retain sufficient velocity to reach the outlet (Wade 2010).
Although water bars seem to be a particularly beneficial instrument for erosion control on retired skid trails in mountainous forests with steep slopes and steep road gradients (Akbarimehr and Naghdi 2012 a,b), there is no consensus on the efficacy of water bars or the distance between (or density of) required water bars along the skid trail that minimizes runoff and soil loss. The general aim of this study was to determine the efficacy of water bars to minimize runoff and soil loss on skid trails.
Specific study objectives were to:
Þ quantify the amount of surface runoff and soil loss generated on skid trails where water bars were installed at different distances (different frequencies) along the skid trails
Þ examine whether the efficacy of different distances between, or densities of, water bars differ between soils of different textures (i.e., clay loam and silt loam) on two slope gradient classes
Þ determine potential interactions among frequencies of water bars, soil textures, and slope gradient.
2.1 Site Description
This research was conducted on two sites in the Shenrood forest, Guilan province, northern Iran (36°13' N and 36°15' N and 53°10' E and 53°15' E) between October 2018 and March 2019. The area is composed of deciduous trees and dominated by oriental beech (Fagus orientalis Lipsky) and common hornbeam (Carpinus betulus (L.)), along with caucasian alder (Alnus subcordata (C.A.M)) and chestnut-leaved oak (Quercus castaneifolia (C.A. Mey)) as companion species. Canopy cover was 83% (Site 1) and 81% (Site 2). The area is characterized by brown forest soils formed on unconsolidated limestone that have a moderately deep profile and are classified as Eutric Cambisols (FAO/UNESCO 1990) and Typic Eutrudepts (USDA Soil Taxonomy 1998). Soil textures in the studied skid trails were determined based on particle size analysis using the Bouyoucos hydrometer method (Kalra and Maynard 1991) and were determined as clay loam (Site 1) and silt loam (Site 2) based on the USDA Soil Taxonomy classification (USDA 1999) (Table 1). The average depth of the soils to bedrock was 70 cm (Site 1) and 60 cm (Site 2). The elevations of the two study sites were approximately 800–1000 m above sea level with a northerly aspect. The average annual rainfall recorded at the closest national weather station, located 20 km from the research area is 1240 mm, with a maximum mean monthly rainfall of 150 mm in October and a minimum rainfall of 25 mm in August. Historic weather data of the previous 50 years show a mean annual temperature of 16 °C, with lowest temperatures in February. At the time of skidding, weather conditions were dry and warm, with average gravimetric soil moisture contents of 19% (Site 1) and 21% (Site 2). To our knowledge and based on a pre-harvest survey, the site did not show any signs of previous timber harvesting or that the soil had been driven on before the experiment.
Table 1 Soil particle size distribution with corresponding soil textures for both research sites at a depth of 1–10 cm (The range of particle size was <0.002, 0.002–0.05 and 0.05–2 mm for clay, silt, and sand, respectively.)
|
Soil particle size distributions, g/100 g |
||||
|
Sample site |
Sand |
Silt |
Clay |
Soil texture |
|
Site 1 |
27 |
34 |
39 |
Clay loam |
|
Site 2 |
32 |
56 |
12 |
Silt loam |
2.2 Forest Operations and Machine Specifications
At each of the two study sites, a combination of group selection and single-tree selection silvicultural harvests were applied. In Hyrcanian forests, harvesting and silviculture operations are most commonly executed in the autumn and winter, while skidding of logs is usually completed in the spring and summer. Harvesting operations consisted of hand felling and processing of trees, followed by transportation of the logs from the forest stand to the roadside by a rubber tired Timberjack 450C cable skidder (no chains or tracks were installed on the skidder during skidding) (Fig. 1, Table 2). Hand felling using chainsaws and axes is the most common harvesting technique in Iran, especially in thinning operations. The rubber-tired cable skidder is typically used to extract 3 to 4 m-long logs on drivable terrain of up to a gradient of 30 percent. In the study, the skidder was always driven loaded to maximum capacity.
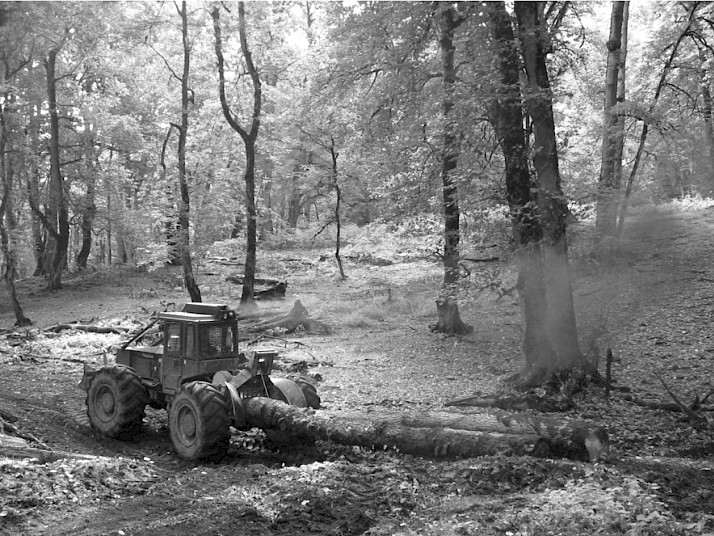
Fig. 1 Rubber tired skidder (Timberjack 450 C) used in this study
Table 2 Main technical characteristics of Timberjack 450C skidder
|
Specifications |
Timberjack 450C |
|
Weight, kg |
10,257 |
|
Number of wheels |
4 |
|
Tire size, mm |
775 × 813 |
|
Ground pressure, kPa |
221 |
|
Engine power, hp |
177 |
|
Year of manufacture |
1998 |
|
Manufacturing location |
Canada |
2.3 Experimental Design and Data Collection
This study evaluated the amount of surface runoff and soil loss using four densities of water diversion structures (i.e., water bars per 150 m length of a skid trail segment) on two soil textures/sites to determine the efficacy of the water bars in reducing soil loss on skid trails immediately after skidding was completed in the late summer of 2018. At each site, an overland skid trail was selected without any lateral gradient and with a range of longitudinal gradient. The absence of a lateral gradient was ensured by placing six transects perpendicular to the skid trail in potential plot areas and measuring the lateral gradient of each transect. With regard to the longitudinal profile and maximum gradient of the skid trail, two trail gradient classes were considered. The gradient class ≤20% included trail sections that ranged in gradient from 5–13%, and sections of gradient class >20% ranged from 23–28%. Traffic frequencies of the loaded skidder for both sites were between 30–35 passes.
On both sites, four plots of 150 m length were selected (P1, P2, P3, and P6) in different skid trail segments (gradient classes). In P1, a ditch (water bar) (Fig. 2) was constructed on the lower side of the plot so that all surface water runoff from inside the area could be collected in a tank with a capacity of 250 l. In P2, two water bars were constructed at a distance of 75 m on the middle and lower side of the plot (i.e., the trail was divided into two sections with a length of 75 m each). In P3, three water bars were constructed at a distance of 50 m (i.e., the trail was divided into three sections with a length of 50 m each) and in P6 six water bars were constructed at a distance of 25 m (i.e., the trail was divided into six sections with a length of 25 m each) (Fig. 3). A total of 48 runoff plots were installed that included 16 combinations of four densities (N) of water bars, two levels of trail gradient (G), and two soil textures (T)(4(N)×2(G)×2(T)×3 replicates). Each runoff plot was 4 m wide, with a minimum buffer zone of 10 m between plots. Runoff plots were surrounded by wooden boards that were 30 cm tall and inserted 10 cm deep into the soil to control surface water movement from the inside to the outside of the plot area and vice versa.
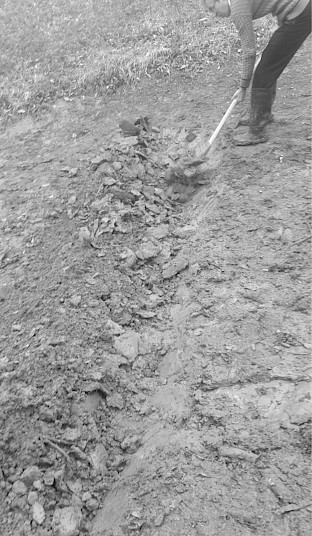
Fig. 2 Construction of a water bar
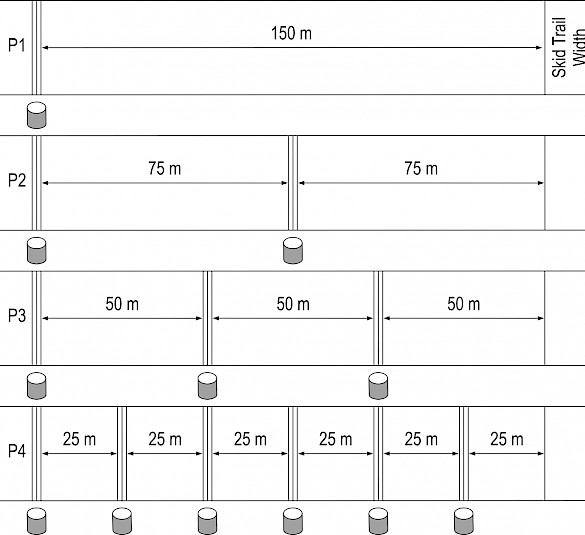
Fig. 3 Layout of sample areas
A collection trough made of a metal sheet and covered with plastic or sheet metal to prevent direct entry of rainfall was positioned at the downslope end of each water bar. Volume of surface runoff was quantified by measuring the height of the water in the collecting tanks. Following Sadeghi et al. (2007), the sediment concentration of each plot was determined in the laboratory by taking a 1 litre subsample from the collected runoff after thorough mixing to bring the sediments into suspension, which was then filtered, oven-dried at 105 °C for a day and weighed. For each of eight rainfall events, runoff volume and sediment loss from each plot were computed. Tanks were emptied and cleaned after each rainfall and sampling event. Dry bulk density was also measured at each runoff plot.
To make surface runoff values comparable among different densities of water bars that collect runoff from different surface areas, surface runoff (l/m2) and soil loss (g/m2) were standardized to one unit of surface area (m2) by summing runoff or soil loss values for the 2 (P2), 3 (P3), and 6 (P6) water bars and dividing the sum by the plot surface area (600 m2) following equation (Eq.1):
(1)
Where:
RP1, RP2, RP3, and RP6 are surface runoff in P1, P2, P3 and P6, respectively, Rw1, Rw2, Rw3, Rw4, Rw5 and Rw6 are surface runoff in water bar 1, 2, 3, 4, 5 and 6, respectively, and 600 m2 is the plot surface area.
Soil loss (g/m2) was calculated as equation (Eq. 2):
(2)
Where:
SLP1, SLP2, SLP3, and SLP6 are soil loss in P1, P2, P3 and P6, respectively, and SLw1, SLw2, SLw3, SLw4, SLw5 and SLw6 are soil loss in water bar 1, 2, 3, 4, 5 and 6, respectively, and 600 m2 is the plot surface area.
In each plot, twelve sample lines were delineated perpendicular to the trail for the measurement of the soil physical properties. Soil samples were collected at the left wheel track (LWT) and the right wheel track (RWT) and then averaged. Soil samples that weighed on average 337 g were collected with a 196.25 cm3 (diameter 5 cm, length 10 cm) cylinder outside and immediately to the left of each plot. Soil samples were oven-dried at 105 °C (24 h) and the water content in the soil samples was measured gravimetrically after oven drying (Kalra and Maynard 1991).
Dry soil bulk density (Db, g/cm3) was computed as equation (Eq. 3):
(3)
Where:
Wd is the weight of dry soil, g
VC is the volume of soil cores, 196.25 cm3.
2.3 Statistical Analysis
One-way and three-way ANOVAs were used to assess the significance of the observed differences in average Db, surface runoff, and soil loss in the different treatment combinations of water bar densities, skid trail slopes, and soil textures and to assess the significance of interactions of these main effects. Tukey’s HSD test was used to determine the significance of differences in average Db, surface runoff, and soil loss for the different treatment combinations (Zar 1999). Least-squares multiple regression analysis was used to relate surface runoff volume and soil loss to soil texture, slope gradient, distance between water bars, and their interactions. Least-squares multiple regression was also used to model soil loss as a function of surface runoff volume, soil texture, slope gradient, and their interactions. All statistical calculations were performed in SPSS version 11.5.
3. Results
Soil properties (Db) did not differ significantly among plots located on different soil textures or among plots within the same texture that were assigned to different treatment combinations (Table 3).
Table 3 Physical soil characteristics in experimental plots by number of water bars (one water bar [P1], 2 water bars [P2], 3 water bars [P3], and 6 water bars [P4]), slope gradient (≤20% and >20%))
|
Sample site |
Parameter |
Slope, < 20% |
Slope, > 20% |
||||||
|
Water bar treatments |
Water bar treatments |
||||||||
|
P1 |
P2 |
P3 |
P4 |
P1 |
P2 |
P3 |
P4 |
||
|
Site 1 Clay loam |
Db, g/cm3 |
1.47 a |
1.49 a |
1.51 a |
1.50 a |
1.51 a |
1.50 a |
1.55 a |
1.52 a |
|
Sand, % |
29 a |
25 a |
27 a |
28 a |
30 a |
28 a |
28 a |
25 a |
|
|
Silt, % |
33 a |
36 a |
35 a |
35 a |
34 a |
35 a |
33 a |
37 a |
|
|
Clay, % |
38 a |
39 a |
38 a |
37 a |
36 a |
37 a |
39 a |
38 a |
|
|
Site 2 Silt loam |
Db, g/cm3 |
1.59 a |
1.61 a |
1.63 a |
1.61 a |
1.64 a |
1.66 a |
1.63 a |
1.67 a |
|
Sand, % |
31 a |
31 a |
33 a |
32 a |
32 a |
33 a |
34 a |
32 a |
|
|
Silt, % |
57 a |
55 a |
56 a |
56 a |
55 a |
56 a |
54 a |
55 a |
|
|
Clay, % |
12 a |
14 a |
11 a |
12 a |
13 a |
11 a |
12 a |
13 a |
|
|
Different superscript letters across a row indicate a statistical difference among treatments at alpha = 0.05. |
|||||||||
Following skidding operations, average surface runoff volume (range: 0.29–8.03 l/m2) was significantly affected by the main effects, the interactions of soil texture × water bar density, soil texture × slope gradient, the three-way interaction of soil texture × slope gradient × water bar density. Similarly, average soil loss (range: 0.9–25.9 g/m2) was significantly affected by the main effects, the interactions of soil texture × water bar density, soil texture × slope gradient, and slope gradient × water bar density (Table 4).
Table 4 P values based on analysis of variance of effects of soil texture, skid trail gradient, and number of water bars on runoff volume (l/m2) and soil loss (g/m2)
|
Source of variable |
d.f. |
P-values |
|
|
Runoff |
Soil loss |
||
|
Soil texture |
1 |
≤ 0.05 |
≤ 0.05 |
|
Gradient |
1 |
≤ 0.05 |
≤ 0.05 |
|
Number of water bars |
3 |
≤ 0.05 |
≤ 0.05 |
|
Soil texture × Gradient |
1 |
≤ 0.05 |
≤ 0.05 |
|
Soil texture × Number of water bars |
3 |
≤ 0.05 |
≤ 0.05 |
|
Gradient × Number of water bar |
3 |
0.274 |
≤ 0.05 |
|
Soil texture × Gradient × Number of water bars |
3 |
≤ 0.05 |
0.183 |
|
P-values less than 0.05 are given in bold |
|||
For each combination of slope gradient and density of water bars, both average surface runoff volume (Table 5) and average soil loss (Table 6) per square meter of skid trail area were consistently greater on silt loam than on clay loam. Averaged across both slope gradients and all water bar densities, surface runoff was significantly greater on silt loam (2.9 mm/m2) than on clay loam (1.8 mm/m2) and soil loss was significantly greater on silt loam (22.5 g/m2) than on clay loam (12.6 g/m2). Similarly, for each combination of soil texture and density of water bars, average surface runoff volume (Table 5) and average soil loss (Table 6) per square meter of skid trail area increased significantly with increasing slope gradient.
Table 5 Means (±std) of runoff volume (l/m2) on different soil textures, trail gradients, and number of water bars (trail length = 150 m)
|
Gradient, % |
Soil Texture |
|||||||
|
Clay loam |
Silt loam |
|||||||
|
Number of water bars |
Number of water bars |
|||||||
|
1 |
2 |
3 |
6 |
1 |
2 |
3 |
6 |
|
|
< 20% |
0.29Db ± 0.035 |
0.64Cb ± 0.047 |
1.16Bb ± 0.13 |
2.47Ab ± 0.31 |
0.57Db ± 0.043 |
1.36Cb ± 0.15 |
1.78Bb ± 0.22 |
3.85Ab ± 0.46 |
|
> 20% |
0.63Da ± 0.058 |
1.58Ca ± 0.18 |
2.39Ba ± 0.27 |
5.27Aa ± 0.64 |
0.95Da ± 0.11 |
2.32Ca ± 0.26 |
4.51Ba ± 0.39 |
8.03Aa ± 0.94 |
|
Note: Different letters within each treatment show significant differences (P≤0.05). Capital case letters refer to the comparisons among the four number of water bar classes at different trail gradients for each soil texture (row). Lower case letters refer to the comparison among the two trail gradient categories in each number of water bar class and soil texture class separately |
||||||||
Table 6 Means (±std) of soil loss (g/m2) on different soil textures, trail gradients, and number of water bars (trail length = 150 m)
|
Gradient, % |
Soil Texture |
|||||||
|
Clay loam |
Silt loam |
|||||||
|
Number of water bars |
Number of water bars |
|||||||
|
1 |
2 |
3 |
6 |
1 |
2 |
3 |
6 |
|
|
< 20% |
9.5Ab ± 0.86 |
6.7Bb ± 0.58 |
4.5Cb ± 0.49 |
2.9Db ± 0.19 |
23.2Ab ± 2.64 |
14.9Bb ± 1.59 |
7.7Cb ± 0.69 |
4.8Db ± 0.51 |
|
> 20% |
32.6Aa ± 2.53 |
24.1Ba ± 2.15 |
13.8Ca ± 1.42 |
6.7Da ± 0.73 |
54.7Aa ± 4.67 |
39.4Ba ± 4.21 |
23.5Ca ± 0.2.57 |
11.6Da ± 1.34 |
|
Note: Different letters within each treatment show significant differences (P≤0.05). Capital case letters refer to the comparisons among the four number of water bar classes at different trail gradients for each soil texture (row). Lower case letters refer to the comparison among the two trail gradient categories in each number of water bar class and soil texture class separately (column) |
||||||||
For each combination of slope gradient and soil texture, however, increasing water bar density (i.e., decreasing distances between water bars), resulted in diverging developments of surface runoff volume and soil loss per square meter of skid trail area. For both slope gradients and soil textures, average surface runoff volume was significantly lower at a density of one water bar than at higher densities, which was also true when comparing the other densities to each other. Compared to the density of one water bar per 150 m skid trail length, two, three, and six water bars increased average surface runoff volume over both gradients by factors of 2.36, 3.90 and 8.44 on clay loam and 2.41, 3.94 and 7.60 on silt loam soil, respectively (Fig. 4). Thus, the greatest surface runoff volume per square meter of skid trail area occurred with six water bars per 150 m of skid trail length. For each combination of slope gradient × soil texture, surface runoff volume (ln-transformed) exhibited a steeply declining curvilinear relationship with distance between water bars (all P≤0.001; R2=0.99; Fig. 5).
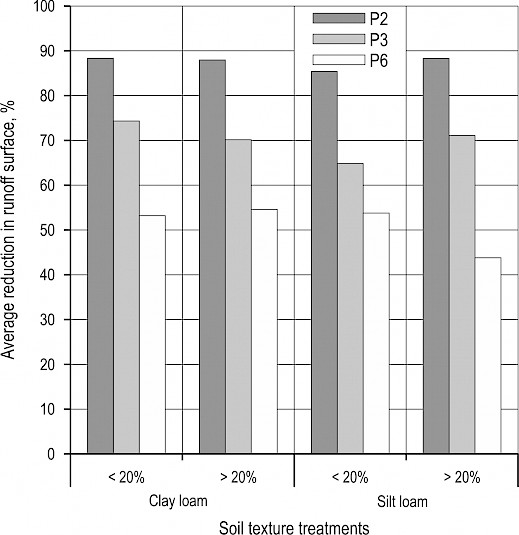
Fig. 4 Average reduction in surface runoff volume (%) compared to the control treatment (P1: trail with a water bar), P2: trail with two water bars; P3: trail with three water bars; P4: trail with six water bars
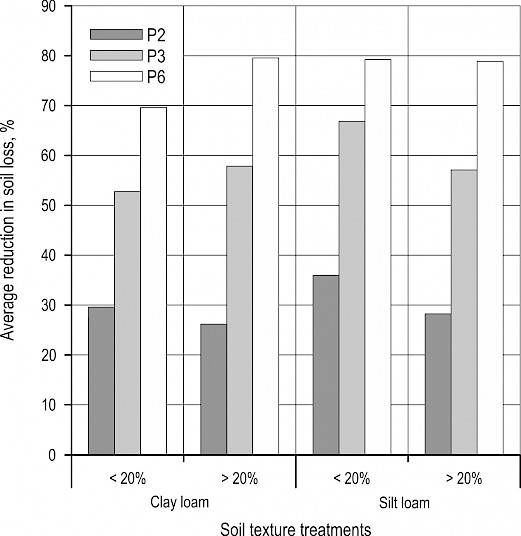
Fig. 5 Average reduction in soil loss (%) compared to control treatment (P1: trail with a water bar), P2: trail with two water bars; P3: trail with three water bars; P4: trail with six water bars
For both slope gradients and soil textures, average soil loss per square meter of skid trail area was significantly greater at a density of one water bar than at higher densities, which was also true when comparing the other densities to each other. Compared to the density of one water bar per 150 m skid trail length, two, three, and six water bars reduced average soil loss by 28%, 55% and 74% on clay loam and 32%, 62% and 79% on silt loam soil, respectively (Fig. 6). Thus, the greatest amount of soil loss occurred with one water bar per 150 m of skid trail length. For each combination of slope gradient × soil texture, soil loss exhibited a significant increasing curvilinear relationship with distance between water bars (all P≤0.001; R2=0.98; Fig. 7).
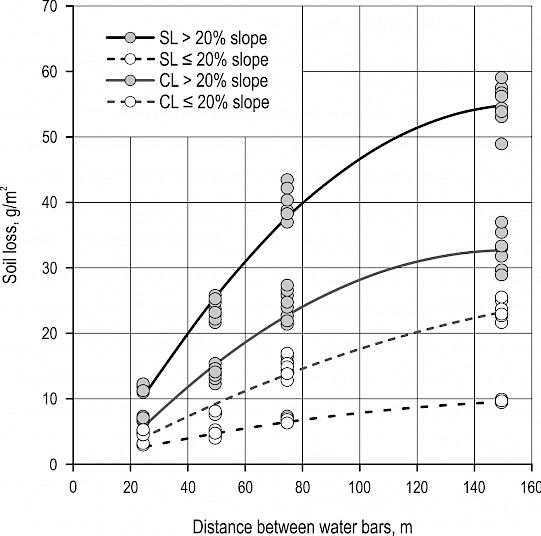
Fig. 6 Relationship between soil loss and distance between water bars for clay loam (CL) and silt loam (SL) based on multiple linear regression analysis (Regression functions differ by soil texture and slope gradient (R2=0.985): CL≤20% gradient: y=0.357+0.103*distance–0.0003*distance2; CL>20% gradient: y=–5.536+0.504*distance–0.0017*distance2; SL≤20% gradient: y=–1.669+0.247*distance–0.0005*distance2; SL>20% gradient: y=–7.685+0.797*distance–0.0025*distance2)
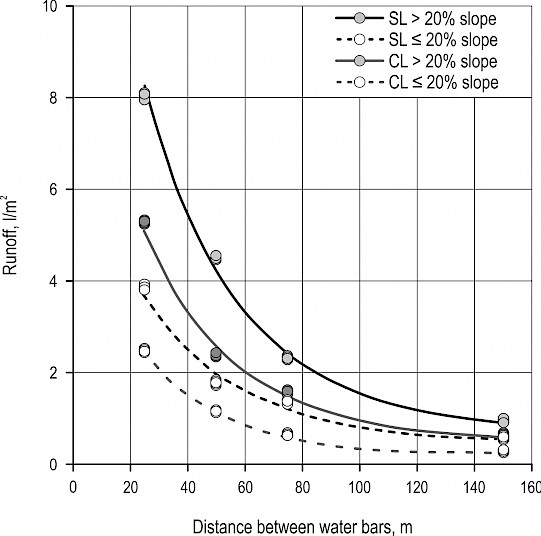
Fig. 7 Relationship between surface runoff volume and distance between water bars for clay loam (CL) and silt loam (SL) based on multiple linear regression analysis (Regression functions differ by soil texture and slope gradient (R2=0.990): CL≤20% gradient: y=exp(1.83–0.040*distance+0.0001*distance2); CL>20% gradient: y=exp(–2.438–0.035*distance+0.0001*distance2); SL≤20% gradient: y=exp(–2.001–0.030*distance+0.00009*distance2); SL>20% gradient: y=exp(–2.901 0.034*distance+0.0001*distance2))
For both slope gradients and soil textures, the curvilinear relationship between average surface runoff and average soil loss was strongly negative (P≤0.001; R2=0.959; Fig. 8). Thus, although the volume of surface runoff increased with water bar density, the actual amount of soil loss per square meter of skid trail surface area decreased precipitously with increasing water bar density.
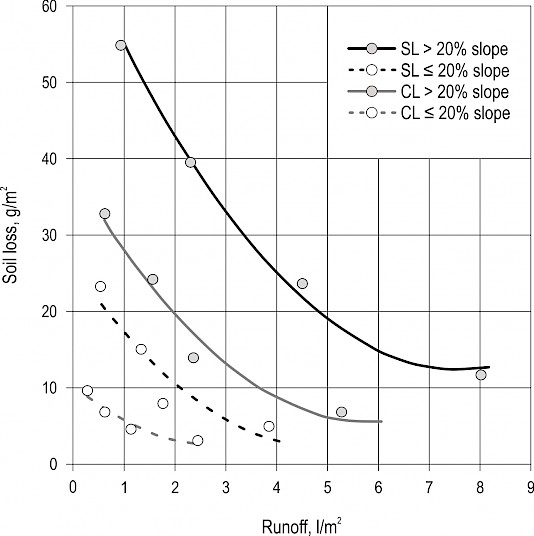
Fig. 8 Predicted relationship between average surface runoff volumes and average soil loss for clay loam (CL, black) and silt loam (SL, gray) based on multiple linear regression analysis (Regression functions differ by soil texture and slope gradient (R2=0.986): CL≤20% gradient: y=10.252–5.534*runoff+0.98*runoff2; CL>20% gradient: y=38.392–11.348*runoff+0.98*runoff2; SL≤20% gradient: y=25.946–9.648*runoff+0.98*runoff2; SL>20% gradient: y=68.759–14.871*runoff+0.98*runoff2. The effect of the density of water bars can be seen by noticing that the observations (marked by »X«) correspond to one, two, three, and six water bars (along the x-axis) for each combination of soil texture and slope gradient)
4. Discussion
Soil erosion is regarded as one of the most critical environmental problems worldwide (e.g., Le Roux et al. 2008, Schönbrodt-Stitt et al. 2013, Ma et al. 2014, Seutloali and Beckedahl 2015a). Although soil erosion is a natural process, it has generally been accelerated on the landscape by human activities such as agriculture, mining, grazing, and fire (Leh et al. 2013, Mandal and Sharda 2013, Ziadat and Taimeh 2013). The construction of skid trails and ground-based skidding operations also result in soil compaction (Cerdà 2007, Cheng et al. 2013), which increases bulk density, reduces soil porosity, decreases infiltration rates, lowers soil permeability, leads to increases in surface runoff and soil erosion, and is seen as an important criterion for soil degradation (Froehlich et al. 1981) that ultimately creates a less favorable soil environment for plant growth (Greacen and Sands 1980, Solgi et al. 2014).
BMPs are designed to reduce the amount, depth, and velocity of water movement and increase soil stability and infiltration rates. The primary tools to accomplish this are water diversion structures such as water bars and dips (both rolling and broad based) and ground cover management such as grass seeding or additions of mulch, gravel or logging debris/slash. Water bars are earthen structures constructed at certain intervals along the road and skid trail to capture surface water that is diverted off the road and trail surface into non-road/trail areas. The spacing of water bars depends on the grade of the road or trail such that the distance between water bars is decreasing with increasing grade from about 75 m at a grade of 2% to 14 m at 20% and 11 m at a grade of 30% (Virginia Dept. Forestry 2011). Water bars should be constructed at a sufficient height (15–30 cm) so that water flow will not overtop them, which would render them less effective.
Whereas BMPs describe how water bars should be constructed, we are not aware of a single study that has estimated how much soil is lost due to the construction of the water bars themselves. Water bar construction results in soil disturbance (Fig. 2), which leads to a loosening of soil particles that may actually lead to an increase in the amounts of soil loss, at least initially. While we cannot quantify the soil loss due to surface runoff versus soil loss due to the construction of the water bars themselves, we have no reason to believe that the amounts of soil loss contributed by the construction of the water bars differed between the water bars. Consequently, we do not think that the disturbance of the soil due to the construction of water bars produced biased estimates of soil loss, which was strongly influenced by soil texture, slope gradient, and the distance between water bars in this study.
Soil texture governs soil cohesion and is the primary factor that determines how easily soil particles are detached from the soil surface and thus determines the resistance to soil erosivity. Whereas coarse-textured soils are only erodible at high water velocities (Erpul and Canga 1999), fine-textured soils such as those in this study have low cohesion and are very erodible and more easily transported by water (Masumian et al. 2017). Due to lower sand and greater clay content, fine-textured clay loam soils have greater soil strength and cohesiveness of soil particles than fine-textured silt loam soils that are characterized by larger particle sizes and more loose connected sand particles (Compton 2003). Further, greater bulk density in the silt loam than the clay loam soil likely reduced soil water conductivity and soil infiltration rates, which may explain why the silt loam soil in this study was less stable and more erodible and experienced greater amounts of surface runoff volume and soil loss than the clay soil. Our results are in line with Ekwue and Harrilal (2010), who found that soil type/texture is the most important factor of surface runoff generation and soil loss. While it is well known that uncompacted fine-textured silt soils are often the most erodible soils because their cohesion is relatively low (Greacen and Sands 1980), it appears that this result can be extended to compacted silt loams as well.
Our results highlight the importance of addressing water regulation issues at the time of siting the skid trail so that the distance between water bars is reduced with increasing trail gradients to minimize future soil erosion (Koulouri and Giourga 2007, Solgi et al. 2014). As slope gradients increase, the velocity of water that runs over the surface increases and increases in its erosive power (Ekwue and Harrilal 2010), which has been shown to enhance the erosion capacity of a silty loam soil on steeper slope gradients (Zhang et al. 2002). Greater flow velocities on steeper slope gradients thus increase the detachment and transport of soil particles (Fox and Bryan 1999, Chaplot and Le Bissonnnais 2000), and the resulting interaction between trail gradient and soil texture points to particularly large soil losses for silty loam soils on steeper slopes (Ekwue and Harrilal 2010, Masumian et al. 2017).
The results of this study showed that slope length or the distance between water control structures (i.e., slope length is the inverse of the density of water bars that becomes shorter when more water bars are constructed) is another important factor that influences unit area runoff and soil loss. Similar to previous studies that found increasing slope length to result in decreased runoff and increased soil loss for highly disturbed sites (Chaplot and Le Bissonnais 2003, Moreno‐de las Heras et al. 2010), surface runoff volumes in this study also decreased with increasing slope length (i.e., lower density of water bars). The increase in surface runoff volumes with increasing slope gradient observed on both soil textures in this study may be explained by lower depression storage capacities and higher depression connectivity on steeper slopes (Chaplot and Le Bissonnais 2003). Further, results showed that the increase of soil loss with increasing slope length (i.e., lower density of water bars) is greater on silty loam than on clay loam soil. This may be explained by lower cohesiveness of soil particles in silty loam soil than in clay loam soil. The significant interaction between soil texture and slope length (i.e., density of water bars) revealed that not only were surface runoff and soil loss greater on the silty loam than on the clay loam soil, but also that the differences in responses between these differently-textured soils grew with decreasing (runoff) or increasing (soil loss) slope length.
The different dynamics between surface runoff volumes and soil loss per square meter of skid trail surface with different water bar densities reveals that, although more water bars collect and divert greater volumes of surface water off the skid trail, this does not mean greater soil losses from the skid trail. On the contrary, the more efficient water diversion with a greater number of water bars resulted in lower amounts of soil loss, presumably because shorter slope lengths may have slowed the velocity of runoff, preventing the surface water from dislodging greater amounts and greater particles off the skid trail. As surface water runoff is a balance between greater velocity of runoff, and thus lower rates of infiltration and more time spent by a rain drop and a greater chance to infiltrate at lower densities of water bars, particularly when the soil is compacted and the slope gradient is steep, the actual runoff volume may be affected by rainfall intensity. Since we were unable to measure the actual precipitation of each rainfall event in this study, we cannot investigate the relationship between rainfall intensity and slope length. For example, Moreno‐de las Heras et al. (2010) found a relation between slope length with intensity of precipitation that was more pronounced at low intensity events and when there was a dense vegetation cover present. Considering the very narrow ranges of surface runoff volume in each soil texture × slope gradient × slope length combination (Fig. 6), it seems that there may not have been enough variability in rainfall events to meaningfully link surface water runoff to rainfall intensity in this study. Nonetheless, the relationship between surface runoff volume and soil loss clearly shows that greater runoff volumes collected by more water bars resulted in greatly reduced amounts of soil loss per unit of runoff in this study (Fig. 8). While a diminishing return in reducing soil loss with a greater density of water bars can be expected, the relationship between soil loss and distance between water bars (Fig. 7) shows that the slope of the regression curve does not yet flatten between distances of 50 to 25 m, indicating that returns had not been diminished at the shortest distance between water bars. This is particularly evident for slopes >20%, where the absolute reduction in soil loss with additional water bars was greatest. Indeed, this result is not surprising when considering that recommended distances between water bars in BMPs in the eastern United States are much shorter than those applied in this study, ranging between 25–14 m for slope gradients of 10–20% and between 14–11 m for slope gradients between 20–30% (Virginia Dept. Forestry 2011). Our results indicate that these recommended distances may also be applicable in Hyrcanian forests of Iran. It is evident that not only are runoff control practices such as the installation of water diversions or post-harvest rehabilitation of skid trails and forest roads essential for reducing the quantity of runoff and minimizing sediment movement (Croke et al. 2001, Grace and Clinton 2007), but the frequency with which these measures are employed is of crucial importance if runoff and soil erosion are to be minimized. Despite some differences in the volumes of surface runoff and amounts of soil loss between the two soil textures, it appears that the distances between water bars shorter than 50 m on slope gradients ≤20% did not lead to substantial reductions of soil loss, whereas they did on slope gradients >20%. We therefore amend earlier recommendations by Masumian et al. (2017) for the same two soil textures and recommend reducing distances between water bars from 75 to at most 50 m for slope gradients ≤20% and distances of no more than 25 m for slope gradients >20%. The latter recommendation may be revised once local studies have evaluated whether a reduction of distances below 25 m on slope gradients >20% may lead to substantial further reductions in soil loss, particularly on silt loam soils. Following these recommendations, the installation of water diversion techniques such as water bars reduces not only soil loss but may also reduce nutrient discharge (Bjorneberg et al. 2000), contributing to improved soil and water conservation and plant fertility (Ekwue and Harrilal 2010).
5. Conclusion
The installation of water bars represents a commonly prescribed BMP in Iran that is generally considered the minimum level of BMP implementation. These research results indicate that water bars are an effective tool to reduce sediment transport/soil loss following forestry operations. Although surface runoff volumes and soil losses are influenced by soil texture, the slope gradient of the skid trail has the greatest impact on runoff and soil loss. However, surface runoff volumes and amounts of soil loss can be affected by the density of water bars that are installed. We recommend that more water bars should be installed on steeper gradients on both soil types. Distances between water bars should not exceed 25 m on gradients >20% and 50 m on gradients ≤20%. The effectiveness of the water bars is primarily due to the reduction in slope length, which in turn reduces the overland flow velocity of surface water. Since erosion rates are greatest immediately following soil disturbance due to skidding operations, water bars should be installed immediately after the completion of skidding and before the spring season that is typically accompanied by rain events of greater intensity.
6. References
Akay, A.E., Erdas, O., Reis, M., Yuksel, A., 2008: Estimating sediment yield from a forest road network by using a sediment prediction program and GIS techniques. Building and Environment 43(5): 687–695. https://doi.org/10.1016/j.buildenv.2007.01.047
Akbarimehr, M., Naghdi, R., 2012a: Determination of most appropriate distance between water diversions on skid trails in the mountainous forest, north of Iran. Catena 88(1): 68–72. https://doi.org/10.1016/j.catena.2011.08.005
Akbarimehr, M., Naghdi, R., 2012b: Assessing the relationship of slope and runoff volume on skid trails (Case study: Nav 3 district). Journal of Forest Science 58(8): 357–362. https://doi.org/10.17221/26/2012-JFS
Anderson, C.J., Lockaby, B.G., 2011: Research gaps related to forest management and stream sediment in the United States. Environmental Management 47(2): 303–313. https://doi.org/10.1007/s00267-010-9604-1
Arnaez, J., Larrea, V., Ortigosa, L., 2004: Surface runoff and soil erosion on unpaved forest roads from rainfall simulation tests in northeastern Spain. Catena 57(1): 1–14. https://doi.org/10.1016/j.catena.2003.09.002
Aust, W.M., Blinn, C.R., 2004: Forestry best management practices for timber harvesting and site preparation in the eastern United States: An overview of water quality and productivity research during the past 20 years (1982–2002). Water, Air, and Soil Pollution: Focus 4(1): 5–36. https://doi.org/10.1023/B:WAFO.0000012828.33069.f6
Aust, W.M., Bolding, M.C., Barrett, S.B., 2015: Best management practices for low-volume roads in the piedmont region: summary and implications of research. Transportation Research Record: Journal of the Transportation Research Board 2472(1): 51–55. https://doi.org/10.3141/2472-06
Battiato, A., Diserens, E., Laloui, L., Sartori, L., 2013: A mechanistic approach to topsoil damage due to slip of tractor tyres. Journal of Agriculture Science and Applications 2(3): 160–168.
Bjorneberg, D.L., Aase, J.K., Westermann, D.T., 2000: Controlling sprinkler irrigation runoff, erosion, and phosphorus loss with straw and polyacrylamide. American Society of Agricultural Biological Engineering 43(6): 1545–1551. https://doi.org/10.13031/2013.3054
Bochet, E., Garcí-Fayos, P., 2004: Factors Controlling Vegetation Establishment and Water Erosion on Motorway Slopes in Valencia, Spain. Restoration Ecology 12(2): 166–174. https://doi.org/10.1111/j.1061-2971.2004.0325.x
Bochet, E., García-Fayos, P., Tormo, J., 2009: How can we control erosion of roadslopes in semiarid Mediterranean areas? Soil improvement and native plant establishment. Land Degradation and Development 21(2): 110–121. https://doi.org/10.1002/ldr.911
Cerdà, A., 2007: Soil water erosion on road embankments in eastern Spain. Science of the Total Environment 378(1–2): 151–155. https://doi.org/10.1016/j.scitotenv.2007.01.041
Chaplot, V., Le Bissonnais, Y., 2000: Field measurements of interrill erosion under different slopes and plot sizes. Earth Surface Processes and Landforms 25(2): 145–153. https://doi.org/10.1002/(SICI)1096-9837(200002)25:2<145::AID-ESP51>3.0.CO;2-3
Cheng, B., Lv, Y., Zhan, Y., Su, D., Cao, S., 2015: Constructing China’s roads as works of art: a case study of »esthetic greenway« construction in the Shennongjia region of China. Land Degradation and Development 26(7): 324–330. https://doi.org/10.1002/ldr.2210
Compton, A., 2003: Runoff, Erosion and Sediment Control Best Management Practices for Yukon Placer Mining Operations. EDI Environmental Dynamics Inc, 29 p.
Croke, J.C., Hairsine, P.B., Fogarty, P., 2001: Soil recovery from track construction and harvesting changes in surface infiltration, erosion, and delivery rates with time. Forest Ecology and Management 143(1–3): 3–12. https://doi.org/10.1016/S0378-1127(00)00500-4
Ekwue, E.I., Harrilal, A., 2010: Effect of soil type, peat, slope, compaction effort and their interactions on infiltration, runoff and raindrop erosion of some Trinidadian soils. Biosystem Engineering 105(1): 112–118. https://doi.org/10.1016/j.biosystemseng.2009.10.001
Erpul, G., Canga, M.R., 1999: Effect of subsequent simulated rainfalls on runoff and erosion. Turkish Journal of Agriculture and Forestry 23(6): 659–665.
Farrakh Nawaz, M., Bourrié, G., Trolard, F., 2013: Soil compaction impact and modelling. A review. Agronomy for Sustainable Development 33(2): 291–309. https://doi.org/10.1007/s13593-011-0071-8
Fox, D.M., Bryan, R.B., 1999: The relationship of soil loss by interrill erosion to slope gradient. Catena 38(3): 211–222. https://doi.org/10.1016/S0341-8162(99)00072-7
Froehlich, H., Aulerich, D., Curtis, R., 1981: Designing skid trail system to reduce soil impacts from tractive logging machines. Forest Research Laboratory, Oregon State University, Research Paper 44, Corvallis Oregon, USA: 1–15.
Fu, B., Newham, L.T.H., Ramos-Scharron, C.E., 2010: A review of surface erosion and sediment delivery models for unsealed roads. Environmental Modelling and Software 25(1): 1–14. https://doi.org/10.1016/j.envsoft.2009.07.013
Grace, J.M., 2002: Control of sediment export from the forest road prism. Transactions of the American Society of Agricultural and Biological Engineers 45(3): 1127–1132. https://doi.org/10.13031/2013.9913
Greacen, E.L., Sands, R., 1980: Compaction of forest soils: a review. Australian Journal of Soil Research 18(2): 163–189. https://doi.org/10.1071/SR9800163
Halleux, O.R.M., Greene, W.D., 2003: Setting analyst: an operational harvest planning tool. International Journal of Forest Engineering 14(1): 89–101. https://doi.org/10.1080/14942119.2003.10702473
Hussein, M.H., Kariem, T.H., Othman, A.K., 2007: Predicting soil erodibility in northern Iraq using natural runoff plot data. Soil and Tillage Research 94(1): 220–228. https://doi.org/10.1016/j.still.2006.07.012
Jordán-López, A., Martinez-Zavala, L., 2008: Soil loss and runoff rates on unpaved forest roads in southern Spain after simulated rainfall. Forest Ecology and Management 255(3–4): 913–919. https://doi.org/10.1016/j.foreco.2007.10.002
Kalra, Y.P., Maynard, D.G., 1991: Methods and manual for forest soil and plant analysis. Northern Forestry Centre NOR-X-319, Forestry Canada, Northwest Region, Edmonton, Alberta, Canada, 116 p.
Kateb, E.H., Zhang, H., Zhang, P., Mosandl, R., 2013: Soil erosion and surface runoff on different vegetation covers and slope gradients: a field experiment in Southern Shaanxi Province, China. Catena 105(1): 1–10. https://doi.org/10.1016/j.catena.2012.12.012
Koulouri, M., Giourga, C., 2007: Land abandonment and slope gradient as key factors of soil erosion in Mediterranean terraced lands. Catena 69(3): 274–281. https://doi.org/10.1016/j.catena.2006.07.001
Lee, J.W., Park, C.M., Rhee, H., 2013: Revegetation of decomposed granite roadcuts in Korea: Developing digger, evaluating cost effectiveness, and determining dimensions of drilling holes, revegetation species, and mulching treatment. Land Degradation and Development 24(6): 591–604. https://doi.org/10.1002/ldr.2248
Leh, M., Bajwa, S., Chaubey, I., 2013: Impact of land use change on erosion risk: an integrated remote sensing, geographic information system and modeling methodology. Land Degradation and Development 24(5): 409–421. https://doi.org/10.1002/ldr.1137
Le Roux, J.J., Morgenthal, T.L., Malherbe, J., Pretorius, D.J., Sumner, P.D., 2008: Water erosion prediction at a national scale for South Africa. Water SA 34(3): 305–314. https://doi.org/10.4314/wsa.v34i3.180623
Litschert, S.E., MacDonald, L.H., 2009: Frequency and characteristics of sediment delivery pathways from forest harvest units to streams. Forest Ecology and Management 259(2): 143–150. https://doi.org/10.1016/j.foreco.2009.09.038
Liu, Y.J., Wang, T.W., Cai, C.F., Li, Z.X., Cheng, D.B., 2014: Effects of vegetation on runoff generation, sediment yield and soil shear strength on road-side slopes under a simulation rainfall test in the Three Gorges Reservoir Area, China. Science of the Total Environment 485–486(1): 93–102. https://doi.org/10.1016/j.scitotenv.2014.03.053
Ma, X., He, Y., Xu, J., Van Noordwijk, M., Lu, X., 2014: Spatial and temporal variation in rainfall erosivity in a Himalayan watershed. Catena 121(1): 248–259. https://doi.org/10.1016/j.catena.2014.05.017
Mandal, D., Sharda, V., 2013: Appraisal of soil erosion risk in the eastern Himalayan region of India for soil conservation planning. Land Degradation and Development 24(5): 430–437. https://doi.org/10.1002/ldr.1139
Martinez-Zavala, L., Jordan-Lopez, A., Bellinfate, N., 2008: Seasonal variability of runoff and soil loss on forest road back slopes under simulated rainfall. Catena 74(1): 73–79. https://doi.org/10.1016/j.catena.2008.03.006
Masumian, M., Naghdi, R., Zenner, E.K., 2017: Effectiveness of water diversion and erosion control structures on skid trails following timber harvesting. Ecological Engineering 105(2): 370–378. https://doi.org/10.1016/j.ecoleng.2017.05.017
McBroom, M.W., Beasley, R.S., Chang, M., Ice, G.G., 2008: Water quality effects of clearcut harvesting and forest fertilization with best management practices. Journal of Environmental Quality 37(1): 114–124. https://doi.org/10.2134/jeq2006.0552
McColl, J.G., 1995: Forest clear-cutting soil response, in: Nierenberg W.A., Encyclopedia of Environmental Biology, Vol. 2 (Ed.), Academic Press, San Diego, California, USA, 95–103.
Mohamadi, M.A., Kavian, A., 2015: Effects of rainfall patterns on runoff and soil erosion in field plots. International Soil and Water Conservation Research 3(4): 273–281. https://doi.org/10.1016/j.iswcr.2015.10.001
Moreno-de las Heras, M., Nicolau, J.M., Merino-Martín, L., Wilcox, B.P., 2010: Plot-scale effects on runoff and erosion along a slope degradation gradient. Water Resources Research 46(4): 1–12. https://doi.org/10.1029/2009WR007875
Morgan, R.P.C., 1986: Soil Erosion and Conservation. Longman, New York.
Naghdi, R., Solgi, A., Ilstedt, U., 2016: Soil chemical and physical properties after skidding by rubber-tired skidder in Hyrcanian forest, Iran. Geoderma 265(1): 12–18. https://dx.doi.org/10.1016/j.geoderma.2015.11.009
Naghdi, R., Solgi, A., Labelle, E.R., Nikooy, M., 2020: Combined effects of soil texture and machine operating trail gradient on changes in soil physical properties during ground-based skidding. Pedosphere 30(4): 508–516. https://doi.org/10.1016/S1002-0160(17)60428-4
Sadeghi, S.H.R., Ghaderi Vangah, B., Safaeeian, N.A., 2007: Comparison between effects of open grazing and manual harvesting of cultivated summer rangelands of northern Iran on in filtration, runoff and sediment yield. Land Degradation and Development 18(6): 608–620. https://doi.org/10.1002/ldr.799
Sawyers, B.C., Bolding, M.C., Aust, W.M., Lakel, W.A. III., 2012: Effectiveness and implementation costs of overland skid trail closure techniques in the Virginia Piedmont. Journal of Soil and Water Conservation 67(4): 300–310. https://doi.org/10.2489/jswc.67.4.300
Schönbrodt-Stitt, S., Bosch, A., Behrens, T., Hartmann, H., Shi, X., Scholten, T., 2013: Approximation and spatial regionalization of rainfall erosivity based on sparse data in a mountainous catchment of the Yangtze River in Central China. Environmental Science and Pollution Research 20(3): 6917–6933. https://doi.org/10.1007/s11356-012-1441-8
Seutloali, K.E., Beckedahl, H.R., 2015a: Understanding the factors influencing rill erosion on roadcuts in the south eastern region of South Africa. Solid Earth 6(2): 633–641. https://doi.org/10.5194/se-6-633-2015
Seutloali, K.E., Beckedahl, H.R., 2015b: Review of road‒related soil erosion: an assessment of causes, evaluation techniques and available control measures. Earth Sciences Research Journal 19(1): 73–80. http://dx.doi.org/10.15446/esrj.v19n1.43841
Shepard, J.P., 2006: Water quality protection in bioenergy production: The US system of forestry best management practices. Biomass and Bioenergy 30(4): 378–384. https://doi.org/10.1016/j.biombioe.2005.07.018
Solgi, A., Najafi, A., Sadeghi, S.H., 2014: Effects of traffic frequency and skid trail slope on surface runoff and sediment yield. International Journal of Forest Engineering 25(2): 171–178. https://doi.org/10.1080/14942119.2014.955699
Solgi, A., Naghdi, R., Labelle, E.R., Behjou, F.K., Hemmati, V., 2019: Evaluation of different best management practices for erosion control on machine operating trails. Croatian Journal of Forest Engineering 40(2): 319–326. https://doi.org/10.5552/crojfe.2019.532
Swift, L.W. Jr., 1985: Forest road design to minimize erosion in the southern Appalachians. In Proc. Forestry and Water Quality: A Mid-South Symp., B.G. Blackmon, ed. Monticello, Ark.: University of Arkansas: 141–151.
United States Department of Agriculture, Natural Resources Conservation Service (USDA) 1999: Soil Taxonomy. A Basic System of Soil Classification for Making and Interpreting Soil Surveys. Agriculture Handbook Number 436. Washington DC. Second Edition, 887 p.
Virginia Department of Forestry 2011: Virginia’s best management practices for water quality. VA. Dep. For., Charlottesville. Fifth Edition March 2011, 165 p.
Wade, C.R., 2010: Evaluation of Best Management Practices for bladed skid trail erosion control and determination of erosion model accuracy and applicability. M.S. Thesis, Virginia Polytechnic Institute and State University, 109 p.
Wade, C.R., Bolding, M.C., Aust, W.M., Lakel, W.A. III., 2012: Comparison of five erosion control techniques for bladed skid trails in Virginia. Southern Journal of Applied Forest 36(4): 191–197. https://doi.org/10.5849/sjaf.11-014
Wallbrink, P.J., Croke, G., 2002: A combined rainfall simulator and tracer approach to assess the role of Best Management Practices in minimising sediment redistribution and loss in forests after harvesting. Forest Ecology and Management 170(1): 217–232. https://doi.org/10.1016/S0378-1127(01)00765-4
Zar, J.H., 1999: Biostatistical Analysis. 4th Ed. Upper Saddle River, Prentice Hall: 663.
Ziadat, F., Taimeh, A., 2013: Effect of rainfall intensity, slope, land use and antecedent soil moisture on soil erosion in an arid environment. Land Degradation and Development 24(6): 582–590. https://doi.org/10.1002/ldr.2239
© 2021 by the authors. Submitted for possible open access publication under the
terms and conditions of the Creative Commons Attribution (CC BY) license (http://creativecommons.org/licenses/by/4.0/).
Authors’ addresses:
Ahmad Solgi, PhD *
e-mail: aforestsolgi@gmail.com
Prof. Ramin Naghdi, PhD
e-mail: rnaghdi@guilan.ac.ir
University of Guilan
Faculty of Natural Resources
Department of Forestry
Sowmeh Sara, Guilan
P.O. Box 1144
IRAN
Assoc. prof. Eric K. Zenner, PhD
e-mail: eric.zenner@psu.edu
Penn State University
Department of Ecosystem Science and Management
University Park, PA
USA
Prof. Farshad Keivan Behjou, PhD
e-mail: farshad.keivan@gmail.com
University of Mohaghegh Ardabili
Faculty of Agriculture and Natural Resources
Department of Forest Sciences
Ardabil
IRAN
Leila Vatani, PhD
e-mail: vatany2000@yahoo.com
Tarbiat Modares University
Faculty of Natural Resources and Marine Science
Department of Forest Science and Engineering
Noor, Mazandaran
IRAN
* Corresponding author
Received: 25 August 2019
Accepted: 19 April 2021
Original scientific paper