
Field Setup and Assessment of a Cloud-Data Based Crane Scale (CCS) Considering Weight- and Local Green Wood Density-Related Volume References
doi: 10.5552/crojfe.2022.1186
volume: 43, issue:
pp: 19
- Author(s):
-
- Starke Michael
- Geiger Chris
- Article category:
- Original scientific paper
- Keywords:
- crane scale, forwarder, cloud data, fleet management, timber logistics, artificial neural networks, green density, wood density
Abstract
HTML
When investigating the forwarding process within the timber supply chain, insufficient data often inhibits long-term studies or make real-time optimisation of the logistics process difficult. Information sources to compensate for this lack of data either depend on other processing steps or they need additional, costly hardware, such as conventional crane scales. An innovative weight-detection concept using information provided by a commonly available hydraulic pressure sensor may make the introduction of a low-cost weight information system possible. In this system, load weight is estimated by an artificial neural network (ANN) based on machine data such as the hydraulic pressure of the inner boom cylinder and the grapple position.
In our study, this type of crane scale was set up and tested under real working conditions, implemented as a cloud application. The weight scale ANN algorithm was therefore modified for robustness and executed on data collected with a commonly available telematics module. To evaluate the system, also with regard to larger sample sizes, both direct weight-reference measurements and additional volume-reference measurements were made. For the second, locally valid weight-volume conversion factors for mainly Norway spruce (Picea abies, 906 kg m-3, standard error of means (SEM) of 13.6 kg m-3), including mean density change over the observation time (–0.16% per day), were determined and used as supportive weight-to-volume conversion factor.
Although the accuracy of the weight scale was lower than in previous laboratory tests, the system showed acceptable error behaviour for different observation purposes. The twice-observed SEM of 1.5% for the single loading movements (n=95, root-mean-square error (RMSE) of 15.3% for direct weight reference; n=440, RMSE=33.2% for volume reference) enables long-term observations considering the average value, but the high RMSE reveals problems with regard to the single value information.
The full forwarder load accuracy, as unit of interest, was observed with an RMSE of 10.6% (n=41), considering a calculated weight-volume conversion as reference value. An SEM of 5.1% for already five observations with direct weight reference provides a good starting point for work-progress observation support.
Field Setup and Assessment of a Cloud-Data Based Crane Scale (CCS) Considering Weight- and Local Green Wood Density-Related Volume References
Michael Starke, Chris Geiger
https://doi.org/10.5552/crojfe.2022.1186
Abstract
When investigating the forwarding process within the timber supply chain, insufficient data often inhibits long-term studies or make real-time optimisation of the logistics process difficult. Information sources to compensate for this lack of data either depend on other processing steps or they need additional, costly hardware, such as conventional crane scales. An innovative weight-detection concept using information provided by a commonly available hydraulic pressure sensor may make the introduction of a low-cost weight information system possible. In this system, load weight is estimated by an artificial neural network (ANN) based on machine data such as the hydraulic pressure of the inner boom cylinder and the grapple position.
In our study, this type of crane scale was set up and tested under real working conditions, implemented as a cloud application. The weight scale ANN algorithm was therefore modified for robustness and executed on data collected with a commonly available telematics module. To evaluate the system, also with regard to larger sample sizes, both direct weight-reference measurements and additional volume-reference measurements were made. For the second, locally valid weight-volume conversion factors for mainly Norway spruce (Picea abies, 906 kg m-3, standard error of means (SEM) of 13.6 kg m-3), including mean density change over the observation time (–0.16% per day), were determined and used as supportive weight-to-volume conversion factor.
Although the accuracy of the weight scale was lower than in previous laboratory tests, the system showed acceptable error behaviour for different observation purposes. The twice-observed SEM of 1.5% for the single loading movements (n=95, root-mean-square error (RMSE) of 15.3% for direct weight reference; n=440, RMSE=33.2% for volume reference) enables long-term observations considering the average value, but the high RMSE reveals problems with regard to the single value information.
The full forwarder load accuracy, as unit of interest, was observed with an RMSE of 10.6% (n=41), considering a calculated weight-volume conversion as reference value. An SEM of 5.1% for already five observations with direct weight reference provides a good starting point for work-progress observation support.
Keywords: crane scale, forwarder, cloud data, fleet management, timber logistics, artificial neural networks, green density, wood density
1. Introduction
Within the timber supply chain, the exchange of information such as work progress is of fundamental importance. With this information, a cost-effective and optimised timber supply can be enabled (Heinimann 1999, Bodelschwingh 2006). One link in the timber supply chain, in addition to other timber extraction methods, is the forwarding process, in which logs are extracted to a mid-term storing site for further transportation or processing. Especially within cut-to-length operations, information about moved logs can be collected when the logs are entirely lifted from the ground. This concept is used by different manufacturers within their own logistics-information support systems (John Deere 2019, Komatsu 2019, PONSSE 2019). Most commonly, separate weight-scale units mounted at the boom tip above the grapple are installed to gain access to the weight information. Other systems rely on spatially referenced harvester information for forwarder work-progress monitoring (Manner 2015, Manner et al. 2016).
Despite the above-mentioned existing data-collection possibilities, accessing timber weight or volume information is still challenging. One problem is that crane scales are supplementary hardware tools and therefore not as common as productivity monitoring systems for harvesting work, which are included in the default machine configuration (Manner 2015). Therefore, investing in this additional high-accuracy equipment is more attractive in regions or for applications where crane scales area legal requirement (Brown and Ghaffarian 2016) or where their use is accepted for accounting and billing processes. This is for example the case in the Finnish timber industry, where the use of crane scales for creating a billing base within the pulpwood timber supply chain is increasingly accepted (Petty 2014). Other European countries have introduced regional regulations for the use of crane scales in fuel wood trade practices (Landes betrieb Landesforsten Rheinland-Pfalz 2017), but this has not yet had an effect on the general availability of crane scales for forwarders.
With increasing digitalisation and automation of timber production processes, alternative and less costly approaches to retrieving log-weight information are being developed. One of these solutions is based on analysing data from the controller area network (CAN) of a forwarder with an artificial neural network (ANN). It allows to derive the moved weight primarily from the inner-boom cylinder (IBC) hydraulic pressure behaviour over time (Geiger et al. 2018, Geiger et al. 2019). Thus, no separate load cell data, but data provided by the IBC pressure sensor is required for operation. However, the used scale setup is primarily designed for post-processed data-streams and lacks the hardware required for parallel in-field data processing. This combination inhibits its use for longer observation periods. As solution, intermediate storage of the data and later processing is necessary. To take advantage of this characteristic, the data may not be stored locally but moved to a cloud database, where the algorithm could be implemented as software functionality. The weight information can so be provided as optional software service and made available for different user groups. The optional long-term storage design makes near real-time as well as retrospective analyses possible. To apply the system to fit currently available infrastructure, modification of the algorithm is necessary, especially to make it work with lower resolution data that is needed for connectivity reasons. With these changes made, the accuracy and the characteristics of the system however must be rechecked as it is applied to the aimed working scenario.
This study investigated whether and to what extent an adapted version of the algorithm, implemented as cloud-based crane scale service, can be used 1) for acquisition of single-log information and 2) for long-term observation purposes under real working conditions.
As secondary objective, special attention was paid to the green density (ρ) distribution of the observed logs, as it is used both to assess the scale accuracy and to support additional long-term observation applications.
2. Materials and Methods
2.1 Cloud-Databased Crane Scale (CCS) Functionality
The fundamental crane-scale functionality followed the ANN design of Geiger et al. (2019) but was modified for higher robustness and implemented as cloud service to create the new, cloud-data based crane scale (CCS) design (Fig. 1). Similar to previous studies (Geiger et al. 2019), a HSM 208F F2020 forwarder (HSM Construction 2018), equipped with a hybrid hydraulic transformer system (HSM Hohenloher Spezial- Maschinenbau GmbH und Co. KG 2015, Geiger and Geimer 2017) was used as base machine.
To enhance the robustness of crane scale accuracy, the basic ANN (the long short-term memory network (LSTM)) was extended with a parallel evaluation branch consisting of a secondary convolutional neural network (CNN), based on the ideas of Devineau et al. (2018) and Gross et al. (2017) and demonstrated in Greff (2019). Further details on the functionality of the CNN-based crane scale can be found in Geiger et al. (2020). Based on the same machine data input, log weight is calculated by both the LSTM and CNN branches and is consecutively averaged. Both networks were separately trained under laboratory conditions with logs between 4 and 5 metres in length.
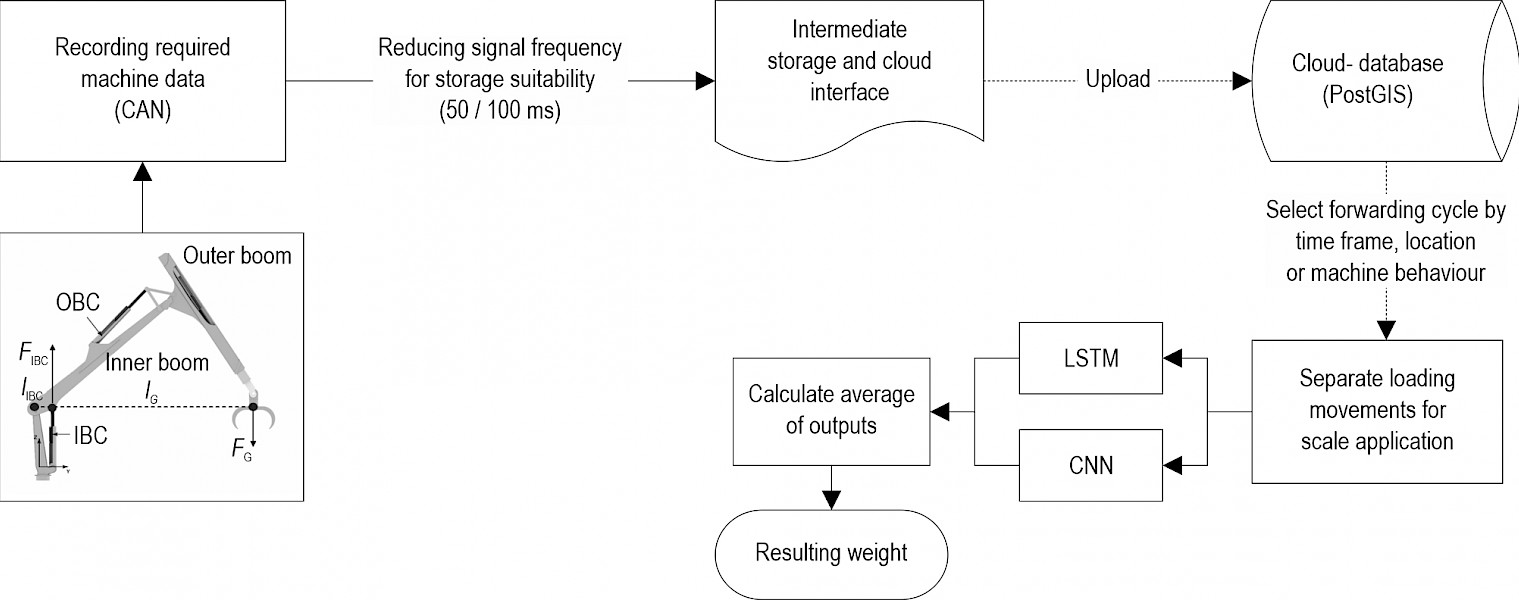
Fig. 1 Layout of the designed cloud-data based crane scale, consisting of a telematics module as controller area network (CAN) interface and for intermediate storage, combined with the concept of retrospective executions of two separate scale algorithm types (convolutional neural networks (CNN) and long short-term memory (LSTM) networks) on cloud data
The time sequence for the input data was considered between the completed log-gripping step of the loading movement and the retracting movement of the grapple with the log towards the bunk. This represents two of the four described loading-cycle phases described by Geiger and Geimer (2017). The basic input variables included the IBC-hydraulic pressure, the fast Fourier transformed IBC pressure as frequency spectrum, as well as the lever that changes dynamically with the crane position including the control signals. In addition, the corresponding hybrid-hydraulic system pressures (accumulator, pump and valve pressures) and the hydraulic oil temperature were retrieved as machine environment input variables for the networks. All input data was required to detect and extract the loading cycle from the forwarder crane movements and to subsequently derive log weight with the combined ANN.
To record the forwarder crane data from the CAN bus, a commercially available telematics module (STW TC3G) was used. Unlike the laboratory setup (Geiger et al. 2019), data was recorded at a lower resolution where only the last value in a defined time interval was locally stored with the timestamp given by the data logger system time. After local data buffering, data packages were uploaded to the cloud storage and the combined ANN was executed on a remote client to calculate log weight as cloud-data based crane scale functionality.
The cloud data quality was limited by the all-in-one hardware data loggers employed. Timestamp recordings were delayed by up to several seconds at higher CPU loads on the data logger. Therefore, the CAN signal recording was backed up with a CL3000 raw-data logger to enable a later check of the signal quality. As a compromise between signal quality and recording resolution, two different time intervals were used in the field test, a 100 ms (10 Hz) and a 50 ms (20 Hz) time interval, which both delivered satisfactory results in the signal analysis (Fig. A1). To further stabilise data recording, all additional functionalities of the telematics system were deactivated during the study.
2.2 Study Site and Layout
The CCS tests were conducted in a typical forwarder work environment and took place near Eibenstock, located in the province of Saxony, Germany, from 26 March to 12 April 2019. The stand was dominated by Norway spruce (Picea abies) with interspersed individuals or groups of pine (Pinus sylvestris) and larch (Larix decidua). The harvesting intensity was predefined by a previous wind throw, which had occurred on 10 March 2019 in the Saxonian state forests (Sachsenforst). The throws were characterised by a mainly single-tree to group-wise de-rooting or crown breaking across all tree species. Spruce trees that had been infested with bark-beetle (Ips typographus) the previous year were extracted in the southern and eastern part of the study area (Fig. A2). All trees had been previously processed, and logs had been pre-concentrated by a harvester. Processing was conducted with a constant five-to-seven-day lead on extraction by the forwarder.
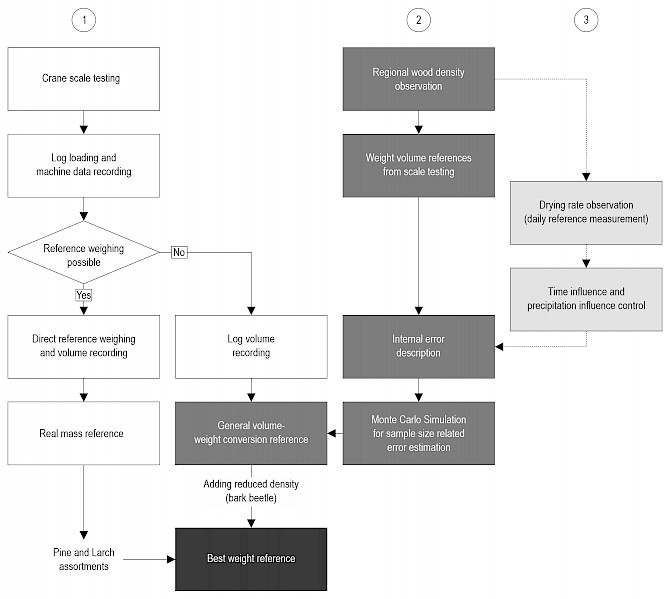
Fig. 2 Data collection and processing layout for weight-and volume-reference measurements: (1) direct weight-reference strand (white), (2) volume-conversion strand for large sample size evaluation (grey), both providing the best weight reference (black) and (3) observation of density change over time (light gray)
To evaluate the scale accuracy, the calculated weight was compared to different reference values. As the scale may be used for both obtaining single-log information and performing long-term machine observation, it must either fulfil high accuracy requirements for single values or must have an acceptable average error with a high number of repetitions. Both direct reference weighing and volume measurements were performed. As volume measurements are easier to perform than direct weight reference measurements, a larger size sample could be collected. To determine the weight-to-volume conversion accuracy for up scaling, local green densities were surveyed and change in density over time was monitored (Fig. 2). Three different reference values were considered: Firstly, the direct weight reference, secondly, the volume reference, based on a general density conversion factor, and thirdly, the best weight reference for large sample sizes, which considered tree species differences, as well as green density change over time and density reducing factors (bark beetle infestation).
Considering the weight and volume reference measurements, the forwarding information was documented in different resolutions (Var. 1–5, Table 1). In all cases, the logs were manually measured for length and diameter after an extraction cycle was completed. Start and end time (ends before unloading) of each forwarding cycle were recorded to manually identify the forwarding process in the dataset and to check for unobserved loading movements. To document the loading order (Var. 3–5), the logs had been previously numbered, and the number and count of the logs grappled during the loading movement were noted. In Var. 5, each log was separately weighed with an external crane scale (Kern HTS 1.5 t, with a verification value of 0.5 kg (Kern 2017)) by choking it with a sling, lifting, and weighing it in a static manner. A total of 1608 logs were measured in 44 forwarding cycles. In addition, 135 logs were separately weighed for evaluation. All tree species other than spruce were weighed separately or reference.
Table 1 Overview of forwarding operation characteristics and recorded parameters for forwarding-cycle observation variation 1 to 5 during field test near Eibenstock
|
Var. 1 |
Var. 2 |
Var. 3 |
Var. 4 |
Var. 5 |
|
|
Number of forwarding cycles |
1 |
21 |
3 |
14 |
5 |
|
Number of loading cycles |
NA |
NA |
92 |
270 |
99 |
|
Number of single logs |
100 |
878 |
92 |
403 |
135 |
|
Operator 1 |
X |
X |
– |
– |
– |
|
Operator 2 |
– |
X |
X |
X |
X |
|
Tree species |
PA |
PA, PAB (1) |
PA, PAB (5) |
PA, PAB (1) |
LD, PS, PA, PAB (1) |
|
Log diameter |
X |
X |
X |
X |
X |
|
Log length |
– |
X |
X |
X |
X |
|
Multi-log loading |
X |
X |
– |
X |
X |
|
Loading order |
– |
– |
X |
X |
X |
|
Real reference weight |
– |
– |
– |
– |
X |
|
Video reference |
– |
– |
– |
(X) |
(X) |
|
Saxony; tree species are abbreviated as LD (Larix decidua), PS (Pinus sylvestris), PA (Picea abies), PAB (Picea abies – bark beetle, including the number of logs) |
|||||
An operator change was necessary midway through the study (29 March 2019). The second operator was less experienced; thus this can be considered as potential change in working behaviour (Purfürst 2010). For this reason, a video analysis of the crane work was conducted for an additional six forwarding cycles to reveal potential systematic errors of the crane functionality and the operator’s loading movement peculiarities. The observed parameters included gripping point of the log (central, asymmetric) and load movements during the loading phase (rotating, dynamic loading with resulting pendulum motion). The gripping point of the log was defined as asymmetric with a grapple position in the outer third of the log length, while rotation referred to horizontal 120-degree turns of the load. To be counted as dynamic loading, an estimated oscillating 20-degree vertical offset of the load in opposite directions had to be observed.
2.3 Volume Conversion Factors
Volume conversion factors were obtained from the direct-reference weighing data of Var. 5 (Table 1). From this data, an average green density value was calculated. Within five cycles (No. 35–39), logs cut from trees that had been infested with bark beetle during the previous year were extracted. To account for their dried state, a separate conversion factor was determined. To estimate errors at single-log level in the volume-based scale assessments, the green density distribution for the spruce data (n=7) was modelled as a fitted normal distribution in a Monte Carlo simulation. This helped to assess the error development in relation to the number of observations.
Green density changeover time was investigated by repeated weighing of two groups of five logs, each stored near the forest road (Group A) and inside the forest stand (Group B, Table A1, Fig. A2), every working day. Weighing started simultaneously with the CCS field test six days after processing the trees. During the observation period, 2 mm precipitation (6.3 °C mean air temperature, 92% relative air humidity, 1.76 m s-1 average wind speed) were noted between 26 and 28 March at the meteorological station at Bergen, Saxony, 15 km from the study area (lat. 51.46°, long. 14.23°). From 28 March to 12 April, no more precipitation was recorded, and air temperature and wind speed rose to averages of 8.6 °C and 1.86 m s-1. After peaking at 100% during the nights, relative air humidity dropped to an average of 67% on 30 March (Sächsisches Landesamtfür Umwelt, Landwirtschaft und Geologie (LfULG 2019)).
2.4 Statistical Analyses
All statistical analyses were performed using the statistics software R (The CRAN R-Project 2020). Samples were tested for normality with the Shapiro-Wilk test and for equality of variances with Bartlett’s test. Groups were compared by pair wise t-test, or a Wilcoxon test was performed in case of a missing normal distribution. For multiple comparison, Dunnett’s test was used.
The accuracy of single value information of the scale output was characterised by the root-mean-square error (RMSE) considering different references. For multiple value evaluation of the scale output, the standard error of means (SEM) was calculated to account for larger sample sizes.
3. Results
3.1 Green Density Distribution and Error
Significant differences in green density (Fig. 3) were observed between freshly cut spruce logs and logs from the bark-beetle infested area (p<0.001). This shows that a further separation of these groups is necessary to ensure higher conversion accuracies when applying weight-to-volume conversion factors.
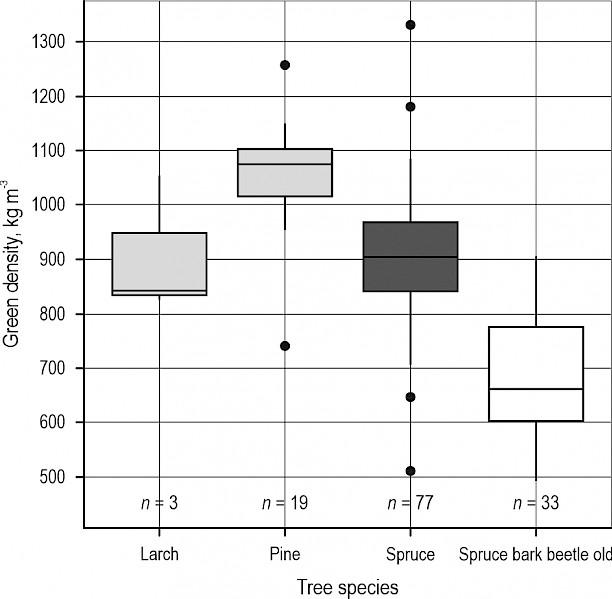
Fig. 3 Green densities observed within the study period, with averages of 907 kg m-3 for larch (light grey, left), 1051 kg m-3 for pine (light grey, right), 906 kg m-3 for all fresh spruce logs (dark grey) and 684 kg m-3 for spruce considering previous bark-beetle infestation (white)
The green density distribution of the spruce subset was later used as weight-to-volume conversion factor (same sample as Fig. 3) and is visualised in Fig. 4 as kernel density distribution (recording date: 1–2 April). The entire spruce dataset with reference recordings has a standard error of means (SEM) of 13.6 kg m-3 (1.5%, n=77) at a mean of 906 kg m-3. To obtain more information about data consistency, a further subset of green densities was drawn from the Var. 5 measurements. The subset is described by a SEM of 19.0 kg m-3 (2.0%, n=46) and a mean density of 933 kg m-3. Only marginal deviations from normal distribution were observed, regardless of the sample sizes. However, mean densities and log diameters varied (29.2 cm for the whole spruce dataset and 28.3 cm for the Var. 5 subset).
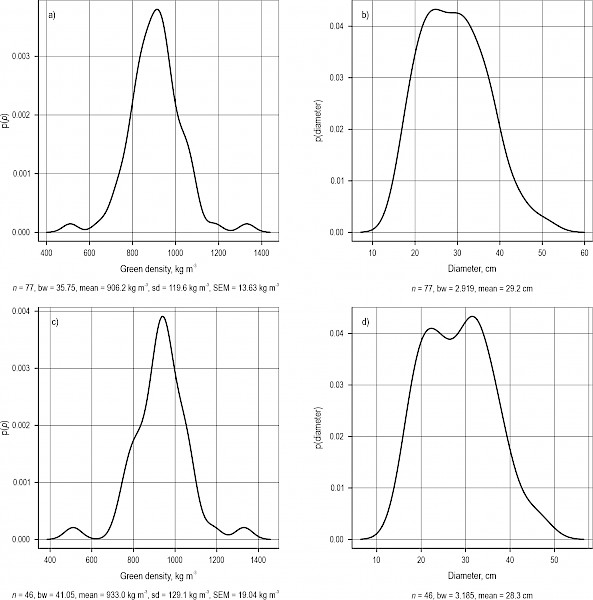
Fig. 4 Kernel density plots of observed green densities and respective diameter distributions of weight-reference logs for (a, b) spruce dataset (n=77) and (c, d) a subset drawn from Var. 5 data with a lower mean diameter (n=46)
To estimate the error expected from uncertainties of green densities, a Monte Carlo simulation between the real observed and predicted densities drawn from a normal distribution was performed, described by a mean of 906.2 kg m-3 and a standard deviation (SD) of 119.6 kg m-3. The resulting RMSE was 10.7 kg m-3 or 1.2% of the mean green density for 10.000 simulations of the sample with a size of 77 (Fig. A4).
3.2 Change of Green Density over Time
During the 18 days from day 6 to 23 after the processing of trees into logs, an overall mean density loss of 3.1% (27.61 kg m-3), corresponding to an average density loss of –1.4 kg m-3 or –0.16% per day (Fig. 5), was observed. The mean error of green density change per day was 0.07 kg m-3 with a 0.43% mean error between the average log differences. Snow fall resulted in an average, arithmetical green density increase of 17.75 kg m-3 (2%) and a larger between-log variation (1.9 kg m-3 to 36.19 kg m-3) on 26 and 27 March.
No significant differences were observed for the change of green density over time between the two storage locations (Wilcox, p=0.340). Nonetheless, a tendency towards higher variation caused by greater exposure to precipitation was observed at the storage location close to the forest road, as indicated by the peak in Fig. 5. A slightly higher basic variation was noticed at the storage location inside the forest, without any obvious connection to meteorological influence factors.
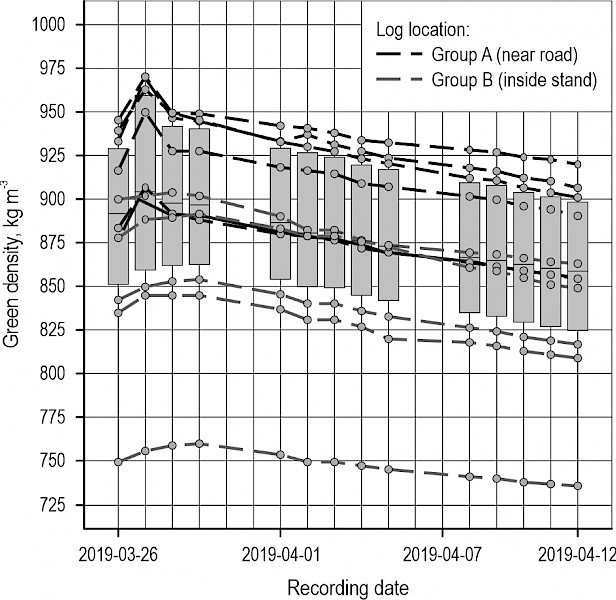
Fig. 5 Green density development of reference logs (Picea abies) over the observation period; near forest road (Group A, black, dashed line), inside forest stand (Group B, grey, dashed line) and their combined daily mean (solid black line) with variation (back ground boxplots for both groups)
3.3 Reference Weights and Conversion Factors
From the previous results, three references for the CCS evaluation were established, following the procedure described in Fig. 2: 1) Real mass, obtained by separate weighing of logs under real working conditions, 2) General volume-weight reference, where a mean green density (906 kg m-3 (basic error of 1.2% (RMSE)) for spruce) was verified and applied as a general conversion factor regardless of species, and 3) Best weight reference, where the volume conversion for spruce was enhanced by considering the lower green density (684 kg m-3) of logs from bark-beetle infested stands. In addition, pine and larch logs were referenced with their real mass in the related forwarding-cycle evaluations.
3.4 Individual Loading Movement CCS Accuracy
In Fig. 6, the weight estimates of the CCS for the Var. 3 to 5 data sets are compared to the references for individual loading movements. Low errors show that the estimates generally coincide well with the references. The highest congruence was observed for the real mass reference, while the general weight-to-volume reference tended to underestimate the weight of larger loads. Where different tree species and the effect of bark-beetle infestation on green density were considered, deviations could be reduced in some cases. Respective error statistics for all references are displayed in Table 2.
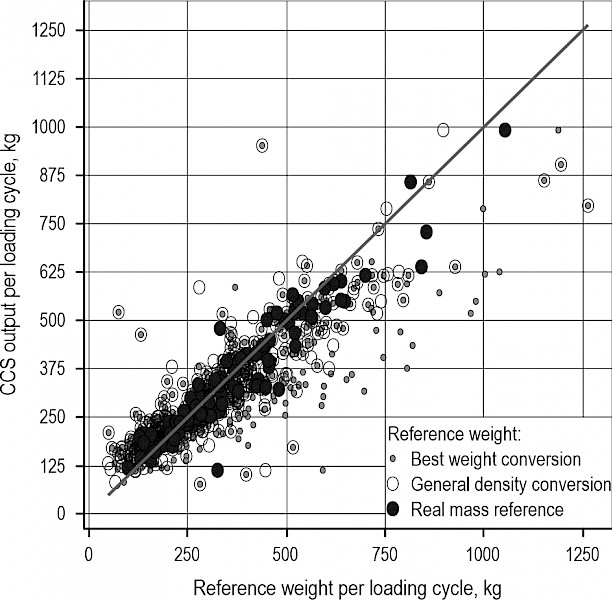
Fig. 6 Comparison of CCS results to reference weights (best reference mass, general volume converted mass (906 kg m-3) and measured real mass) for Var. 3–5 datasets on individual loading movements
Table 2 Comparison of errors for individual loading movements for three different references
|
Real mass reference (n = 95) |
General density conversion (n = 440) |
Best weight conversion (n = 440) |
|
|
Average CCS output per loading movement, kg |
377.6 |
359.5 |
331.2 |
|
RMSE, kg |
57.9 (15.3%) |
119.5 (33.2%) |
89.7 (27%) |
|
SEM, kg |
5.7 (1.5%) |
5.4 (1.5%) |
4.3 (1.3%) |
|
SD, kg |
55.7 (14.8%) |
113.8 (31.7%) |
89.3 (27%) |
3.5 Full Forwarder Load CCS Accuracy
In general, the CCS achieved higher accuracy on full forwarder load references (Fig. 7). The respective statistics are displayed in Table 3. All volume-based results showed that the accuracy of estimates was considerably enhanced when forwarding cycles with 3 m log assortments only were not considered. Finally, the RMSE of the best reference variant matches the real-mass reference (n=5) RMSE with both achieving the desired whole-load estimation accuracy.
Contrary to the individual loading movement observations, it is noted that all recorded cycles (Var. 1 to 5) of both machine operators were included in the analysis.
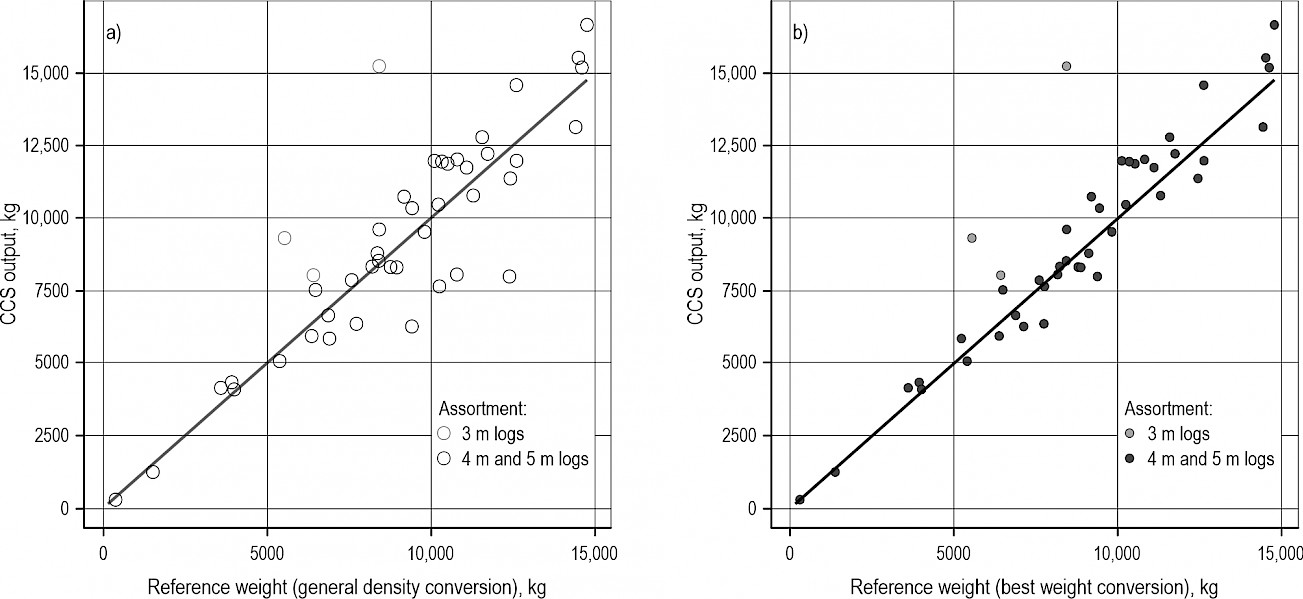
Fig. 7 Cumulative weight estimate of the CCS for full forwarder loads for all observed cycles (n=44) with two different weight references: (a) general density conversion (906 kg m-3) and (b) best weight reference. A separate visualisation of 3 m log assortments shows a systematically higher error in weight estimate and supports the resulting increase in accuracy when this assortment is not considered
Table 3 Error comparison of whole forwarding cycles considering different weight-to-volume conversion types
|
Real mass reference (n = 5) |
General density conversion (n = 44) |
General density conversion without 3 m logs (n = 41) |
Best weight conversion (n = 44) |
Best weight conversion without 3 m logs (n = 41) |
|
|
Avg. CCS output per forwarding cycle, kg |
7261.1 |
9030.6 |
9194.2 |
8750.3 |
8893.4 |
|
RMSE, kg |
780.5 (10.7%) |
1795.1 (19.9%) |
1383.0 (15%) |
1504.6 (17.2%) |
940.8 (10.6%) |
|
SEM, kg |
372.2 (5.1%) |
270.9 (3%) |
218.7 (2.4%) |
214.9 (2.5%) |
142.6 (1.6%) |
|
SD, kg |
832.4 (11.5%) |
1976.6 (19.9%) |
1400.1 (15%) |
1425.8 (16.3%) |
913.0 (10.3%) |
In Fig. 8, the datasets for individual loading movements as well as for full forwarder loads are displayed in combination to visualise the summarised error for single forwarding cycles. Only data for operator 2 is considered, with a maximum of 22 forwarding cycles and 440 logs (loading movements) for the volume-conversion methods, and a minimum of 4 forwarding cycles and 95 logs for the real-weight reference data. The effect of reducing the CCS error by using more accurate conversion factors is particularly noticeable when the datasets of cycle 35–39 for the best weight and general conversion variants are compared.
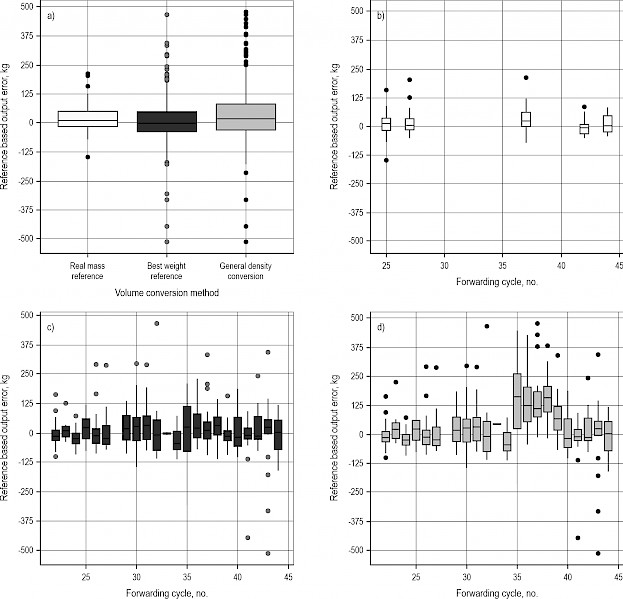
Fig. 8 Observation of all forwarding cycles containing single-loading reference weights (Var. 3–5, all loading movements) in (a) direct comparison of different references, considering the main weight-volume conversion types: (b) real mass reference, (c) best weight reference and (d) general density conversion reference, at a green density of 906 kg m-3
3.6 Operator Effect on CCS Accuracy
A video analysis was performed to investigate the operator effect on CCS accuracy. The assessment based on data for operator 2 included six cycles (26, 29, 30, 31, 41, 42) and 165 separate loading movements. The effect of the observed differences in loading behaviour on the CCS output are shown in Fig. 9. Only the number of logs grabbed per loading movement, especially when comparing gripping of a single log and multiple logs, had a significant impact on the output error of the scale (p=0.002). The other parameters, such as gripping point (p=0.210), rotation of logs during loading (p=0.360) and dynamic loading (p=0.318), showed no statistically significant influence.
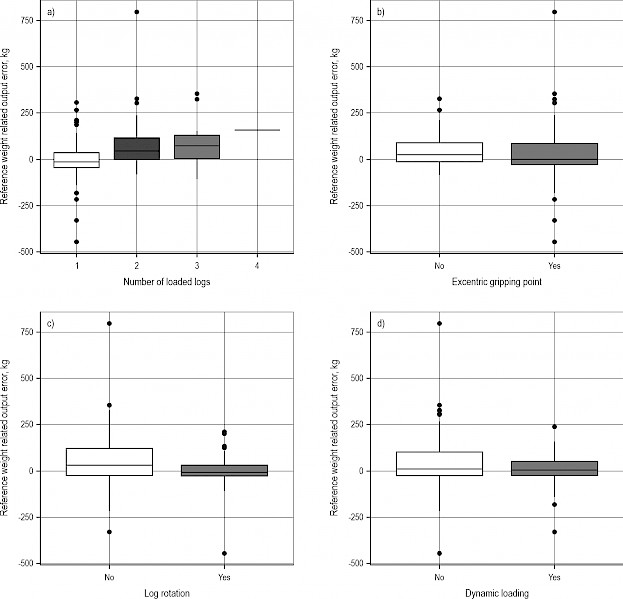
Fig. 9 Effects of loading behaviour on CCS weight-estimation accuracy for the (a) number of logs, grappled, (b) position of the grapple during loading movement, (c) observed rotation of the load while loading and (d) dynamics in the loading process with pendular movement
4. Discussion
The main goal of the study was to develop and test a field-applicable, low-cost weight information system for forwarders to support logistics monitoring of the forwarding process within the timber supply chain. The study showed the potential feasibility of applying such a system with a commercially available telematics system and a connected cloud database. The applied weight-estimation algorithm, which was based on two artificial neural networks for this setup, showed varying results depending on the resolution of observation.
Results related to the determination of the volume conversion factor may contain valuable additional information that could be used for scale applications, i.e. in combination with productivity monitoring (Gullberg 1997, Jiroušek et al. 2007, Eriksson and Lindroos 2014, Manner 2015). The observed average green density of 906 kg m-3 (SEM=13.63 kg m-3, n=77) showed a good normal distribution for all observations. When previously infested bark-beetle logs (and other tree species) can additionally be separated, for example with supportive information systems (Geiger et al. 2020), measurements with a SEM of 1.3% are possible. This low SEM, together with an RMSE of 1.2% as simulated conversion error goes in accordance with the findings of Hultnäs (2013), who predicted the green density of Norway spruce pulpwood in Sweden with similar findings. The assumption that the wood densities of highly water-saturated logs with a water content of up to 60%, as noted in Fortuin (2006), vary less than for dried logs because of the higher impact of the dried density distribution requires further attention, but may explain the small errors found for average green densities.
The observed green densities contradict the findings of Landesbetrieb Landesforsten Rheinland-Pfalz (2017, 800 kg m-3 for spruce), which highlights the necessity of obtaining more accurate conversion factors. One possible approach for providing more suitable tables was presented by the Natural Resource Institute Finland (Luke 2015), where density ranges are related to other influencing factors, which considerably enhance the accuracy for dried assortments in the case of this study (<1% difference in comparison to the dried bark-beetle assortments).
The drying rates of 0.16% per day are below the accuracy of simple monitoring systems and thus may not be considered for shorter observation periods, given that the microclimate effects of air humidity, temperature (Tiţă et al. 2019) and precipitation effects like snow (+2% observed weight gain) do not exceed the observed parameters.
Using the adopted scale algorithms in a cloud application proved to be technically feasible and provided evaluable results. Thus, the tested CCS system can potentially be used for various application cases where the temporal resolution of a remotely setup cloud information system fits the application type. The system must thus be assessed for either single-unit error or long-term observation error with a higher number of repetitions. For the former, the RMSE is a suitable reference value, as single high errors are emphasised in its calculation and so become visible. For long-term observation purposes, the SEM serves as performance indicator for the grouping possibility considering the average error development.
In this study, a low SEM of the scale for single loading movements on large sample sizes (1.3–1.5%) and for whole-forwarder loads (1.6%, best weight reference, 5.1%, real mass reference) was observed. These results confirm the suitability of the system for long-term observations, where the error of single values is not separately considered.
The use of a fitted volume-conversion factor is especially valuable. With this method, the scale accuracy resulted in an overall error of 5.4 kg per moved log (1.5%) or 270.9 kg (3%) for a full forwarder load observation (SEM). This offers the possibility to, for example, use the CCS in combination with a general but locally fitted volume reference for time studies with a higher number of observations.
However, conventional scale errors are exclusively related to single observations (Petty and Melkas 2013). In this case, the CCS setup shows strong limitations in comparison to conventional systems. In contrast to the laboratory accuracies (Geiger et al. 2019), the error of the scale (real-weight reference) under real working conditions and the different data-collection setup resulted in a much higher RMSE of 57.9 kg or 15.3% (n=95) for loading movements. When increasing the number of observations and using the volume-conversion factor instead of the measured real weights, the single-log error rose to 119.5 kg (33.2%, n=440). Even when using the more accurate volume-conversion factor, the uncertainty of the output remained relatively large at 89.7 kg (27%, n=440) for one loading movement.
As a result of the averaging effect, the values for whole forwarder load observations became more reliable, depending on the reference value. When the general volume conversion is enhanced by considering previously bark-beetle infested stems with the accordingly smaller green densities, the RMSE could be almost halved (10.6%) compared to the general volume conversion for all assortments (19.9%) for whole loads. The algorithm thus achieved the same accuracy as the real mass reference, obtained with the reference scale (10.7%), and is thus more suitable for full-load characterisation.
Video analysis showed that log weights calculated from the CCS are generally overestimated with shorter log length in relation to the smaller diameters (average of 18.3 cm of 3 m logs towards 28.5 cm for 4 m and 5 m logs). This trend is also visible in Fig. 4, where a subsample was drawn in the small diameter range and the results suggest a trade-off between density and diameter. This is in accordance with the diameter-related densities of the Finnish wood trade guidelines (Natural Resource Institute Finland (Luke), 2015) and was previously described for dry densities by Repola (2006). When this effect is considered by excluding the 3 m log forwarding cycles, the RMSE of the dataset decreased by 4.9–6.6% (general volume – best reference conversion) for full forwarder loads.
The observed parameters log rotation, dynamic loading and gripping point showed no significant influence on the scale accuracy (Fig. 9) and underlines the basic robustness of the system. However, it was noticed that the single errors tend to decrease with higher variation in the loading movement.
Overall, the scale setup showed itself to be less accurate in the field than in the laboratory test by Geiger et al. (2019).The calculations with the ANN make a distinct separation of influencing parameters difficult. The nature of log-pile manipulation under real working conditions could be one reason. Further, catching of branches or logs could have affected the algorithm output, but may not have been discovered in the video analysis. Another problem could be found in influencing factors on the technical equipment related to cloud functionality and the reduced data frequency. The signal delays, which appeared during the data-logging task, may be there for increasing the output error in some cases, but in an unknown manner. With the higher processing power of more modern telematics systems, these errors may become increasingly negligible in future applications. With additional and differently applied types of this crane scale in terms of hardware and ANN setups, behaviour schemes of the crane scale type will help to separate influencing factors in the functionality of the scale and will help to further characterise and improve the concept.
5. Conclusions
This study showed the feasibility of implementing a cloud-data based crane scale layout to collect forwarding information during the loading phases in a self-contained manner. It proved possible to execute the ANN algorithm on a previously generated low-resolution database with satisfying results.
An initial assessment of the CCS accuracy for both long-term and single-load observations could be provided. The low SEM of 1.5% indicated that long-term observation is possible, both in terms of weight and volume, in case of the latter when local green wood densities are known. The repeated observation of low error levels together with the stability of the system regarding external influences emphasizes the potential usability of the system. It could support established systems by, for example, creating a wider database of green densities, or machine or operator performance evaluations to support contractors.
To be considered a reliable single-log information source, the CCSs observed RMSE of 15.3% may be too large. Based on individual forwarding cycles, the forwarding progress can be described with an RMSE of 11% (SEM 5.1% for real-weight reference). In cases where the aim is to employ the system in legally binding applications like truckload surveillance or as a trade base, the system currently cannot be considered accurate enough. As a basic information source for fleet management systems and as a supporting data source, however, it may present an alternative to existing systems (crane scale), albeit with limitations.
Acknowledgments
This project has received funding from the European Union’s Horizon 2020 research and innovation programme under grant agreement No 727883.
6. References
Bodelschwingh, E., 2006: Analyse der Rundholzlogistik in der DeutschenForst- und Holzwirtschaft: Ansätzefüreinübergreifendes Supply Chain Management [Analysis of roundwood logistics in the German forestry and timber industry: approaches for a comprehensive supply chain management]. Dissertation, TU München, Wissenschaftszentrum Weihenstephan für Ernährung, Landnutzung und Umwelt, Munich 21.02.2006., 1 –214.
Brown, M., Ghaffarian, M.R., 2016: Timber Truck Payload Management with Different In-Forest Weighing Strategies in Australia. Croat. J. For. Eng. 37(1): 131–138.
Devineau, G., Moutarde, F., Xi, W., Yang, J., 2018: Deep Learning for Hand Gesture Recognition on Skeletal Data. In: 2018 13th IEEE International Conference, 15.05.–19.05., 106–113.
Eriksson, M., Lindroos, O., 2014: Productivity of harvesters and forwarders in CTL operations in northern Sweden based on large follow-up datasets. Int. J. For. Eng. 25(3): 179–200. http://dx.doi.org/10.1080/14942119.2014.974309
FAO, 2005: New_LocClim: Local Climate Estimator. FAO. Available online: http://www.fao.org/land-water/land/land-governance/land-resources-planning-toolbox/category/details/en/c/1032167/ (accessed 01.09.2020)
Fortuin, G., 2003: Anwendung mathematischer Modelle zur Beschreibung der technischen Konvektionstrocknung von Schnittholz. [Application of mathematical models to describe the technical convection drying of sawn timber]. Dissertation, University Hamburg, Department of Biology, Hamburg, 15.08.2003., 1–258.
Geiger, C., Maier, N., Kalinke, F., Geimer, M., 2020: Assistance system for an automated log-quality and assortment estimation based on data-driven approaches using hydraulic signals of forestry machines. 12th International Fluid Power Conference – Dresden, Technical University Dresden, Germany, https://doi.org/10.25368/2020.8
Geiger, C., Geimer, M., 2017: Efficiency Optimisation of a Forestry Crane by Implement Hydraulics with Energy Recovery. VDI–MEG – 75th International Conference on Agricultural Engineering – LAND.TECHNIK AgEng 2017 – The Forum for Agricultural Engineering Innovations, Hannover, Germany, 10.–11. November, https://doi.org/10.5445/IR/1000077237
Geiger, C., Greff, D., Starke, M., Geimer, M., 2019: Entwicklung und Evaluation eines Wiegesystems für Forstkräne auf Basis von künstlichenneuronalen Netzen [Development and evaluation of a weighing system for forestry cranes based on artificial neural networks]. LANDTECHNIK 74(5): 102–119. https://doi.org/10.15150/lt.2019.3213
Geiger, C., Starke M., Greff, D., Ziesak, M., Geimer, M., 2018: The Potential of a Weight Detection System for Forwarders using an Artificial Neural Network. Proceedings of 51st Symposium on Forest Mechanization – FORMEC »Improved Forest Mechanisation: mobilizing natural resources and preventing wildfires«, Madrid, Spain, September 25–27, 157–164.
Greff, D., 2019: Investigating the development of a dynamic weighing system for forestry machines: using a data driven approach. Master Thesis, Karlsruhe Institute of Technology, Department of Mechanical Engineering, Institute of Vehicle System Technology, Institute of Mobile Machines, Karlsruhe.
Gross, W., Lange, S., Bödecker, J., Blum, M., 2017: Predicting Time Series with Space-Time Convolutional and Recurrent Neural Networks. In: ESANN 2017 proceedings, European Symposium on Artificial Neural Networks, Computational Intelligence and Machine Learning, Bruges, Belgium, 71–76.
Gullberg, T., 1997: A Deductive Time Consumption Model for Loading Shortwood. J. For. Eng. 8(1): 35–44.
Heinimann, H.R., 1999: Logistik der Holzproduktion — Stand und Entwicklungsperspektiven [Logistics in timber production – state-of-the-art and perspectives]. Forstw.Cbl. 118: 24–38. https://doi.org/10.1007/BF02768971
HSM Construction, 2018: HSM 208F 10t 2020. Data sheet.
HSM Hohenloher Spezial- Maschinenbau GmbH und Co. KG, 2015: Gebrauchsmusterschrift DE 20 2014 006 861 U1 [Registered design DE 20 2014 006 861 U1].
Hultnäs, M., Nylinder, M., Ågren, A., 2013: Predicting the green density as a means to achieve the volume of Norway spruce. Scand. J. For. Res. 28(3): 257–265. https://doi.org/10.1080/02827581.2012.735697
Jiroušek, R., Klvač, R., Skoupý, A., 2007: Productivity and costs of the mechanised cut-to-length wood harvesting system in clear-felling operations. J. For. Sci. 53(10): 476–482.
John Deere, 2019: Timber Matic Maps and Timber Manager. Available online: https://www.deere.co.uk/en/forestry/timbermatic-manager/ (accessed 29.08.2020)
Kern, 2017: Kern HTS_A: Operating manual Electronic Crane Scales. Version 3.3, Data sheet.
Komatsu, 2019: MaxiVision: Take production planning to a whole new level. Available online: https://www.komatsuforest.com/services/maxivision (accessed 15.08.2019).
Landesbetrieb Landesforsten Rheinland-Pfalz, 2017: Holzvermessungsanweisung: HVA [Wood measurementinstructions]. Version 2.2, 26.07.2017.
Lindblad, J., Äijälä, O., Koistinen, A., 2013: Energiapuunmittaus [Energy wood measurement]. Publication of the Forestry Development Center Tapio and the Finnish Forest Research Institute. Available online: http://www.metla.fi/julkaisut/isbn/978-952-5694-28-4/energiapuun-mittausopas-2013.pdf (accessed 20.08.2019).
Manner, J., 2015: Automatic and experimental methods to studying forwarding work. Acta Universitatis agriculturae Sueciae, 128, Department of Forest Biomaterials and Technology, Swedish University of Agricultural Sciences, Umeå, Sweden, 1–71.
Manner, J., Palmroth, L., Nordfjell, T., Lindroos, O., 2016: Load level forwarding work element analysis based on automatic follow-up data. Silva Fennica 50(3): article id 1546. https://doi.org/10.14214/sf.1546
Natural Resource Institute Finland (Luke), 2015: Puutavaranmittaukseenliittyvistäyleisistämuuntoluvuista [General conversion figures related to timber measurement]. Available online: https://www.luke.fi/wp-content/uploads/2019/01/Luonnonvarakeskuksen-maarays-puutavaran-mittaukseen-liittyvista-yleisista-muuntoluvuista_FI_22122017.pdf (accessed 29.08.2020)
Petty, A., 2014: Opportunities for cost mitigation and efficiency improvements through rationalization of small-diameter energy wood supply chains. Dissertationes Forestales 175, Department of Forest Sciences Faculty of Agriculture and Forestry University of Helsinki, 1–47. http://dx.doi.org/10.14214/df.175
Petty, A., Melkas, T., 2013: Crane scale accuracy: A case study on timber truck and forwarder crane scale measurement. Available online: http://www.metsateho.fi/wp-content/uploads/2015/02/Tuloskalvosarja_2013_06b_Crane_scale_accuracy_apetty_tm.pdf (accessed 26.06.2018)
PONSSE, 2019: PONSSE Forwarder Systems. Available online: https://www.ponsse.com/products/information-systems/product#/forwarder_systems (accessed 15.08.2019)
Purfürst, F.T., 2010: Learning Curves of Harvester Operators. Croat. J. For. Eng. 31(2): 89–97.
Repola, J., 2006: Models for Vertical Wood Density of Scots Pine, Norway Spruce and Birch Stems, and Their Application to Determine Average Wood Density. Silva Fennica 40(4): 673–685. https://doi.org/10.14214/sf.322
Sächsisches Landesamt für Umwelt, Landwirtschaft und Geologie (LfULG), 2019: Agrarmeteorologisches Messnetz Sachsen – Wetterdaten [Agriculturalmeteorologicalmeasuring network Saxony – weatherdata]. Available online: https://www.landwirtschaft.sachsen.de/Wetter09/asp/inhalt.asp?seite=twerte (accessed 03.09.2019)
R Development Core Team, 2020. R: A language and environment for statistical computing. R Foundation for Statistical Computing. Vienna, Austria. Available online: https://cran.r-project.org/ (accessed 23.04.2020)
Tiţă, G.C., Marcu, M.V., Ignea, G., Borz, S.A., 2019: Near the forest road: Small changes in air temperature and relative humidity in mixed temperate mountainous forests. Transp. Res. Part D: Transport and Environment (74): 82–92. https://doi.org/10.1016/j.trd.2019.07.016
Appendix
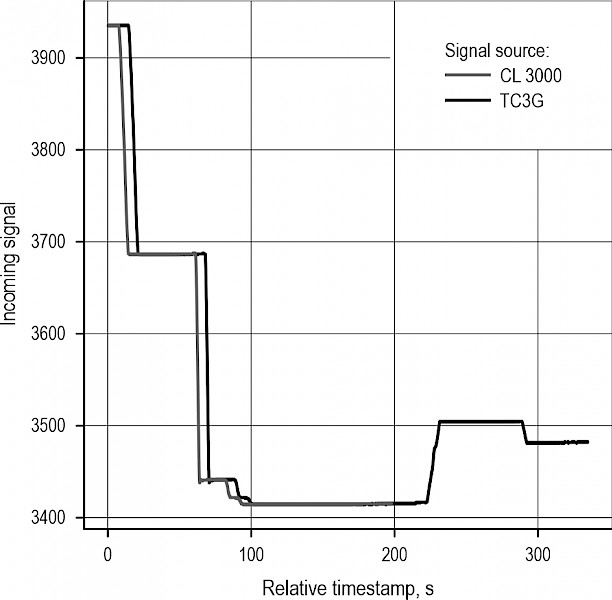
Fig. A1 Tolerated, characteristically varying signal delay between cloud-data setup (black) and raw signal recording (grey)
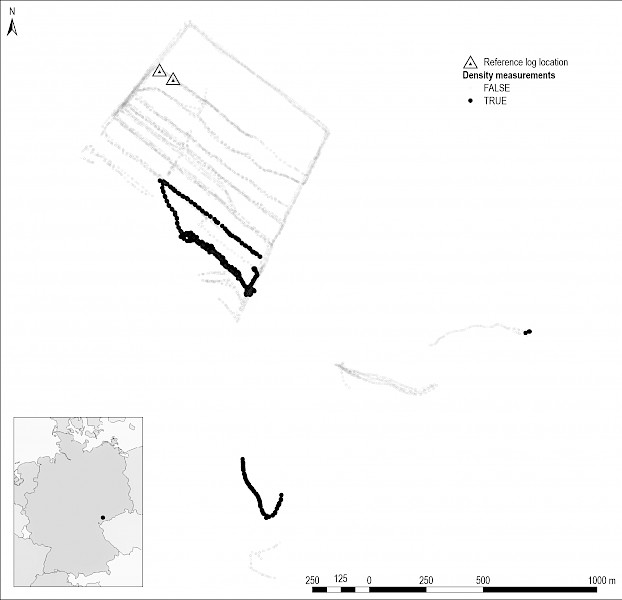
Fig. A2 Study site location in eastern Germany (centre at lat. 50.486°, long. 12.488°) showing recorded forwarder movement (grey) during testing period, with separated »Var. 5« loading cycle extend (black) where weight references for density measurements are taken. Furthermore, the reference log locations of »Group A« (west) and »Group B« (east) are visualised for observations of density change over time
Table A1 Characteristics of observed logs (over time) containing diameter [cm], length [m] and mean weight and density of observed values
|
Group A |
Group B |
|||||||||
|
Log 1 |
Log 2 |
Log 3 |
Log 4 |
Log 5 |
Log 6 |
Log 7 |
Log 8 |
Log 9 |
Log 10 |
|
|
Diameter, cm |
25.5 |
29 |
36.5 |
33.5 |
30 |
28 |
38 |
38.5 |
39.5 |
38.5 |
|
Length, m |
5.14 |
4.08 |
4.11 |
4.10 |
5.11 |
4.15 |
4.15 |
4.08 |
4.09 |
4.07 |
|
Mean weight, kg |
244 |
246 |
376 |
338 |
335 |
224 |
393 |
355 |
415 |
415 |
|
Mean density, kg m-3 |
929 |
912 |
875 |
937 |
927 |
878 |
836 |
747 |
827 |
876 |
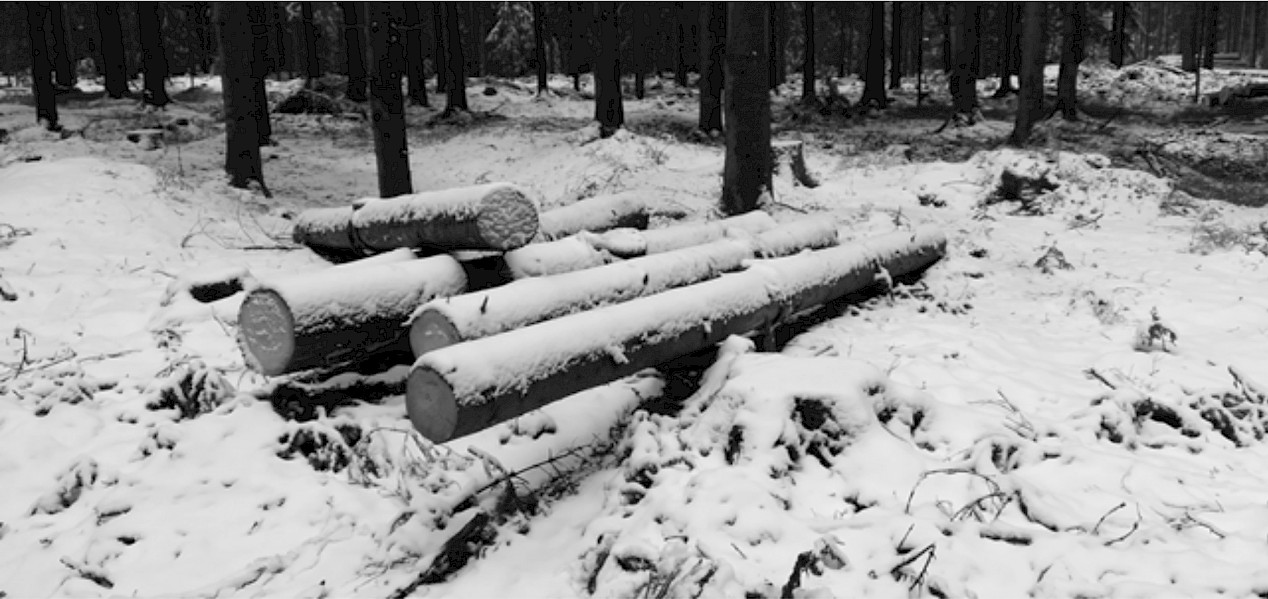
Fig. A3 Group A of reference stems storage for observing weight development over 18-day logging period, recorded on 27 March 2019 after night snowfall
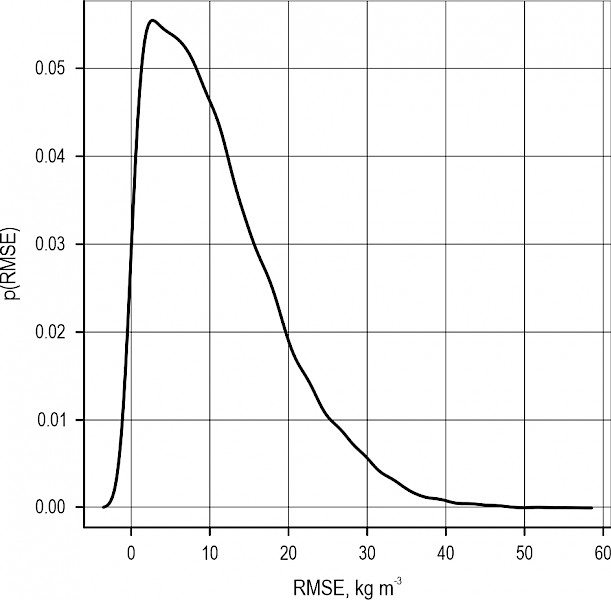
Fig. A4 RMSE distribution of observed and predicted green wood densities for spruce (Monte Carlo Simulation with 10.000 simulations, mean=906.2 kg m-3, SD=119.6 kg m-3)
© 2021 by the authors. Submitted for possible open access publication under the
terms and conditions of the Creative Commons Attribution (CC BY) license (http://creativecommons.org/licenses/by/4.0/).
Authors’ addresses:
Michael Starke *
e-mail: michael.starke@bfh.ch
Bern University of Applied Sciences
School of Agricultural, Forest and Food Sciences HAFL
Länggasse 85
3052 Zollikofen
SWITZERLAND
Chris Geiger
e-mail: chris.geiger@kit.edu
Karlsruher Institut für Technologie (KIT)
Institute of Mobile Machines (Mobima)
Rintheimer Querallee 2
76131 Karlsruhe
GERMANY
* Corresponding author
Received: October 5, 2020
Accepted: March 9, 2021
Original scientific paper