
Forest Fire Risk Zone Mapping of Eravikulam National Park in India: A Comparison Between Frequency Ratio and Analytic Hierarchy Process Methods
doi: 10.5552/crojfe.2022.1137
volume: 43, issue:
pp: 22
- Author(s):
-
- Pradeep G.S.
- Danumah Jean Homian
- Nikhil S.
- Prasad Megha K.
- Patel Nilanchal
- Mammen Pratheesh C.
- Rajaneesh A.
- Oniga Valeria-Ersilia
- Ajin R. S.
- Kuriakose Sekhar L.
- Article category:
- Original scientific paper
- Keywords:
- analytical hierarchy process, fire risk zones, frequency ratio, GIS, Western Ghats
Abstract
HTML
Forest fire is one of the most common natural hazards occurring in the Western Ghats region of Kerala and is one of the reasons for forest degradation. This natural disaster causes considerable damage to the biodiversity of this region during the dry fire season. The area selected for the present study, Eravikulam National Park, which is predominantly of grassland vegetation, is also prone to forest fires. This study aims to delineate the forest fire risk zones in Eravikulam National Park using remote sensing (RS) data and geographic information system (GIS) techniques. In the present study, methods such as Analytic Hierarchy Process (AHP) and Frequency Ratio (FR) were used to derive the weights, and the results were compared. We have used seven factors, i.e. land cover types, normalized difference vegetation index, normalized difference water index, slope angle, slope aspect, distance from the settlement, and distance from the road to prepare the fire risk zone map. The area of the prepared risk zone maps is divided into three zones, namely low, moderate, and high. From the study, it was found that the fire occurring in this area is due to natural as well as anthropogenic factors. The prepared forest fire risk zone maps are validated using the fire incidence data for the period from January 2003 to June 2019 collected from the records of the Forest Survey of India. The investigation revealed that 72% and 24% of the fire incidences occurred in the high risk zone of the maps prepared using the AHP and FR methods, respectively, which ascertained the superiority of the AHP method over the FR method for forest fire risk zone mapping. The receiver operating characteristic (ROC) curve analysis gives an area under the ROC curve (AUC) value of 0.767 and 0.567 for the AHP and FR methods, respectively. The risk zone maps will be useful for staff of the forest department, planners, and officials of the disaster management department to take effective preventive and mitigation measures.
Forest Fire Risk Zone Mapping of Eravikulam National Park in India: A Comparison Between Frequency Ratio and Analytic Hierarchy Process Methods
G.S. Pradeep, Jean Homian Danumah, S. Nikhil, Megha K. Prasad, Nilanchal Patel, Pratheesh C. Mammen, A. Rajaneesh, Valeria-Ersilia Oniga, R.S. Ajin, Sekhar L. Kuriakose
Abstract
Forest fire is one of the most common natural hazards occurring in the Western Ghats region of Kerala and is one of the reasons for forest degradation. This natural disaster causes considerable damage to the biodiversity of this region during the dry fire season. The area selected for the present study, Eravikulam National Park, which is predominantly of grassland vegetation, is also prone to forest fires. This study aims to delineate the forest fire risk zones in Eravikulam National Park using remote sensing (RS) data and geographic information system (GIS) techniques. In the present study, methods such as Analytic Hierarchy Process (AHP) and Frequency Ratio (FR) were used to derive the weights, and the results were compared. We have used seven factors, i.e. land cover types, normalized difference vegetation index, normalized difference water index, slope angle, slope aspect, distance from the settlement, and distance from the road to prepare the fire risk zone map. The area of the prepared risk zone maps is divided into three zones, namely low, moderate, and high. From the study, it was found that the fire occurring in this area is due to natural as well as anthropogenic factors. The prepared forest fire risk zone maps are validated using the fire incidence data for the period from January 2003 to June 2019 collected from the records of the Forest Survey of India. The investigation revealed that 72% and 24% of the fire incidences occurred in the high risk zone of the maps prepared using the AHP and FR methods, respectively, which ascertained the superiority of the AHP method over the FR method for forest fire risk zone mapping. The receiver operating characteristic (ROC) curve analysis gives an area under the ROC curve (AUC) value of 0.767 and 0.567 for the AHP and FR methods, respectively. The risk zone maps will be useful for staff of the forest department, planners, and officials of the disaster management department to take effective preventive and mitigation measures.
Keywords: analytical hierarchy process, fire risk zones, frequency ratio, GIS, Western Ghats
1. Introduction
Forests play a vital role in maintaining environmental balance (Jafarzadeh et al. 2017), ecological balance (Alkhatib 2014), conservation and maintenance of soil, watershed and biodiversity (Acharya et al. 2011). This natural resource is often threatened by fires, insect infestations, encroachments, etc. (Kuter et al. 2011). Also, the increased demand for forest products intensifies the pressure on this natural resource (Akay and Şahin 2019). Fires are the most common hazard threatening forests by negatively affecting the sustainable development of ecosystems and wildlife (Sivrikaya et al. 2014). Other negative effects of forest fires include deforestation (Giri and Shrestha 2000), changes in soil physical characteristics (Ekinci 2006), and the release of greenhouse gases (such as CO2, N2O), CO, non-methane organic compounds (NMOC), nitrogen oxides, NH3, and SO2 (Urbanski 2014), all of which influence atmospheric chemistry and affect human and animal health. Forest fires can also contribute to global warming and the extinction of flora and fauna. It also affects the local weather patterns (Alkhatib 2014), alters the aspects of the carbon cycle, and vegetation type and structure (Harper et al. 2018). A global assessment shows that, in the future, climate will have a significant role in driving global fire trends, outweighing direct human influence on fire (both ignition and suppression), a reversal from the situation during the last two centuries (Pechony and Shindell 2010). Forest fires can occur due to natural and anthropogenic causes (Narendran 2001). Anthropogenic causes are subdivided into two categories, namely intentional (deliberate) and unintentional (accidental) causes (Satendra and Kaushik 2014).
In India, most of the forest fires are caused by anthropogenic factors (FSI 2012). The forests in the Western Ghats, a global biodiversity hotspot in India, have been frequently affected by fires. Forest fire events are posing a threat to the grassland ecosystem of the Western Ghats, as they can seriously affect the populations of endangered and endemic species. Furthermore, there are no such fire risk zone maps for this protected area, which is the largest habitat for the Nilgiri Tahr, the endangered mountain goat. The remote and undulating terrain and lack of information on fire-prone areas make management activities more difficult in this region. In order to minimize the impact of forest fires, fire risk zones should be mapped and suitable preventive and mitigation measures should be taken. Thus, fire risk zonation has a pivotal role in the management and conservation of this protected area.
Many researchers (Adab et al. 2013, Dong et al. 2005, Dong et al. 2006, Eugenio et al. 2016, Gheshlaghi et al. 2019, Goldarag et al. 2016, Jaiswal et al. 2002, Mirdeilami et al. 2015, Pradhan et al. 2007, Sivrikaya et al. 2014, Soto 2012, Teodoro and Duarte 2013) have effectively used RS data and GIS techniques to delineate forest fire risk zones. In the Western Ghats region of Kerala, risk zone mapping based on RS data and GIS techniques has been carried out in the Mannarkkad forest division (Ajin et al. 2018), Idukki Wildlife Sanctuary (Ajin et al. 2016a), Thenmala forest division (Veena et al. 2017), Wayanad Wildlife Sanctuary (Vinod et al. 2016), Periyar Tiger Reserve (Ajin et al. 2017b), Achankovil forest division (Ajin et al. 2016c), Chinnar Wildlife Sanctuary (Ajin et al. 2016b), Nemmara forest division (Ajin et al. 2015), Peppara Wildlife Sanctuary (Ajin et al. 2014), and Peechi-Vazhani Wildlife Sanctuary (Ajin et al. 2017a). The heuristic method was employed to delineate the forest fire risk zones in these areas. The AHP method developed by Saaty (1980) has been used by many researchers (Eskandari 2017, Kayet et al. 2018, Nuthammachot and Stratoulias 2019, Sharma et al. 2012, Vadrevu et al. 2010) to delineate forest fire risk zones. This method makes the best decision by reducing complex decisions to a series of comparable pairs and synthesizing the results (El Jazouli et al. 2019). Mahdavi et al. (2012) mapped forest fire risk zones in the Ilam province using the AHP method and GIS. Factors such as slope, elevation, aspect, precipitation, temperature, distance from rivers, distance from roads, and population density were used for the study. Eskandari (2017) prepared the forest fire risk zone map of the Hyrcanian forests in Iran using the fuzzy AHP method and GIS techniques. The parameters they selected were slope, aspect, elevation, distance from river, vegetation type, vegetation density, leaf litter depth, leaf litter moisture, soil texture, soil moisture, temperature, precipitation, relative humidity, wind velocity, distance from road, distance from settlement, and distance from farmland. Few researchers have used the Frequency Ratio (FR) method to delineate fire risk zones (Heidarlou et al. 2014, Pradhan et al. 2007). In this study, we compared a semi-quantitative method like AHP with the FR method, which is still not applied in the present study area. Also, satellite-derived indices such as the Normalized Difference Water Index (NDWI) and the Normalized Difference Vegetation Index (NDVI) are used in this study. NDWI is an indicator of soil wetness, whereas NDVI is an indicator of vegetation density and health, and these indices would significantly modify the fire regime. Therefore, the use of NDVI, NDWI and ROC analysis, together with the field verification and determination of the influential factors through statistical techniques, provides significantly improved characterization of forest fire distribution patterns.
The objectives of our study are to prepare the forest fire risk zone maps of Eravikulam National Park (ENP) in India using the AHP and FR methods, to determine the most influential factors, and to ascertain the prediction capability of both the AHP and FR methods. The factors selected for the study are land cover types, NDVI, NDWI, slope angle, slope aspect, distance from the settlement, and distance from the road.
2. Methods
2.1 Study Area
Eravikulam, the first national park in Kerala, is located in the Devikulam taluk of the Idukki district. This national park lies in the high ranges of the Southern Western Ghats and is a UNESCO World Heritage Site. ENP is bound between longitudes of 77˚0’0” E and 77˚8’0” E and latitudes of 10˚7’0” N and 10˚20’0” N. The ENP spans an area of around 97 km2. This area has a tropical montane climate and the mean monthly minimum temperature is 11.9°C, while the mean monthly maximum temperature is 22.5°C (Sreekumar et al. 2018). The highest peak in the Western Ghats and South India, Anamudi (2695 m), is in this park. The ENP is home to the endangered Nilgiri Tahr (Nilgiritragus hylocrius), Lion-tailed macaque (Macaca silenus), Tiger (Panthera tigris), Nilgiri Sholakili (Sholicola major) and is the habitat of Neelakurinji (Strobilanthes kunthiana), which blooms only once every 12 years. The Nilgiri tahrs, once widespread throughout this Shola grasslands of the Western Ghats, are now reduced to a few scattered populations (Vergis et al. 2011). The other mammals found in ENP are Gaur (Bos gaurus), Indian muntjac (Muntiacus muntjak), Sambar deer (Cervus unicolor), Jungle cat (Felis chaus), Indian wild dog (Cuon alpinus), Leopard (Panthera pardus), Nilgiri langur (Semnopithecus johni), Striped-necked mongoose (Herpestes vitticollis), Indian crested porcupine (Hystrix indica), Nilgiri marten (Martes gwatkinsii), Asian small-clawed Otter (Aonyx cinereus), Leopard cat (Prionailurus bengalensis), Brown palm civet (Paradoxurus jerdoni), Dusky-striped squirrel (Funambulus sublineatus), etc. The bird species include endemics like Black-and-orange Flycatcher (Ficedula nigrorufa), Nilgiri pipit (Anthus nilghiriensis), Nilgiri wood pigeon (Columba elphinstonii), and Nilgiri flycatcher (Eumyias albicaudatus). The location map of the study area is shown in Fig. 1.
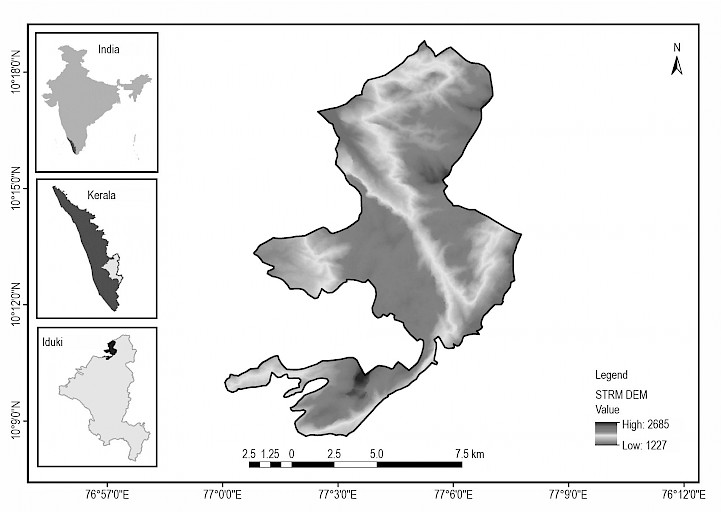
Fig. 1 Location map of Eravikulam National Park
2.2 Data Used
The present study area falls on the Survey of India (SoI) topographic maps numbered 58 F/3 and 58 F/4 at 1:50,000 scale. The data used in this study includes Landsat 8 OLI (Operational land imager) satellite images, SRTM (Shuttle radar topography mission) DEM (Digital elevation model), SoI topographic maps, and Google Earth data (Table 1). The thematic layers of the factors inducing forest fires, such as land cover types, NDVI, NDWI, slope angle, slope aspect, distance from the settlement, and distance from the road, were developed using ArcGIS 10.6 and ERDAS Imagine 8.4 software tools. The accuracy of land cover types classification was assessed using Cohen Kappa analysis (Cohen 1960). The SPSS software (IBM Corp., New York, United States of America) was used to calculate the Kappa coefficient. The thematic layers of factors such as NDVI, NDWI, slope angle, distance from the settlement, and distance from the road were classified using the natural breaks classification method. All thematic layers were resampled to 30 m and then combined using ArcGIS tools after assigning the weights determined by AHP and FR methods to generate the forest fire risk zone maps. The prepared risk zone maps were validated using the fire incidence data for the period from January 2003 to June 2019 collected from the records of the Forest Survey of India (FSI). The RStudio 1.4 software (RStudio, PBC, Massachusetts, United States of America) was used for ROC curve analysis (Bradley 1997) and AUC value (Bradley 1997) estimation. The flowchart of the methods applied is shown in Fig. 2.
Table 1 Data used
|
Dataset |
Source |
Scale/Spatial resolution |
|
Topographic map |
Survey of India |
1: 50,000 |
|
Landsat 8 OLI satellite image |
USGS EarthExplorer (https://earthexplorer.usgs.gov/) |
30 m |
|
SRTM Digital elevation model |
USGS EarthExplorer (https://earthexplorer.usgs.gov/) |
30 m |
|
Fire incidences |
Forest Survey of India (FSI) Forest Fire Alerts System 3.0 (http://117.239.115.41/smsalerts/index.php) |
375 m 1 km |
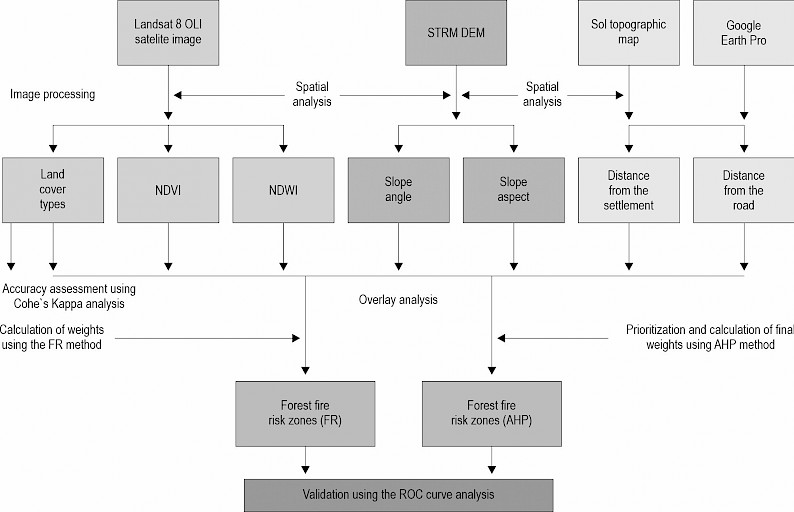
Fig. 2 Flowchart of the methods
2.3 Causative Factors
Land cover types: Combustible materials such as trees, leaves, and grass act as suitable fuels which can initiate fires (Ajin et al. 2018). Forest fires are more likely to occur in areas with dry and thick vegetation (Veena et al. 2017). This is because flames can spread rapidly when fuel is closer. The land cover types in the study area were derived from the Landsat 8 OLI satellite image of 30 m spatial resolution acquired on 13/07/2019. ERDAS Imagine software tools were used for the supervised classification of the satellite image. The maximum likelihood (ML) classification method was applied to classify the different land cover types present in this area. The land cover types in the study area are forest, grassland, and shrubland. In this area, grasslands are more prone to fires as they get dry faster when compared to forests. The amount of moisture in the fuel determines the extent of the fire (Snyder et al. 2006). The land cover types map is shown in Fig. 3.
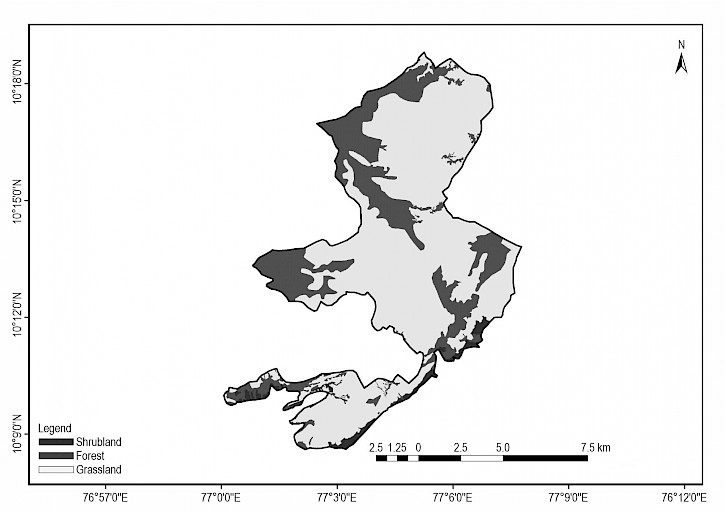
Fig. 3 Land cover types
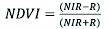
Normalized Difference Vegetation Index (NDVI): NDVI is a dimensionless index used to estimate the vegetation density in an area. The NDVI for the study was derived from the Landsat 8 OLI satellite image and prepared using ArcGIS spatial analyst tools. The NDVI was calculated using Eq. 1 (Rouse et al. 1974) and the value ranged between –1 and +1.
 (1)
(1)
Where:
NIR and R stand for spectral reflectance measurements acquired in the near-infrared and visible regions, respectively.
A higher NDVI value is indicative of dense vegetation, while a lower NDVI value indicates sparse vegetation. The chance of forest fire is higher in areas with dense vegetation. The NDVI of the study area ranges from 0.01 to 0.56. The NDVI map is shown in Fig. 4.

Fig. 4 Normalized difference vegetation index (NDVI)
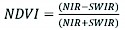
Normalized Difference Water Index (NDWI): NDWI is used to monitor the moisture content in plants and soil and the value varies from –1 to +1. The NDWI for the study was also derived from the Landsat 8 OLI satellite image and prepared using ArcGIS spatial analyst tools. NDWI was calculated using Eq. 2 (Gao 1996).
 (2)
(2)
Where:
NIR and SWIR stand for spectral reflectance measurements acquired in the near-infrared and short-wave near-infrared regions, respectively.
A higher NDWI value corresponds to vegetation and soil with higher moisture content. The chance of forest fire is higher in areas with lower moisture content. The NDWI of the study area ranges from –0.43 to 0.06. The NDWI map is shown in Fig. 5.
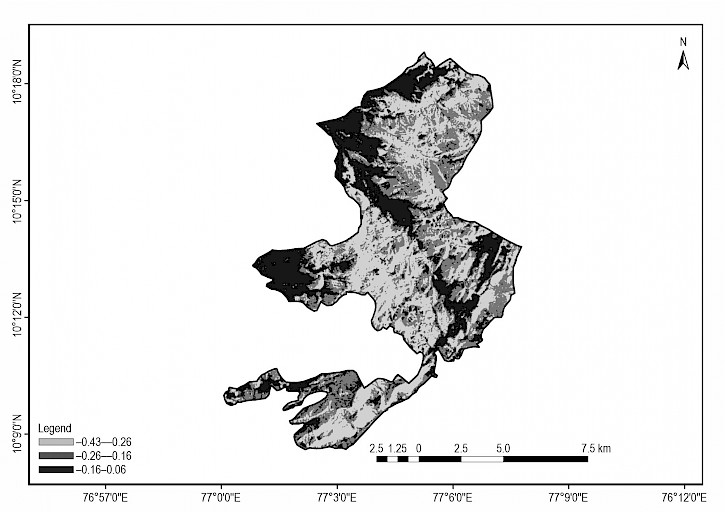
Fig. 5 Normalized difference water index (NDWI)
Slope angle: The slope of the study area was derived from the 20 m interval contour data derived from SRTM DEM of 30 m resolution. ArcGIS spatial analyst and 3D analyst tools were used to prepare the slope of the area. Areas with steeper slopes are subjected to higher surface runoff rates compared to areas with shallow slopes; hence, these areas are drier. Steeper slopes play an important role in the formation of local winds and accelerate the upward migration of fire (Ajin et al. 2017b). Fig. 6 depicts the slope (angle) of the study area, which has been divided into five classes: 0–12.36°, 12.36–20.80°, 20.80–30.45°, 30.45–44.01°, and 44.01–76.88°.
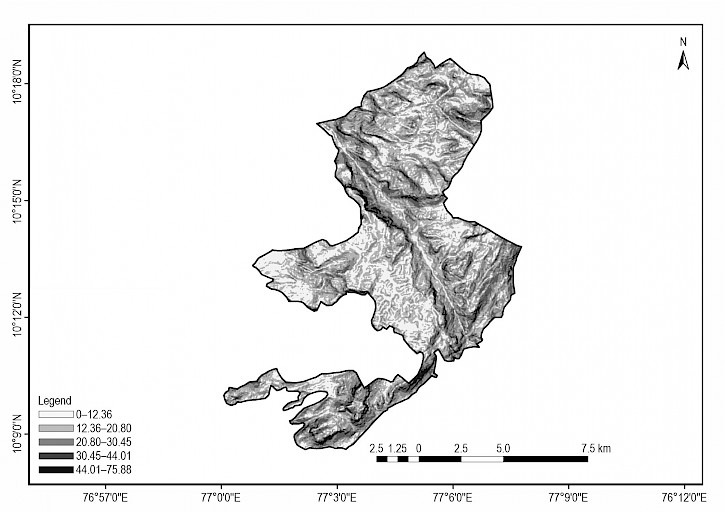
Fig. 6 Slope angle
Slope aspect: The slope aspect can greatly influence the rate of fuel drying and spread of fire (Chuvieco and Congalton 1989). The southern aspects are subjected to greater solar radiation and wind and are thus more prone to fires (Setiawan et al. 2004). The western aspects receive a higher rate of heating compared to the eastern aspects, which receive early heating from the sun (Setiawan et al. 2004). This makes the western slopes more prone to fires compared to the eastern slopes. The aspects of the study area were also derived from the SRTM DEM. Flat, North, Northeast, East, Southeast, South, Southwest, West, and Northwest are the nine classes of the aspect. The slope aspect of the study area is shown in Fig. 7.
Fig. 7 Slope aspect
Distance from the settlement: The Neelakurinji flower and Nilgiri Tahr in ENP are prime attractions for tourists. Thousands of tourists visit the ENP every year. These tourists can cause accidental or unintentional forest fires, mainly by carelessly throwing unextinguished cigarette butts, match sticks, etc. Also, the tribal people may set fire to collect non-timber forest products such as honey. Such fires may sometimes become uncontrollable and lead to wildfires. Therefore, the forests located near settlements are more prone to fires. The settlements were digitized from the SoI topographic maps and Google Earth. The distance from the settlement layer was prepared from the digitized data using ArcGIS spatial analyst tools. The distance of forests from settlements was grouped into five classes, viz. 0–2380 m, 2380–4062 m, 4062–5827 m, 5827–7714 m, and 7714–10464 m. The map showing these classes is depicted in Fig. 8.
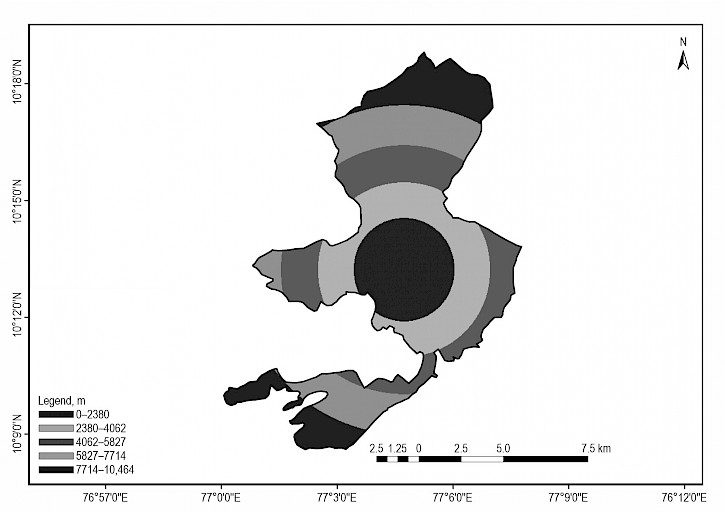
Fig. 8 Distance from the settlement
Distance from the road: Forest areas close to roads are more prone to fires. The movement of tourists and vehicles through forest roads can create intentional or unintentional fires (Veena et al. 2017). Accidental or unintentional fires occur mainly due to careless disposal of burning materials like cigarette butts and match sticks by travelers (Veena et al. 2017). Intentional forest fires occur mainly from fires set to clear the forest path. The road networks were also digitized from the SoI topographic maps and Google Earth. The distance of forests from roads was grouped into five classes viz. 0–784 m, 784–1708 m, 1708–2856 m, 2856–4480 m, and 4480–7141 m. The map showing these classes is depicted in Fig. 9.

Fig. 9 Distance from the road
2.4 AHP Modeling
AHP is an effective tool for dealing with complex decision making. It checks the consistency of the evaluations and thus reduces bias in the decision-making process. In the AHP model, a 1–9 scale (Table 2) is used for constructing judgment matrices. The major steps involved in AHP modeling are the development of a pairwise comparison matrix, calculation of the Eigen vector and weighting coefficient, and finally, the calculation of the consistency ratio (Table 3 and 4).
Table 2 Saaty Rating Scale (Saaty 1980)
|
Intensity of Scale |
Definition |
Explanation |
|
1 |
Equal importance |
Two factors contribute equally to the objective |
|
3 |
Somewhat more important |
Experience and judgment slightly favor one over the other |
|
5 |
Much more important |
Experience and judgment strongly favor one over the other |
|
7 |
Very much more important |
Experience and judgment very strongly favor one over the other |
|
9 |
Absolutely more important |
The evidence favoring one over the other is of the highest possible validity |
|
2, 4, 6, 8 |
Intermediate values |
When compromise is needed |
Table 3 Pairwise comparison matrix
|
LCT |
NDVI |
NDWI |
Slope |
Aspect |
DS |
DR |
Vp |
Cp |
|
|
LCT |
1 |
2 |
3 |
5 |
6 |
7 |
9 |
3.80 |
0.37 |
|
NDVI |
1/2 |
1 |
2 |
3 |
5 |
6 |
7 |
2.51 |
0.25 |
|
NDWI |
1/3 |
1/2 |
1 |
3 |
3 |
5 |
7 |
1.76 |
0.17 |
|
Slope |
1/5 |
1/3 |
1/3 |
1 |
2 |
3 |
5 |
0.94 |
0.09 |
|
Aspect |
1/6 |
1/5 |
1/3 |
1/2 |
1 |
2 |
3 |
0.61 |
0.06 |
|
DS |
1/7 |
1/6 |
1/5 |
1/3 |
1/2 |
1 |
3 |
0.41 |
0.04 |
|
DR |
1/9 |
1/7 |
1/7 |
1/5 |
1/3 |
1/3 |
1 |
0.24 |
0.02 |
|
SUM |
2.45 |
4.34 |
7.01 |
13.03 |
17.83 |
24.33 |
35 |
10.25 |
1 |
*The Eigen vector (Vp) was calculated using Eq. 3.
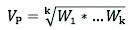 (3)
(3)
Where:
k number of factors
W ratings of factors.
The weighting coefficient (Cp) was calculated using Eq. 4.
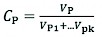 (4)
(4)
Table 4 Normalized matrix
|
LCT |
NDVI |
NDWI |
Slope |
Aspect |
DS |
DR |
∑ of Ranks |
C |
D = A * C |
E = D / C |
λmax |
CI |
CR |
|
|
LCT |
0.4 |
0.46 |
0.43 |
0.37 |
0.34 |
0.29 |
0.26 |
2.56 |
0.37 |
2.62 |
7.08 |
7.15 |
0.025 |
0.02 |
|
NDVI |
0.2 |
0.23 |
0.29 |
0.23 |
0.28 |
0.25 |
0.2 |
1.68 |
0.25 |
1.73 |
6.92 |
|||
|
NDWI |
0.14 |
0.12 |
0.14 |
0.23 |
0.17 |
0.21 |
0.2 |
1.21 |
0.17 |
1.08 |
6.35 |
|||
|
Slope |
0.08 |
0.08 |
0.05 |
0.08 |
0.1 |
0.12 |
0.14 |
0.65 |
0.09 |
0.64 |
7.11 |
|||
|
Aspect |
0.07 |
0.05 |
0.05 |
0.04 |
0.06 |
0.08 |
0.09 |
0.44 |
0.06 |
0.41 |
6.83 |
|||
|
DS |
0.06 |
0.04 |
0.03 |
0.03 |
0.03 |
0.04 |
0.09 |
0.32 |
0.04 |
0.29 |
7.25 |
|||
|
DR |
0.05 |
0.03 |
0.02 |
0.02 |
0.02 |
0.01 |
0.03 |
0.18 |
0.02 |
0.17 |
8.50 |
|||
|
∑ |
1 |
1 |
1 |
1 |
1 |
1 |
1 |
7.03 |
1 |
– |
50.04 |
The matrix was normalized by dividing each element by the sum of the columns. The priority vector (C) was determined by averaging each line. The overall priority (D) was determined by multiplying each column of the matrix by the corresponding priority vector. The rational priority (E) was determined by dividing each overall priority by the priority vector.
The Eigen value (λmax) was determined using Eq. 5.
 (5)
(5)
The consistency index (CI) was calculated using Eq. 6.
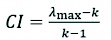 (6)
(6)
The consistency ratio (CR) was determined using Eq. 7.
 (7)
(7)
Where:
RI random index.
Table 5 Random index (Saaty 1980)
|
Number of criteria |
2 |
3 |
4 |
5 |
6 |
7 |
8 |
9 |
10 |
11 |
|
RI |
0.00 |
0.58 |
0.90 |
1.12 |
1.24 |
1.32 |
1.41 |
1.45 |
1.49 |
1.51 |
According to Saaty (1980), CR should be less than 0.1, otherwise the judgements are untrustworthy and the exercises should be repeated. In this study, CR is 0.02 (which is less than 0.1), hence the judgements are reliable.
The final weights were obtained through AHP method and is shown in Eq. 8:
 (8)
(8)
Where:
LCT land cover types
DS distance from the settlement
DR distance from the road.
2.5 Frequency Ratio Method
The frequency ratio method is based on the concept of the favorability function (Chung and Fabbri 1999). The spatial relationships between the occurrence locations and each factor contributing to their occurrence can be derived using the frequency ratio model (Pradhan et al. 2007). The frequency ratio for each class of the factors was calculated by dividing the fire occurrence ratio by the area ratio (Vijith and Madhu 2008). When the value is greater than one, it indicates a stronger correlation, and when it is less than one, it indicates a weaker correlation (Pradhan et al. 2007). The frequency ratio of each factor and its classes are shown in Table 6. Finally, the fire risk zones were derived by adding the factors as shown in Eq. 9.
 (9)
(9)
Where:
LCT land cover types
DS distance from the settlement
DR distance from the road.
Table 6 Frequency ratio of factors
|
Thematic layer |
Class |
Number of pixels in the class |
Class, % |
Number of fire points within the class |
Fire points, % |
Frequency ratio |
|
Land cover types |
Shrubland |
33,049 |
27.48 |
1 |
4 |
0.14 |
|
Grassland |
84,136 |
69.96 |
20 |
80 |
1.14 |
|
|
Forest |
3079 |
2.56 |
4 |
16 |
6.25 |
|
|
NDVI |
0.01–0.25 |
51,040 |
42.44 |
10 |
40 |
0.94 |
|
0.25–0.35 |
32,039 |
26.64 |
8 |
32 |
1.20 |
|
|
0.35–0.56 |
37,185 |
30.92 |
7 |
28 |
0.90 |
|
|
NDWI |
-0.43– -0.26 |
44,726 |
37.19 |
11 |
44 |
1.18 |
|
-0.26– -0.16 |
39,952 |
33.22 |
10 |
40 |
1.20 |
|
|
-0.16–0.06 |
35,586 |
29.59 |
4 |
16 |
0.54 |
|
|
Slope angle |
0–12.36 |
28,863 |
24.00 |
5 |
20 |
0.83 |
|
12.36–20.80 |
41,047 |
34.13 |
9 |
36 |
1.05 |
|
|
20.80–30.45 |
30,908 |
25.70 |
5 |
20 |
0.77 |
|
|
30.45–44.01 |
15,610 |
12.98 |
3 |
12 |
0.92 |
|
|
44.01–76.88 |
3836 |
3.19 |
3 |
12 |
3.76 |
|
|
Slope aspect |
Flat |
0 |
0.00 |
0 |
0 |
0.00 |
|
North |
14,794 |
12.30 |
3 |
12 |
0.97 |
|
|
Northeast |
10,980 |
9.13 |
2 |
8 |
0.87 |
|
|
East |
12,028 |
10.00 |
5 |
20 |
2.00 |
|
|
Southeast |
15,131 |
12.58 |
5 |
20 |
1.59 |
|
|
South |
16,549 |
13.76 |
2 |
8 |
0.58 |
|
|
Southwest |
18,186 |
15.12 |
3 |
12 |
0.79 |
|
|
West |
15,468 |
12.86 |
2 |
8 |
0.62 |
|
|
Distance from the settlement, m |
0–2380 |
20,221 |
16.81 |
2 |
8 |
0.47 |
|
2380–4062 |
28,338 |
23.57 |
6 |
24 |
1.02 |
|
|
4062–5827 |
27,093 |
22.53 |
11 |
44 |
1.95 |
|
|
5827–7714 |
24,404 |
20.29 |
1 |
4 |
0.20 |
|
|
7714–10464 |
20,208 |
16.80 |
5 |
20 |
1.19 |
|
|
Distance from the road, m |
0–784 |
42,224 |
35.11 |
8 |
32 |
0.91 |
|
784–1708 |
35,190 |
29.26 |
5 |
20 |
0.68 |
|
|
1708–2856 |
22,561 |
18.76 |
6 |
24 |
1.28 |
|
|
2856–4480 |
12,166 |
10.11 |
3 |
12 |
1.18 |
|
|
4480–7141 |
8123 |
6.76 |
3 |
12 |
1.77 |
2.6 Accuracy Assessment of Land Cover Classification Using Cohen’s Kappa Coefficient
The accuracy of the land cover classification was assessed using Cohen’s Kappa coefficient (Cohen 1960). In classification, Kappa is used as a measure of agreement between the classes observed and the classes predicted or inferred for the test dataset cases (Delgado and Tibau 2019). The Kappa coefficient was calculated using Eq. 10 (Sim and Wright 2005). The values of Kappa and the corresponding level of agreement are shown in Table 7. For the accuracy assessment, 23 points were collected randomly using a handheld GPS during the field visit. The SPSS software was used to assess the Kappa coefficient.
 (10)
(10)
Where:
Po proportion of observed agreements
Pc proportion of agreements expected by chance.
Table 7 Interpretation of Cohen’s Kappa (McHugh 2012)
|
Value of Kappa |
Level of agreement |
% of data that are reliable |
|
0–0.20 |
None |
0–4% |
|
0.21–0.39 |
Minimal |
4–15% |
|
0.40–0.59 |
Weak |
15–35% |
|
0.60–0.79 |
Moderate |
35–63% |
|
0.80–0.90 |
Strong |
64–81% |
|
Above 0.90 |
Almost perfect |
82–100% |
2.7 Validation of Fire Risk Zone Map Using ROC Analysis
The fire risk zone map was validated using the fire incidence data collected from the records of FSI. The RStudio software was used for the ROC curve analysis to test the classification accuracy. AUC, a scalar value, measures the binary classifier overall performance (Hanley and McNeil 1982). When the AUC equals 0.5, it is indeed a random chance, and indicates perfect accuracy when the AUC equals 1.0. (Zou et al. 2007). The AUC was found to be excellent for values above 0.9, good for values between 0.8–0.9, fair for values between 0.7–0.8, poor for values between 0.6–0.7, and failed for values between 0.5–0.6 (Lüdemann et al. 2006).
3. Results and Discussion
In the present study, RS data, GIS techniques and the AHP and FR methods were used to delineate forest fire risk zones in ENP. Factors such as land cover types, NDVI, NDWI, slope angle, slope aspect, distance from the settlement, and distance from the road have been used for risk zone mapping. The Kappa coefficient for the land cover types classification is 0.927, which is almost a perfect value (Table 8 and 9). The area of the forest fire risk zone maps was divided into low, moderate, and high-risk zones (Table 10 and 11). The prepared forest fire risk zone maps are shown in Fig. 10 and Fig. 11. A total of 25 fire incidences were recorded during the period selected for the study. These fire incidence points were overlaid on the forest fire risk zone maps to validate the results. It was found that 18 (72%) and 6 (24%) fire points spatially fell over the high-risk zone of the maps prepared using the AHP and FR methods, respectively. This ascertains the efficacy of the AHP method over the FR method. According to this study, most of the fire incidences (80%) have occurred in the grasslands. Surface moisture plays a vital role in fire occurrence. This was ascertained after analyzing the number of fires found in areas with lower NDWI values. It was found that the majority of the fires occurred in these areas. A considerable number of fires (32%) occurred close to the forest roads. This observation is evidence of its anthropogenic origin. The areas located far away from settlements and roads were also affected by fires. The various inferences drawn from the investigation confirm the role of both natural and human-induced factors in the occurrence of fire in the study area. The ROC curve analysis gives an AUC value of 0.767 and 0.567 for the AHP and FR methods, respectively (Fig. 12). The ROC curve analysis for the AHP method gives a fair value, but it fails with the FR method. In their study conducted in Melghat Tiger Reserve Forest (India), Kayet et al. (2018) found that both the AHP and FR methods are effective in delineating forest fire risk zones. This confirms that the FR method is not suitable for the forest fire risk zonation of this area. Therefore, AHP was selected as the reliable method for forest fire risk zonation in the study area.
Table 8 Theoretical error matrix of LCT classification
|
LCT classification |
Total |
Correct sample |
||||
|
Forest |
Grassland |
Shrubland |
||||
|
GPS points |
Forest |
6 |
0 |
0 |
6 |
6 |
|
Grassland |
0 |
12 |
0 |
12 |
12 |
|
|
Shrubland |
0 |
1 |
4 |
5 |
4 |
|
|
Total |
6 |
13 |
4 |
23 |
22 |
|
Table 8 shows the relationship between ground truth data and the corresponding classified data obtained through error matrix report.
The overall classification accuracy (Rwanga and Ndambuki 2017) = (Number of correct points)/(Total number of points) = 22/23 = 95.65%.
Table 9 Cohen’s Kappa measures
|
Value |
Asymptotic standard errora |
Approximate Tb |
Approximate significance |
|
|
Measure of agreement – Kappa |
0.927 |
0.071 |
6.106 |
0.000 |
|
No. of valid cases |
23 |
– |
– |
– |
|
a – Not assuming the null hypothesis; b – Using the asymptotic standard error assuming the null hypothesis |
||||
Table 10 Area and percentage of risk zones and fire incidence details – AHP Method
|
Forest fire risk zones |
Area, km2 |
Percentage of the area of the risk zones |
No. of fire incidences |
Percentage of fire incidences |
|
Low |
23.22 |
23.93 |
3 |
12 |
|
Moderate |
45.03 |
46.43 |
4 |
16 |
|
High |
28.75 |
29.64 |
18 |
72 |
|
Total |
97 |
100 |
25 |
100 |
Table 11 Area and percentage of risk zones and fire incidence details – FR Method
|
Forest fire risk zones |
Area, km2 |
Percentage of the area of the risk zones |
No. of fire incidences |
Percentage of fire incidences |
|
Low |
65.51 |
67.54 |
13 |
52 |
|
Moderate |
16.32 |
16.82 |
6 |
24 |
|
High |
15.17 |
15.64 |
6 |
24 |
|
Total |
97 |
100 |
25 |
100 |
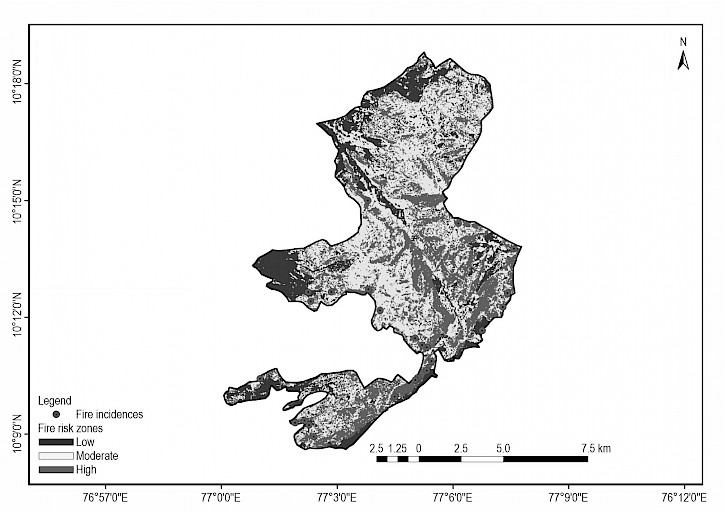
Fig. 10 Forest fire risk zones – AHP Method
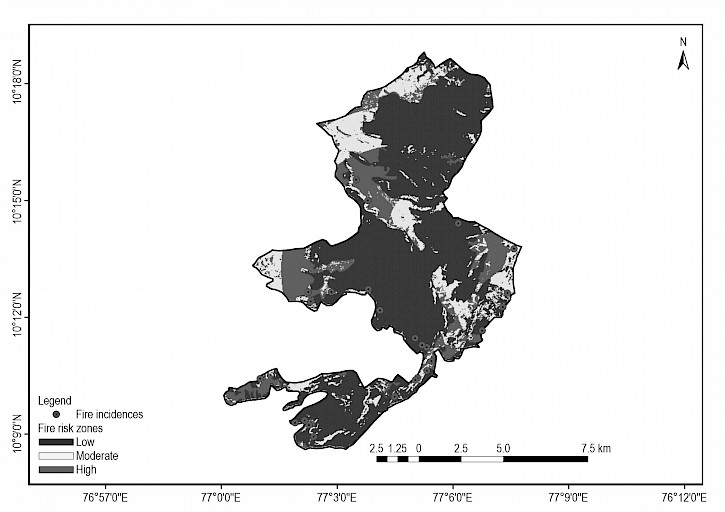
Fig. 11 Forest fire risk zones – FR Method
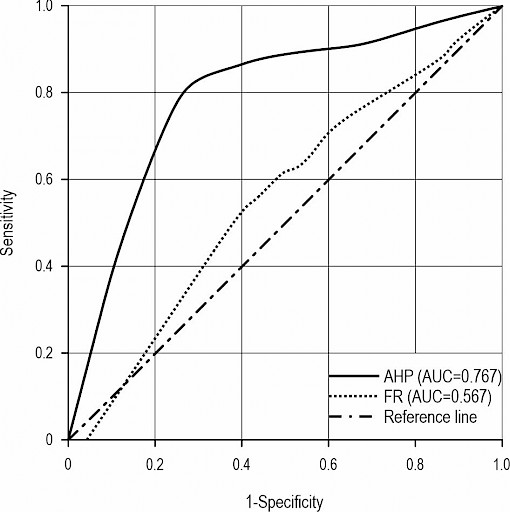
Fig. 12 AUC curves for AHP and FR methods
ENP is home to endangered and endemic flora and fauna like the Nilgiri tahr, Nilgiri marten, Rhododendron nilgiricum and Strobilanthes spp. There is no other fire risk zone map available for this protected area, and no studies have previously examined the influence of different factors on fire initiation in ENP. The present study demarcated the fire risk zones in ENP using geospatial tools and performed a comparison between the AHP and FR methods. The fire risk zone map prepared using the FR method does not give accurate results when compared to the AHP method. This is because of the higher FR value (6.25) obtained for the class »Forest«.
Novo et al. (2020) compared the frequency ratio and AHP models for forest fire risk mapping in Galicia (Spain). They assigned higher weights to vegetation followed by topographic factors (slope, aspect) and lower weights to anthropogenic factors (proximity to roads and settlements). Also, the AHP weightings of the present study are consistent with the study by Suryabhagavan et al. (2016), as higher weight was given to vegetation type, followed by slope, aspect, settlement, and road. NDVI was selected by many researchers (Akbulak et al. 2018, Gheshlaghi et al., 2019, Novo et al., 2020) for forest fire risk zone mapping. Van Hoang et al. (2020) and Eskandari and Miesel (2017) selected proximity to the stream/river as a factor for mapping forest fire risk zones in NW Vietnam. In this study, NDWI was used instead of proximity to a river/stream, as it represents moisture in both plants and soil. Balaguru et al. (2018) considered NDWI to delineate the forest fire risk zones in Kurangani.
The results of this study can be improved by including climatic parameters. Eskandari (2017) and Eskandari and Miesel (2017) used climatic parameters such as temperature, precipitation, relative humidity, and wind velocity in their studies to demarcate forest fire risk zones in the Hyrcanian forests of Iran. However, due to the non-availability of an adequate number of weather stations within this area, it was not possible to include the climate data. This is a limitation of the study.
4. Conclusions
The Western Ghats region, one of the global biodiversity hotspots, is highly prone to forest fires, especially in the grassland ecosystem and deciduous forests. The Mukurthi national park in Tamil Nadu and the Eravikulam national park in Kerala are two prominent protected areas conserving the montane grasslands and the evergreen Shola forests. The Nilgiri tahr demands special attention because the Shola grasslands gained conservation priority only because of their presence. Therefore, the identification of risk zones and mapping are essential to preventing and combating forest fires. In this study, the fire risk zone maps were prepared using the AHP and FR methods, and the area was classified into low, moderate, and high-risk zones. The most influencing factor for forest fires is NDWI, followed by aspect and distance from the road. The investigation demonstrated the efficacy of the AHP method in predicting forest fire occurrences in comparison to the frequency ratio method. We observed that the AHP method is superior to the FR method because the AUC value difference is 0.2, i.e. the fire risk zones delineated by the AHP method are 20% more accurate than those derived by employing the FR method. The study ascertained that the fires occurring in this area are the result of natural causes as well as anthropogenic factors. The prepared map will help foresters, scientists, and officials of the disaster management department to take effective mitigation measures to minimize the incidence of fire.
Acknowledgments
The authors are thankful to Dr. Ashraf Dewan, Senior Lecturer, Department of Spatial Sciences, Curtin University, Australia, and to the anonymous reviewers for providing constructive comments that helped to improve the quality of the manuscript.
5. References
Acharya, K.P., Dangi, R.B., Acharya, M., 2011: Understanding forest degradation in Nepal. Unasylva 62(2): 31–38.
Adab, H., Kanniah, K.D., Solaimani, K., 2013: Modeling forest fire risk in the northeast of Iran using remote sensing and GIS techniques. Natural Hazards 65(3): 1723–1743. https://doi.org/10.1007/s11069-012-0450-8
Ajin, R.S., Ciobotaru, A.M., Vinod, P.G., Jacob, M.K., 2015: Forest and wildland fire risk assessment using geospatial techniques: A case study of Nemmara forest division, Kerala, India. Journal of Wetlands Biodiversity 5: 29–37.
Ajin, R.S., Jacob, M.K., Menon, A.R.R., Vinod, P.G., 2014: Forest fire risk analysis using geo-information technology: A study of Peppara Wildlife Sanctuary, Thiruvananthapuram, Kerala, India. In Proceedings of the 2nd Disaster Risk Vulnerability Conference 2014 (DRVC-2014); Pradeepkumar, A.P., Behr, F.J., Illiyas, F.T., Shaji, E., Eds.; Thiruvananthapuram, India: 160–165.
Ajin, R.S., Loghin, A.M., Jacob, M.K., Vinod, P.G., Krishnamurthy, R.R., 2016a: The risk assessment of potential forest fire in Idukki Wildlife Sanctuary using RS and GIS techniques. International Journal of Advanced Earth Science and Engineering 5(1): 308–318.
Ajin, R.S., Loghin, A.M., Vinod, P.G., Jacob, M.K., 2016b: Forest fire risk zone mapping in Chinnar Wildlife Sanctuary, Kerala, India: A study using geospatial tools. Journal of Global Resources 3: 16–26.
Ajin, R.S., Loghin, A.M., Vinod, P.G., Jacob, M.K., 2016c: Forest fire risk zone mapping using RS and GIS techniques: A study in Achankovil forest division, Kerala, India. Journal of Earth, Environment and Health Sciences 2(3): 109–115. https://doi.org/10.4103/2423-7752.199288
Ajin, R.S., Loghin, A.M., Vinod, P.G., Jacob, M.K., 2017a: Mapping of forest fire risk zones in Peechi-Vazhani Wildlife Sanctuary, Thrissur, Kerala, India: A study using geospatial techniques. Journal of Wetlands Biodiversity 7: 7–16.
Ajin, R.S., Loghin, A.M., Vinod, P.G., Jacob, M.K., 2017b: The risk analysis of potential forest fires in a Wildlife Sanctuary in the Western Ghats (Southwest Indian Peninsula) using geospatial techniques. International Journal of Health System and Disaster Management 5(1): 18–23. https://doi.org/10.4103/ijhsdm.ijhsdm_26_16
Ajin, R.S., Loghin, A.M., Vinod, P.G., Menon, A.R.R., Jacob, M.K., 2018: Forest fire risk assessment using geospatial techniques: A study in Mannarkkad forest division of Palakkad district, Kerala, India. ECOTERRA - Journal of Environmental Research and Protection 15(1): 1–9.
Akay, A.E., Şahin, H., 2019: Forest fire risk mapping by using GIS techniques and AHP method: A case study in Bodrum (Turkey). European Journal of Forest Engineering 5(1): 25–35. https://doi.org/10.33904/ejfe.579075
Akbulak, C., Tatli, H., Aygün, G., Sağlam, B., 2018: Forest fire risk analysis via integration of GIS, RS and AHP: The case of Çanakkale, Turkey. Journal of Human Sciences, 15(4): 2127–2143. https://doi.org/10.14687/jhs.v15i4.5491
Alkhatib, A.A.A., 2014: A review on forest fire detection techniques. International Journal of Distributed Sensor Networks 10(3): 597368. http://dx.doi.org/10.1155/2014/597368
Balaguru, M., Navammuniyammal, M., Vidhya, R., Sathyavathi, G., 2018: Assessing forest fire prone area in Kurangani, Tamilnadu using remote sensing & GIS. International Journal of Applied Engineering Research 13(7): 264–269.
Bradley, A.P., 1997: The use of the area under the ROC curve in the evaluation of machine learning algorithms. Pattern Recognition 30(7): 1145–1159. https://doi.org/10.1016/S0031-3203(96)00142-2
Chung, C.F., Fabbri, A., 1999: Probabilistic prediction models for landslide hazard mapping. Photogrammetric Engineering & Remote Sensing 65(12): 1389–1399.
Chuvieco, E., Congalton, R.G., 1989: Application of remote sensing and geographic information systems to forest fire hazard mapping. Remote Sensing of Environment 29(2): 147–159. https://doi.org/10.1016/0034-4257(89)90023-0
Cohen, J., 1960: A coefficient of agreement for nominal scales. Educational and Psychological Measurement 20(1): 37–46. https://doi.org/10.1177/001316446002000104
Delgado, R., Tibau, X.A., 2019: Why Cohen’s Kappa should be avoided as performance measure in classification. PLoS ONE 14(9). https://doi.org/10.1371/journal.pone.0222916
Dong, X., Li-min, D., Guo-fan, S., Lei, T., Hui, W., 2005: Forest fire risk zone mapping from satellite images and GIS for Baize Forestry Bureau, Jilin, China. Journal of Forestry Research 16(3): 169–174. https://doi.org/10.1007/BF02856809
Dong, X., Shao, G.F., Limin, D., Zhanqing, H., Lei, T., Hui, W., 2006: Mapping forest fire risk zones with spatial data and principal component analysis. Science in China: Series E Technological Sciences 49 (Supp. I): 140–149. https://doi.org/10.1007/s11434-006-8115-1
Ekinci, H., 2006: Effect of forest fire on some physical, chemical and biological properties of soil in Çanakkale, Turkey. International Journal of Agriculture & Biology 8(1): 102–106.
El Jazouli, A., Barakat, A., Khellouk, R., 2019: GIS-multicriteria evaluation using AHP for landslide susceptibility mapping in Oum Er Rbia high basin (Morocco). Geoenvironmental Disasters 6(1): 1–12. https://doi.org/10.1186/s40677-019-0119-7
Eskandari, S., 2017: A new approach for forest fire risk modeling using fuzzy AHP and GIS in Hyrcanian forests of Iran. Arabian Journal of Geosciences 10(8): 190. https://doi.org/10.1007/s12517-017-2976-2
Eskandari, S., Miesel, J.R., 2017: Comparison of the fuzzy AHP method, the spatial correlation method, and the Dong model to predict the fire high-risk areas in Hyrcanian forests of Iran. Geomatics, Natural Hazards and Risk 8(2): 933–949. https://doi.org/10.1080/19475705.2017.1289249
Eugenio, F.C., dos Santos, A.R., Fiedler, N.C., Ribeiro, G.A., da Silva, A.G., dos Santos, A.B., Paneto, G.G., Schettino, V.R., 2016: Applying GIS to develop a model for forest fire risk: A case study in Espírito Santo, Brazil. Journal of Environmental Management 173: 65–71. https://doi.org/10.1016/j.jenvman.2016.02.021
FSI 2012: Vulnerability of India’s forests to fires. Forest Survey of India, Ministry of Environment, Forest & Climate Change, Government of India, Dehradun.
Gao, B.C., 1996: NDWI-A normalized difference water index for remote sensing of vegetation liquid water from space. Remote Sensing of Environment 58(3): 257–266. https://doi.org/10.1016/S0034-4257(96)00067-3
Gheshlaghi, H.A., Feizizadeh, B., Blaschke, T., 2019: GIS-based forest fire risk mapping using the analytical network process and fuzzy logic. Journal of Environmental Planning and Management 63(3): 481–499. https://doi.org/10.1080/09640568.2019.1594726
Giri, C., Shrestha, S., 2000: Forest fire mapping in Huay Kha Khaeng Wildlife Sanctuary, Thailand. International Journal of Remote Sensing 21(10): 2023–2030. https://doi.org/10.1080/01431160050021268
Goldarag, Y.J., Mohammadzadeh, A., Ardakani, A.S., 2016: Fire risk assessment using neural network and logistic regression. Journal of the Indian Society of Remote Sensing 44(6): 885–894. https://doi.org/10.1007/s12524-016-0557-6
Hanley, J.A., McNeil, B.J., 1982: The meaning and use of the area under a receiver operating characteristic (ROC) curve. Radiology 143(1): 29–36. http://dx.doi.org/10.1148/radiology.143.1.7063747
Harper, A.R., Doerr, S.H., Santin, C., Froyd, C.A., Sinnadurai, P., 2018: Prescribed fire and its impacts on ecosystem services in the UK. Science of the Total Environment 624: 691–703. https://doi.org/10.1016/j.scitotenv.2017.12.161
Heidarlou, H.B., Shafiei, A.B., Erfanian, M., 2014: Forest fire risk mapping using analytical hierarchy process technique and frequency ratio method (Case study: Sardasht Forests, NW Iran). Iranian Journal of Forest and Poplar Research 22(4): 559–572.
Jafarzadeh, A.A., Mahdavi, A., Jafarzadeh, H., 2017: Evaluation of forest fire risk using the Apriori algorithm and fuzzy c-means clustering. Journal of Forest Science 63(8): 370–380. https://doi.org/10.17221/7/2017-JFS
Jaiswal, R.K., Mukherjee, S., Raju, K.D., Saxena, R., 2002: Forest fire risk zone mapping from satellite imagery and GIS. International Journal of Applied Earth Observation and Geoinformation 4(1): 1–10. https://doi.org/10.1016/S0303-2434(02)00006-5
Kayet, N., Chakrabarty, A., Pathak, K., Sahoo, S., Dutta, T., Hatai, B.K., 2020: Comparative analysis of multi-criteria probabilistic FR and AHP models for forest fire risk (FFR) mapping in Melghat Tiger Reserve (MTR) forest. Journal of Forestry Research 31(2): 565–759. https://doi.org/10.1007/s11676-018-0826-z
Kuter, N., Yenilmez, F., Kuter, S., 2011: Forest fire risk mapping by Kernel density estimation. Croatian Journal of Forest Engineering 32(2): 599–610.
Lüdemann, L., Grieger, W., Wurm, R., Wust, P., Zimmer, C., 2006: Glioma assessment using quantitative blood volume maps generated by T1-weighted dynamic contrast-enhanced magnetic resonance imaging: A receiver operating characteristic study. Acta Radiologica 47(3): 303–310. https://doi.org/10.1080/02841850500539033
Mahdavi, A., Shamsi, S.R.F., Nazari, R., 2012: Forests and rangelands’ wildfire risk zoning using GIS and AHP techniques. Caspian Journal of Environmental Sciences 10(1): 43–52.
McHugh, M.L., 2012: Interrater reliability: the kappa statistic. Biochemia Medica 22(3): 276–282. https://doi.org/10.11613/BM.2012.031
Mirdeilami, T., Shataee, S.H., Kavoosi, M.R., 2015: Forest fire risk zone mapping in the Golestan National Park using regression logistic method. Journal of Wood and Forest Science and Technology 22(1): 1–16.
Narendran, K., 2001: Forest fires: Origins and ecological paradoxes. Resonance 6(11): 34–41. http://dx.doi.org/10.1007/BF02868242
Novo, A., Fariñas-Álvarez, N., Martínez-Sánchez, J., González-Jorge, H., Fernández-Alonso, J.M., Lorenzo, H., 2020: Mapping forest fire risk—A case study in Galicia (Spain). Remote Sensing 12(22). https://doi.org/10.3390/rs12223705
Nuthammachot, N., Stratoulias, D., 2019: A GIS- and AHP-based approach to map fire risk: a case study of Kuan Kreng peat swamp forest, Thailand. Geocarto International 36(2): 212–225. https://doi.org/10.1080/10106049.2019.1611946
Pechony, O., Shindell, D.T., 2010: Driving forces of global wildfires over the past millennium and the forthcoming century. Proceedings of the National Academy of Sciences 107(45): 19167–19170. https://doi.org/10.1073/pnas.1003669107
Pradhan, B., Suliman, M.D.H.B., Awang, M.A.B., 2007: Forest fire susceptibility and risk mapping using remote sensing and geographical information systems (GIS). Disaster Prevention and Management 16(3): 344–352. https://doi.org/10.1108/09653560710758297
Rouse, J.W., Haas, R.H., Schell, J.A., Deering, D.W., 1974: Monitoring vegetation systems in the Great Plains with ERTS. In Proceedings of the Third Earth Resources Technology Satellite-1 Symposium; Freden, S.C., Mercanti, E.P., Becker, M.A., Eds.; NASA: Washington, D.C, USA, Volume I: 309–317.
Rwanga, S.S., Ndambuki, J.M., 2017: Accuracy assessment of land use/land cover classification using remote sensing and GIS. International Journal of Geosciences 8(4): 611–622. https://doi.org/10.4236/ijg.2017.84033
Saaty, T.L., 1980: The analytic hierarchy process: planning, priority setting, resource allocation (Decision making series). McGraw Hill, New York.
Satendra Kaushik, A.D., 2014: Forest fire disaster management. National Institute of Disaster Management, Ministry of Home Affairs, Government of India: New Delhi.
Setiawan, I., Mahmud, A.R., Mansor, S., Shariff, A.R.M., Nuruddin, A.A., 2004: GIS-grid-based and multi-criteria analysis for identifying and mapping peat swamp forest fire hazard in Pahang, Malaysia. Disaster Prevention and Management 13(5): 379–386. https://doi.org/10.1108/09653560410568507
Sharma, L.K., Kanga, S., Nathawat, M.S., Sinha, S., Pandey, P.C., 2012: Fuzzy AHP for forest fire risk modeling. Disaster Prevention and Management 21(2): 160–171. https://doi.org/10.1108/09653561211219964
Sim, J., Wright, C.C., 2005: The Kappa statistic in reliability studies: use, interpretation, and sample size requirements. Physical Therapy 85(3): 257–268. https://doi.org/10.1093/ptj/85.3.257
Sivrikaya, F., Sağlam, B., Akay, A.E., Bozali, N., 2014: Evaluation of forest fire risk with GIS. Polish Journal of Environmental Studies 23(1): 187–194.
Snyder, R.L., Spano, D., Duce, P., Baldocchi, D., Xu, L., Paw, K.T.U., 2006: A fuel dryness index for grassland fire-danger assessment. Agricultural and Forest Meteorology 139(1–2): 1–11. https://doi.org/10.1016/j.agrformet.2006.05.006
Soto, M.E.C., 2012: The identification and assessment of areas at risk of forest fire using fuzzy methodology. Applied Geography 35(1–2): 199–207. https://doi.org/10.1016/j.apgeog.2012.07.001
Sreekumar, E.R., Nikhil, S., Ajay, K.G., Nameer, P.O., 2018: Diversity and endemism of butterflies of montane forests of Eravikulam National Park in the Western Ghats, India. Journal of Threatened Taxa 10(9): 12235–12246. https://doi.org/10.11609/jott.4201.10.9.12235-12246
Suryabhagavan, K.V., Alemu, M., Balakrishnan, M., 2016: GIS-based multi-criteria decision analysis for forest fire susceptibility mapping: a case study in Harenna forest, southwestern Ethiopia. Tropical Ecology 57(1): 33–43.
Teodoro, A.C., Duarte, L., 2013: Forest fire risk maps: a GIS open source application – a case study in Norwest of Portugal. International Journal of Geographical Information Science 27(4): 699–720. https://doi.org/10.1080/13658816.2012.721554
Urbanski, S., 2014: Wildland fire emissions, carbon, and climate: Emission factors. Forest Ecology and Management 317: 51–60. http://dx.doi.org/10.1016/j.foreco.2013.05.045
Vadrevu, K.P., Eaturu, A., Badarinath, K.V.S., 2010: Fire risk evaluation using multicriteria analysis-a case study. Environmental Monitoring and Assessment 166(1–4): 223–239. https://doi.org/10.1007/s10661-009-0997-3
Van Hoang, T., Chou, T.Y., Fang, Y.M., Nguyen, N.T., Nguyen, Q.H., Xuan Canh, P., Ngo Bao Toan, D., Nguyen, X.L., Meadows, M.E., 2020: Mapping forest fire risk and development of early warning system for NW Vietnam using AHP and MCA/GIS methods. Applied Sciences 10(12): 4348. https://doi.org/10.3390/app10124348
Veena, H.S., Ajin, R.S., Loghin, A.M., Sipai, R., Adarsh, P., Viswam, A., Vinod, P.G., Jacob, M.K., Jayaprakash, M., 2017: Wildfire risk zonation in a tropical forest division in Kerala, India: A study using geospatial techniques. International Journal of Conservation Science 8(3): 475–484.
Vergis, S., Puyravaud, J.P., Mammen, P.C., Davidar, P., 2011: Survey of isolated populations of the Nilgiri Tahr Nilgiritragus hylocrius (Ogilby) in Kerala, India. Journal of the Bombay Natural History Society 108(1): 8–11.
Vijith, H., Madhu, G., 2008: Estimating potential landslide sites of an upland sub-watershed in Western Ghat’s of Kerala (India) through frequency ratio and GIS. Environmental Geology 55(7): 1397–1405. https://doi.org/10.1007/s00254-007-1090-2
Vinod, P.G., Ajin, R.S., Jacob, M.K., 2016: RS and GIS based spatial mapping of forest fire risk zones in Wayanad Wildlife Sanctuary, North Kerala, India. International Journal of Earth Sciences and Engineering 9(2): 498–502.
Zou, K.H., O’Malley, A.J., Mauri, L., 2007: Receiver-operating characteristic analysis for evaluating diagnostic tests and predictive models. Circulation 115(5): 654–657. https://doi.org/10.1161/CIRCULATIONAHA.105.594929
© 2021 by the authors. Submitted for possible open access publication under the
terms and conditions of the Creative Commons Attribution (CC BY) license (http://creativecommons.org/licenses/by/4.0/).
Authors’ addresses:
G.S. Pradeep
pradeepgsgeo@gmail.com
S. Nikhil
nikx.suresh02@gmail.com
Pratheesh C. Mammen, PhD *
pratheeshcmammen@yahoo.com
R. S. Ajin
ajinares@gmail.com, ajinares@ieee.org
Sekhar L. Kuriakose, PhD
sekhar.lk@gmail.com
Kerala State Disaster Management Authority (KSDMA)
State Emergency Operations Centre
695 033, Thiruvananthapuram
Kerala
INDIA
Jean Homian Danumah, PhD
danumahjean@yahoo.fr
Université Félix Houphouët-Boigny
Centre Universitaire de Recherche et d'Application en Télédétection (CURAT)
00225 Abidjan
IVORY COAST
Megha K. Prasad
meghakprasad99@gmail.com
Bharathidasan University
School of Earth Sciences
Department of Remote Sensing
620 024, Tiruchirappalli
Tamil Nadu
INDIA
Nilanchal Patel, PhD
nilanchal.patel@gmail.com, npatel@bitmesra.ac.in
Birla Institute of Technology, Mesra
Department of Remote Sensing
835 215, Ranchi
Jharkhand
INDIA
A. Rajaneesh
rajaneesh90@gmail.com
University of Kerala
Kariavattom Campus
Department of Geology
695 581, Thiruvananthapuram
Kerala
INDIA
Valeria-Ersilia Oniga, PhD
ersilia.oniga@tuiasi.ro
Gheorghe Asachi Technical University of Iași
Faculty of Hydrotechnical Engineering, Geodesy and Environmental Engineering
Department of Terrestrial Measurements and Cadastre
700050 Iași
ROMANIA
* Corresponding author
Received: August 11, 2020
Accepted: April 19, 2021
Original scientific paper