
Fuel Consumption, Greenhouse Gas Emissions, and Energy Efficiency of Wood-Harvesting Operations: A Case Study of Stora Enso in Finland
doi: 10.5552/crojfe.2022.1101
volume: 43, issue:
pp: 21
- Author(s):
-
- Haavikko Hanna
- Kärhä Kalle
- Poikela Asko
- Korvenranta Mika
- Palander Teijo
- Article category:
- Original scientific paper
- Keywords:
- greenhouse gas (GHG) emissions, carbon dioxide equivalent (CO2 eq.), carbon neutrality, logging, roundwood, forest machines, engine power, machine relocations
Abstract
HTML
The EU’s climate and energy framework and Energy Efficiency Directive drive European companies to improve their energy efficiency. In Finland, the aim is to achieve carbon neutrality by 2035. Stora Enso Wood Supply Finland (WSF) had a target, by 2020, to improve its energy efficiency by 4% from the 2015 level. This case study researches the use of the forest machine fleet contracted to Stora Enso WSF. The aims were to 1) clarify the forest machine fleet energy-efficiency as related to the engine power; 2) determine the fuel consumption and greenhouse gas (GHG) emissions from wood-harvesting operations, including relocations of forest machines by trucks; and 3) investigate the energy efficiency of wood-harvesting operations. The study data consisted of Stora Enso WSF’s industrial roundwood harvest of 8.9 million m3 (solid over bark) in 2016. The results illustrated that forest machinery was not allocated to the different cutting methods (thinning or final felling) based on the engine power. The calculated fuel consumption totalled 14.2 million litres (ML) for harvesting 8.9 million m3, and the calculated fuel consumption of relocations totalled 1.2 ML, for a total of 15.4 ML. The share of fuel consumption was 52.5% for harvesters (cutting), 39.5% for forwarders (forest haulage), and 8.0% for forest machine relocations. The average calculated cubic-based fuel consumption of wood harvesting was 1.6 L/m3, ranging from the lowest of 1.2 L/m3 for final fellings to the highest of 2.8 L/m3 in first thinnings. The calculated fuel consumption from machine relocations was, on average, 0.13 L/m3. The calculated carbon dioxide equivalent (CO2 eq.) emissions totalled 40,872 tonnes (t), of which 21,676 t were from cutting, 16,295 t were from forwarding, and 2,901 t from relocation trucks. By cutting method, the highest calculated CO2 eq. emissions were recorded in first thinnings (7340 g CO2 eq./m3) and the lowest in final fellings (3140 g CO2 eq./m3). The calculated CO2 eq. emissions in the forest machine relocations averaged 325 g CO2 eq./m3. The results underlined that there is a remarkable gap between the actual and optimal allocation of forest machine fleets. Minimizing the gap could result in higher work productivity, lower fuel consumption and GHG emissions, and higher energy efficiency in wood-harvesting operations in the future.
Fuel Consumption, Greenhouse Gas Emissions, and Energy Efficiency of Wood-Harvesting Operations: A Case Study of Stora Enso in Finland
Hanna Haavikko, Kalle Kärhä, Asko Poikela, Mika Korvenranta, Teijo Palander
Abstract
The EU’s climate and energy framework and Energy Efficiency Directive drive European companies to improve their energy efficiency. In Finland, the aim is to achieve carbon neutrality by 2035. Stora Enso Wood Supply Finland (WSF) had a target, by 2020, to improve its energy efficiency by 4% from the 2015 level. This case study researches the use of the forest machine fleet contracted to Stora Enso WSF. The aims were to 1) clarify the forest machine fleet energy-efficiency as related to the engine power; 2) determine the fuel consumption and greenhouse gas (GHG) emissions from wood-harvesting operations, including relocations of forest machines by trucks; and 3) investigate the energy efficiency of wood-harvesting operations. The study data consisted of Stora Enso WSF’s industrial roundwood harvest of 8.9 million m3 (solid over bark) in 2016. The results illustrated that forest machinery was not allocated to the different cutting methods (thinning or final felling) based on the engine power. The calculated fuel consumption totalled 14.2 million litres (ML) for harvesting 8.9 million m3, and the calculated fuel consumption of relocations totalled 1.2 ML, for a total of 15.4 ML. The share of fuel consumption was 52.5% for harvesters (cutting), 39.5% for forwarders (forest haulage), and 8.0% for forest machine relocations. The average calculated cubic-based fuel consumption of wood harvesting was 1.6 L/m3, ranging from the lowest of 1.2 L/m3 for final fellings to the highest of 2.8 L/m3 in first thinnings. The calculated fuel consumption from machine relocations was, on average, 0.13 L/m3. The calculated carbon dioxide equivalent (CO2 eq.) emissions totalled 40,872 tonnes (t), of which 21,676 t were from cutting, 16,295 t were from forwarding, and 2,901 t from relocation trucks. By cutting method, the highest calculated CO2 eq. emissions were recorded in first thinnings (7340 g CO2 eq./m3) and the lowest in final fellings (3140 g CO2 eq./m3). The calculated CO2 eq. emissions in the forest machine relocations averaged 325 g CO2 eq./m3. The results underlined that there is a remarkable gap between the actual and optimal allocation of forest machine fleets. Minimizing the gap could result in higher work productivity, lower fuel consumption and GHG emissions, and higher energy efficiency in wood-harvesting operations in the future.
Keywords: greenhouse gas (GHG) emissions, carbon dioxide equivalent (CO2 eq.), carbon neutrality, logging, roundwood, forest machines, engine power, machine relocations
1. Introduction
In the 2020s, climate change is one of the biggest issues in the world. Human activities are estimated to have caused approximately 1.0°C of global warming above pre-industrial levels, with a likely range of 0.8°C to 1.2°C because of greenhouse gas (GHG) emissions – among others carbon dioxide (CO2), methane (CH4), and nitrous oxide (N2O) (Masson-Delmotte et al. 2018). Furthermore, the IPCC forecasts that global warming is likely to reach 1.5°C between 2030 and 2052 if it continues to increase at the current rate (Masson-Delmotte et al. 2018). Globally, human GHG emissions were over 36 billion tonnes of carbon dioxide equivalent (CO2 eq.) in 2018 (World Economic Forum 2019). In this respect, the EU’s GHG emissions totalled 4483 million tonnes of CO2 eq., the lowest level since 1990 (European Commission 2019). In fact, GHG emissions were 23% below the 1990 level, while gross domestic product in the EU area had increased by 61%. The EU’s climate and energy framework (European Union 2014) has set three challenging targets for 2030: 1) decrease GHG emissions by at least 40%, 2) increase share of renewable energy sources (RESs) by at least 27%, and 3) improve energy efficiency by at least 27% from the 1990 level. There is an even more ambitious target for 2050: to cut GHG emissions 80% below the 1990 level (European Union 2011).
In Finland, a plan announced by the country’s new coalition government states an aim for carbon neutrality by 2035 (Finnish Government 2020). In 2018, the GHG emissions totalled 56.4 million tonnes of CO2 eq., a 21% decrease compared to the 1990 level in Finland (Official Statistics of Finland 2019). The main part of the GHG emissions was CO2 (82%). The share of CH4 was 8%, as was the share of N2O, and the share of F gases (i.e. fluorinated GHGs: HFC, PFC compounds, SF6, and NF3) was 2% of the total GHG emissions (Official Statistics of Finland 2019). Correspondingly, the carbon sink of the LULUCF sector (i.e. the land use, land use change and forestry sector) in Finland was –14.2 million tonnes of CO2 eq. in 2018 (Official Statistics of Finland 2019). Regarding the forestry sector, the total use of industrial roundwood was 73.6 million m3 solid over bark (henceforth referred to as m3), of which 64.5 million m3 (88%) came from domestic wood procurement (Ylitalo 2019). On the other hand, the annual increment of growing stock on forest land and on poorly productive forest land totalled 108 million m3 (Ihalainen and Vaahtera 2019), which provided the forest industry with forest stands of 100% renewable wood (Palander et al. 2020). However, on a long-term rotation basis (e.g. 50 years), it is apparent that forests viable carbon sink can only be retained by increasing the country’s forest thinning and final felling. In this respect, wood-harvesting operations have increased too slowly during recent decades (Palander et al. 2020). Therefore, the National Forest Strategy 2025 in Finland has set a goal to increase the amount of industrial roundwood cuttings from the 2013 level (around 65 Mm3) to 80 million m3 by 2025 (Ministry of Agriculture and Forestry 2019).
In 2012, the Energy Efficiency Directive (Directive 2012/27/EU) was launched to implement the targets of the 2030 climate and energy framework in Europe. These targets and energy-efficiency agreements will guide European companies to improve their energy efficiency. Since 2014, the Energy Efficiency Directive has steered the energy-efficiency work in large Finnish companies. This law requires them to set and follow up on their energy-efficiency targets, as well as to hold an energy audit every fourth year (Energiatehokkuuslaki 2014). Stora Enso is one of the companies required to follow up on the provisions of the Energy Efficiency Directive in Finland. Stora Enso’s ambitions are to drive down fossil fuel use so that the company can get as close to zero as possible within the decade using technically and commercially feasible means, and to seek to substitute fossil-based and other non-renewable materials with renewable raw materials and products (Stora Enso 2019). In practice, Stora Enso’s main target is to reduce fossil CO2 and other GHG emissions in its operations (e.g. wood-supply operations) by 31% per tonne of pulp, paper, and board produced by 2030, compared to a 2010 baseline (Stora Enso 2019).
In 2018, the total wood volume supplied by Stora Enso WSF from forests to internal (own) and external mill customers was 23 million m3. Currently, in 2020, wood-procurement services are produced by more than, primarily independent, 300 harvesting systems (i.e. harvesters and forwarders) and approximately 250 timber trucks. The target of Stora Enso WSF was, by 2020, to improve its energy efficiency by 4% from the 2015 level (Stora Enso 2015). It is necessary to improve energy efficiency throughout the company, to provide close cooperation throughout the whole wood-supply chain and to secure more accurate knowledge of the energy efficiency in the supply chain (Haavikko et al. 2019); for instance, accurate and reliable information on the total and average fuel consumption and GHG emissions. To improve energy efficiency in the wood-supply chain, it is crucial that harvesting machines and timber trucks are optimally directed at their tasks; for instance, the harvesting machinery is carefully allocated and utilized in different cutting methods by paying attention to its properties (i.e. engine power, weight of machine, boom reach, carrying capacity of forwarder) and other equipment (e.g. tracks). Forest machines equipped with smaller engine power and lower work productivity should be directed at thinning stands with a smaller stem size of removals, and the larger machines should be directed at final fellings in which more powerful forest machinery is needed because the average size of trees is larger.
In Nordic cut-to-length (CTL) wood-harvesting operations with both harvesters and forwarders, Brunberg et al. (2004), Brunberg (2007, 2013), and Holzleitner et al. (2011) reported that fuel consumption (litres per hour, L/h) depends very strongly on machine size and engine power (kW). Furthermore, Ghaffariyan et al. (2018) pointed out that fuel consumption is impacted by machine design. Jylhä et al. (2019) noted that, currently in Finland, the allocation of wood-harvesting machinery is not completely optimal. In addition to harvesters and forwarders, trucks are used for relocation of machines in wood-harvesting operations. Haavikko et al. (2019) stressed in their forest machine entrepreneur interview survey that forest machine entrepreneurs frequently regard forest machine relocation distances between harvesting sites as one of the most essential factors to energy-efficient wood-harvesting operations. In his relocation truck study, Kauppinen (2010) measured that, when driving a loaded relocation truck, the fuel consumption is, on average, 50 L/100 km, while for an empty relocation truck, the fuel consumption averages 29 L/100 km.
Wildmark (2014) noted that in Sweden, the machine relocation distance (i.e. driving a loaded truck) from one harvesting site to another is, on average, 14 km. In Finland forest machine relocation distance between harvesting sites averages approximately 30 km (Kuitto et al. 1994, Kärhä et al. 2007, Väätäinen et al. 2006, 2008, 2019, Kauppinen 2010, Haavikko et al. 2019), noticeably longer than in Sweden. Kuitto et al. (1994), Väätäinen et al. (2006, 2008) and Kauppinen (2010) indicated that total driving distance for one machine relocation is approximately 70–100 km per forest machine – and further around 140–200 km per harvesting system. Hence, the effect of fuel consumption and GHG emissions caused by forest machine relocations is important. Harvesting conditions and forest stand inventory volumes also affect the energy-efficiency modelling of wood-harvesting operations (Palander et al. 2018). In this respect, the combined emission and energy-efficiency calculation procedure developed in this study will be tested to advance the energy-efficiency optimization model of wood procurement (Palander et al. 2020).
This study focused on the energy efficiency of the Stora Enso WSF wood-supply chain, particularly in the wood-harvesting operations and forest machine relocations in Finland. The aims of the study were as follows:
Þ to clarify the allocation of the forest machine fleet for cutting methods from the energy-efficiency point of view related to the engine power of forest machines
Þ to determine the total and average fuel consumption and GHG emissions caused by wood-harvesting operations including cutting and forwarding in the forests and the relocation of forest machines transported by relocation trucks on the roads, and
Þ to investigate the energy efficiency of wood-harvesting operations.
2. Materials and Methods
2.1 Collection of Forest Machine Data and Classification of Machinery
The research data was collected from the enterprise resource planning (ERP) system of Stora Enso WSF. Data collection was the first stage of the energy-efficiency calculation procedure of wood-harvesting operations (Fig. 1). The research data consisted of the removals harvested by 34 forest machine contractors by Stora Enso WSF from the 1st of January to the 31st of December 2016. In the study, there were 18,114 harvesting sites in total. Harvesting data collected from the ERP system included the following information by harvesting site:
Þ Forest machine contractor: identification code
Þ Forest machine: identification code, type (harvester & forwarder), brand, model, year of manufacturing; and
Þ Harvesting site: geographical location (coordinates) (Fig. 2), date of cutting, cutting method (first thinning, later thinning, final felling), total number of stems removed, total removals (m3), average stem size of removals in the stand (m3/stem), and forwarding distance (m).

Fig. 1 Procedure for producing fuel consumption, GHG emission, and energy-efficiency figures for the forest machine fleet of the study
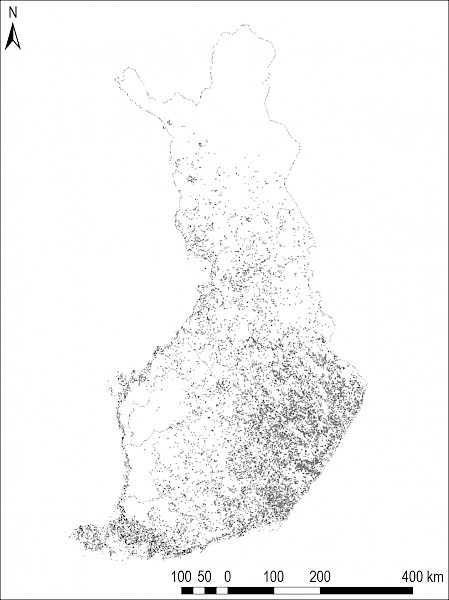
Fig. 2 Locations of the harvesting sites (n=18,114; small grey plots on the map) of the study
After capturing the ERP system data, forest machine entrepreneur interviews were conducted, and the forest machine fleet used in the harvests of 2016 was checked (i.e. Was machinery information correct in the ERP system data?) and if required, corrected. Furthermore, the interviewees were asked for the number of wheels on forest machines used. Then, the corrected machine data was enriched with accurate machine information (i.e. model of engine, engine power [kW], and carrying capacity [tonnes] for forwarders). The accurate machine information was mainly found in the Koneyrittäjät Machine Catalogues annually published by the Trade Association of Finnish Forestry and Earth Moving Contractors (1996–2016). Some detailed machine information was also found and checked from the Internet pages and machine booklets of the forest machine manufacturers John Deere, Komatsu, Logset, and Ponsse.
There were 418 harvesters and 336 forwarders in the final study data. The three main brands of machines were Ponsse (59.1% of harvesters and 57.7% of forwarders), John Deere(/Timberjack) (20.1% of harvesters and 17.5% of forwarders), and Komatsu(/Valmet) (7.5% of harvesters and 8.6% of forwarders). The most common harvester model used was Ponsse Ergo (6-wheeled; 6WD), and the most common forwarder model was Ponsse Elk (8WD). The carrying capacity of forwarders averaged 12.7 tonnes, varying from 8.5 tonnes to 18.0 tonnes. The mean age of the harvesters was 4.3 years, and it was 5.4 years for the forwarders.
The variation range of the harvesters engine power was 70–240 kW, and that of forwarders was 82–210 kW. The harvesters engine power averaged 169 kW, and that of the forwarders averaged 149 kW. To investigate the use of the forest machines used and the allocation of harvesters and forwarders with different engine power in 2016 by engine power and by cutting method, both harvesters and forwarders were classified by engine power classes of 20 kW, from less than 100 kW to more than 199 kW. The biggest group of harvesters and forwarders was the 140–159 kW class (Fig. 3). Harvesters and forwarders equipped with engine power of 120–139 kW and >199 kW were also commonly used (Fig. 3).
Fig. 3 Distribution of the number of harvesters (n=418) and forwarders (n=336) related to their engine power
The total volume of harvested removals in the study data was 8.9 million m3, and more than 48 million stems were cut (Table 1). The total harvested removals divided by the cutting method were as follows: first thinnings 8%, later thinnings 37%, and final fellings 55%. The stem size of removals in the stand averaged 0.080 m3 for first thinnings, 0.139 m3 for later thinnings, and 0.305 m3 for final fellings (Table 1).
Table 1 Description of total data and the average harvesting conditions at harvesting sites by cutting method
|
First thinning |
Later thinning |
Final felling |
Total |
Average |
|
|
Number of harvesting sites |
– * |
– * |
– * |
18,114 |
– |
|
Roundwood removals, m3 (%) |
723,900 (8.1) |
3,250,000 (36.5) |
4,942,100 (55.4) |
8,916,000 |
– |
|
Removal/harvesting site, m3 |
– * |
– * |
– * |
– |
492 |
|
Number of stems removed, n (%) |
9,001,800 (18.5) |
23,438,800 (48.2) |
16,219,400 (33.3) |
48,660,000 |
– |
|
Stem size of removals, m3 |
0.080 |
0.139 |
0.305 |
– |
0.183 |
|
Forwarding distance, m |
323 |
318 |
286 |
– |
301 |
|
* The number of harvesting sites of first thinnings, later thinnings, and final fellings could not be determined because more than one cutting method was used at some harvesting sites |
|||||
2.2 Modelling of Forest Machine Fleet Productivity
Modelling of the productivity with harvesters in both thinnings (Eq. 1) and final fellings (Eq. 2) was conducted by applying the functions by Eriksson and Lindroos (2014), with the mean stem size of removal in the stand (V) as the independent variable. The conversion from the under-bark volume by Eriksson and Lindroos (2014) to the over-bark volume was achieved using a coefficient of 1.14 (cf. Hakkila et al. 2002). Furthermore, the effective (E0) hour cutting productivity by Eriksson and Lindroos (2014) was converted to operating (E15) hour productivity in both thinnings and final cuttings using a coefficient of 0.88 (cf. Rajamäki et al. 1996). When cutting with the harvesters equipped with an engine power of <100 kW, the productivity of cutting work was lowered by 3.0 m3/E15 hour in all final-felling stands (cf. Eriksson and Lindroos 2014).
 (1)
(1)
Where:
PCutThin cutting productivity in thinnings, m3/E15 hours
V mean stem size of removals in the stand, m3/stem
bc coefficient for conversion from the under-bark volume to over-bark volume (1.14)
hCut coefficient for conversion from effective (E0) hour cutting productivity to operating (E15) hour productivity (0.88).
 (2)
(2)
Where:
PCutFin cutting productivity in final fellings, m3/E15 hours.
Modelling of the forest haulage productivity with forwarders in both thinnings (Eq. 3) and final fellings (Eq. 4) was also conducted by applying the functions by Eriksson and Lindroos (2014) with the mean stem size of removals (V), forwarding distance (DFor), and actual load size (LS) as the independent variables. The actual load size in forwarding was determined using a green density of 845 kg/m3 of fresh timber cut (cf. Marjomaa 1992, Kainulainen and Lindblad 2005, Lindblad and Repola 2019), and it was assumed that the average filling rate of a load was 90% (Eq. 5). The effective (E0) hour productivity by Eriksson and Lindroos (2014) was converted to operating (E15) hour productivity in thinnings and final cuttings using a coefficient of 0.93 (cf. Väkevä et al. 2001).
 (3)
(3)
Where:
PForThin forwarding productivity in thinnings, m3/E15 hour
DFor forwarding distance, m
LS actual load size, m3
hFor coefficient for conversion from effective (E0) hour forwarding productivity to operating (E15) hour productivity (0.93).
 (4)
(4)
Where:
PForThin forwarding productivity in final felllings, m3/E15 hour.
 (5)
(5)
Where:
CC maximum carrying capacity of forwarder, kg
gd green density used (845), kg/m3
fr coefficient for the filling rate assumed of forwarder (0.90).
The average cutting and forest haulage productivity by cutting method is presented in Table 2. The payload in forwarding averaged 13.5 m3, ranging between 9.1 m3 and 19.1 m3 by harvesting site.
Table 2 Average productivity of cutting and forwarding by cutting method
|
First thinning |
Later thinning |
Final felling |
|
|
Productivity, m3/E15-hour |
|||
|
Cutting |
9.4 |
15.4 |
31.3 |
|
Forwarding |
13.0 |
16.3 |
22.3 |
2.3 Calculating the Forest Machine Fleet Fuel Consumption and Emissions
The hour-based fuel consumption (litres per E15 hour; L/E15) of the study harvesters (Eq. 6) and forwarders (Eq. 7) was calculated by applying the functions by Brunberg (2013) with the engine power (E) of the forest machine as the independent variable.
 (6)
(6)
Where:
FCCut_H hour-based fuel consumption in cutting, L/E15-hour
EHarv engine power of harvester, kW.
 (7)
(7)
Where:
FCFor_H hour-based fuel consumption in forwarding, L/E15-hour
EFor engine power of forwarder, kW.
Furthermore, cubic-based fuel consumption (litres per m3 harvested; L/m3) for the study harvesters and forwarders was calculated by dividing hour-based fuel consumption by productivity (Eq. 8 and Eq. 9). Total fuel consumption per harvesting site (L/harvesting site) was determined by summing up the cubic-based fuel consumption in cutting and forwarding and multiplying it by the total removals at the harvesting site (Eq. 10).
 (8)
(8)
Where:
FCCut_C cubic-based fuel consumption in cutting, L/m3
PCut cutting productivity, m3/E15-hour.
 (9)
(9)
Where:
FCFor_C cubic-based fuel consumption in forwarding, L/m3
PFor forwarding productivity, m3/E15 hour.
 (10)
(10)
Where:
FCTOT total fuel consumption in cutting and forwarding at harvesting site, L
R total removals at harvesting site, m3.
The GHG emissions of harvesters and forwarders were calculated by applying the VTT’s Lipasto database (2017) of the average emissions (g per litre used; g/L) of work machinery in 2016 in Finland (Table 3). The following emissions were calculated: CO2 eq., carbon monoxide (CO), hydrocarbons (HC), CH4, N2O, nitrogen oxides (NOX), sulphur dioxide (SO2), and total particulate matter (PM) of exhaust gases.
Table 3 GHG emissions per fuel litre (g/L) used in the calculation of emissions for harvesters and forwarders by emission category (Lipasto database 2017)
|
Emission category |
Harvesters |
Forwarders |
|
Emissions, g/L |
||
|
CO2 eq. |
2674 |
2673 |
|
CO |
5.7 |
7.9 |
|
HC |
0.72 |
0.94 |
|
CH4 |
0.15 |
0.15 |
|
N2O |
0.042 |
0.042 |
|
NOX |
3.9 |
6.0 |
|
SO2 |
0.0081 |
0.0081 |
|
PM |
0.082 |
0.200 |
The cubic-based GHG emissions (g per m3 harvested; g/m3) by emission category and harvesting site for the study harvesters and forwarders were calculated by dividing total GHG emissions in each emission category by the total removals at the harvesting site (Eq. 11).
 (11)
(11)
Where:
GHGC cubic-based GHG emissions in each emission category, g/m3
GHGTOT total GHG emissions in each emission category, g.
2.4 Collection of Forest Machine Relocation Data
The research data of forest machine relocations from one harvesting site to another was detected using the same ERP system as for the forest machine fleet data (Figs 2 and 6). Thus, relocation data consisted of machine relocations between 18,114 harvesting sites from the 1st of January to the 31st of December 2016.

Fig. 4 Procedure for producing fuel consumption, GHG emission, and energy-efficiency figures for forest machine relocations with relocation trucks
The distances of forest machine relocations were calculated by assuming that machine relocation was executed using the shortest route from the coordinate of harvesting site A to the coordinate of harvesting site B, travelling along the common road network. A national Digiroad (2020) network database was used for calculations. The distance from harvesting site A to B was calculated using Esri network analyst tools, applying Dijkstra’s shortest path first (SPF) algorithm (Dijkstra 1959) for shortest path calculations on the Digiroad network dataset. There were 746 measured distances that were shorter than 500 meters (i.e. they were adjacent harvesting sites). Those very short (<0.5 km) relocation distances were removed from the final relocation data because it was evaluated that they would often drive with forest machines along gravel forest roads to the next harvesting site. Hence, the final relocation distance data consisted of 17,368 relocations (Fig. 5). The relocation distance (with loaded relocation truck) was, on average, 26.3 km.
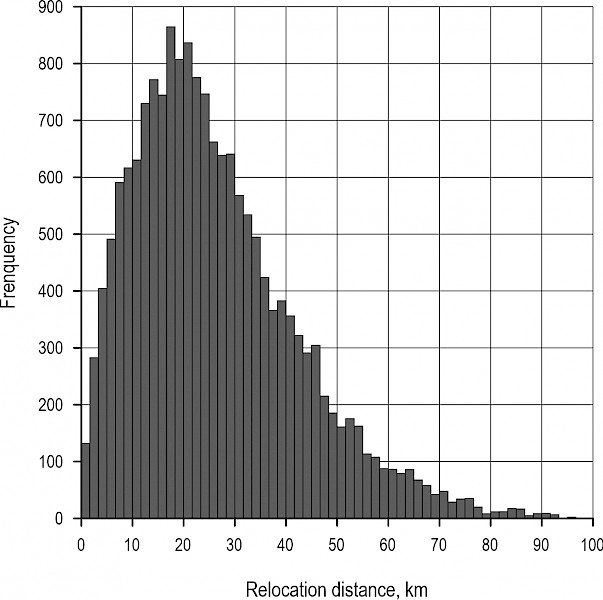
Fig. 5 Distribution of distances of forest machine relocations (n= 7368) in the final relocation data
In the study, it was assumed that each forest machine relocation is a separate operation; in other words, first, a harvester of the harvesting chain is relocated, then a relocation truck will go to relocate some other machine, and finally a relocation truck will come to relocate a forwarder of the harvesting chain in question (Fig. 6). Thus, the measured relocation distance between harvesting sites A and B was the relocation distance of driving a loaded truck. According to the forest machine entrepreneurs interviewed and earlier reports (e.g. Kuitto et al. 1994, Väätäinen et al. 2006, 2008, Kauppinen 2010), machine relocation distances with an empty truck are clearly longer (double or even triple) than those with a loaded truck. Hence, it was assumed that each driving distance with an empty relocation truck would be 30 km longer than driving distances with loaded trucks (Fig. 6, Eq. 12).
Fig. 6 Procedure for calculating relocation distances to forest machine relocations with relocation trucks. H=harvester, F=forwarder (cf. Eq. 12)
 (12)
(12)
Where:
DEmp driving distance of empty relocation truck, km
DLoad driving distance of loaded relocation truck, km.
Total calculated driven distance for one relocation of one harvesting chain (i.e. harvester and forwarder) averaged 165.1 km (on average 82.6 km, in total, driving for one forest machine relocation). The calculated distance driven by relocation trucks totalled 2,867,441 km, of which the share with empty trucks was 68.2% and with loaded trucks 31.8%.
2.5 Calculating the Forest Machine Relocation Fuel Consumption and Emissions
The fuel consumption of relocation trucks driving empty and loaded was determined by applying Eq. 13 and Eq. 14. Fuel consumption for each machine relocation was calculated by applying Eq. 15 and Eq. 16.
 (13)
(13)
Where:
FCEmp_100 fuel consumption driving empty, L/100 km.
 (14)
(14)
Where:
FCLoad_100 fuel consumption driving loaded, L/100 km.
 (15)
(15)
Where:
FCEmp fuel consumption driving empty, L/relocation.
 (16)
(16)
Where:
FCLoad fuel consumption driving loaded, L/relocation.
The GHG emissions of forest machine relocation trucks were calculated by applying the VTT’s Lipasto database (2017) of the average emissions (g per kilometre driven; g/km) of an earthmoving truck along densely populated communities in 2016 in Finland because the Lipasto database did not include a specific truck for forest machine relocations or transports (Table 4). The same GHG emissions were calculated for harvesters and forwarders (CO2 eq., CO, HC, CH4, N2O, NOX, SO2, and PM). The GHG emissions were separately determined for the empty and loaded relocation trucks (Table 4).
Table 4 Emissions per kilometre driven (g/km) by empty and loaded relocation trucks (Lipasto database 2017)
|
Emission category |
Empty |
Loaded |
|
Emissions, g/km |
||
|
CO2 eq. |
838 |
1384 |
|
CO |
1.0 |
1.2 |
|
HC |
0.20 |
0.23 |
|
CH4 |
0.008 |
0.012 |
|
N2O |
0.029 |
0.034 |
|
NOX |
5.8 |
8.0 |
|
SO2 |
0.0028 |
0.0046 |
|
PM |
0.10 |
0.13 |
The cubic-based GHG emissions (g per m3 harvested; g/m3) for the study relocation trucks were calculated by dividing total GHG emissions by trucks with the total roundwood removals harvested in the study stands (Eq. 17).
 (17)
(17)
Where:
GHGC_Rel cubic-based GHG emissions of machine relocations in each emission category, g/m3
GHGTOT_Rel total GHG emissions by relocation trucks in each emission category, g.
2.6 Calculating the Energy Efficiency of Harvesting Operations
The energy efficiency (i.e. the efficiency ratio of the renewable wood energy provided and fossil energy consumed) of wood-harvesting operations and forest machine relocations by trucks was calculated applying Eq. 18 (Palander et al. 2020):
 (18)
(18)
Where:
EE energy efficiency, kWh/kWh
EPro amount of renewable wood energy provided, kWh
ECon amount of fossil energy consumed, kWh.
The amount of renewable wood energy provided was calculated using the following assumptions and Equations: First, the harvested wood volume (m3) was converted to kilograms applying a green density of 845 kg/m3 of fresh timber cut (cf. Marjomaa 1992, Kainulainen and Lindblad 2005, Lindblad and Repola 2019). Then, the net calorific value of the fresh wood was produced using Eq. 19 (Alakangas et. al 2016). The moisture content of the wood of 55% was applied and the net calorific value of the dry wood of 19.167 MJ/kg was used in the calculations (cf. Palander et al. 2020).
 (19)
(19)
Where:
Qnet,f net calorific value of fresh wood, MJ/kg
Qnet,d net calorific value of dry wood, MJ/kg
Mf moisture content of fresh wood,%
c a constant of 0.02441 MJ/kg, equivalent to water evaporation rate at a temperature of 25°C.
The net calorimetric value of the fresh wood in mega joules was produced when the net calorific value of the fresh wood (7.2826 MJ/kg), calculated by Eq. 19, was multiplied by the mass of the fresh wood. Further, the amount of wood energy provided, expressed in kWh, was calculated applying the factor of 3.6 MJ/kWh.
When calculating the amount of fossil energy consumed, first, the volume of diesel was converted to kilograms using a diesel density of 830 kg/m3 of a sulphur light fuel oil in the study (cf. ABC 2015, 2017, Neste 2020a, 2020b). Then, the fuel energy quantity was calculated by converting with the net calorific value coefficient of 43 MJ/kg for light fuel oils (Seppänen et al. 2012). The amount of energy consumed expressed in kWh was determined by dividing MJ by 3.6.
3. Results
3.1. Use of Forest Machine Fleet
The results illustrate that the forest machinery researched in the study was not directed at different cutting methods and harvesting sites based on the engine power. For instance, in cutting, the majority (31.6%; more than 220,000 m3) of the first-thinning wood was cut by harvesters with an engine power of >199 kW (i.e. the largest harvester group of the study) (Fig. 7). Almost an equal proportion (30.9%) of the first-thinning wood was cut by harvesters with the engine power of 140–159 kW (i.e. with middle-sized harvesters). Correspondingly, in later thinnings, the 140–159 kW harvesters were used the most (i.e. 33.0% of the later-thinning wood was cut by these harvesters), while the largest harvesters equipped with an engine power of more than 199 kW cut 30.3% of the later-thinning wood. In final fellings, the largest (>199 kW) harvesters were the most frequently used (39.4%), and the middle-sized (engine power of 140–159 kW) harvesters cut 28.5% of the final-felling wood (Fig. 7).
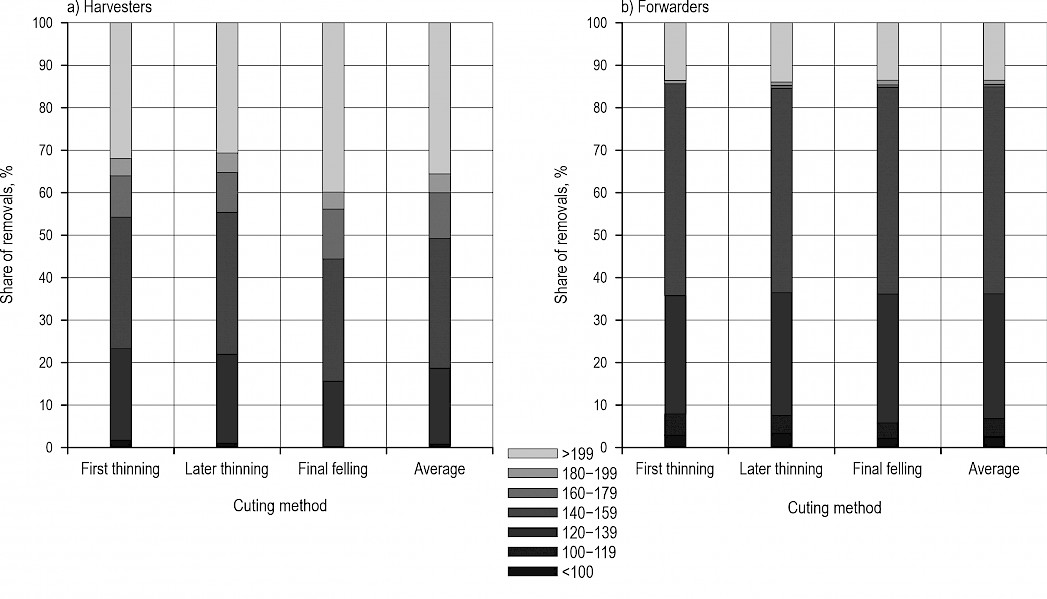
Fig. 7 Distribution of removals by cutting method (cf. Table 1) and by engine power (kW)
Investigating the allocation of forwarder resources indicates that forest haulage was mostly (around 50%) executed by the middle-sized (engine power of 140–159 kW) forwarders in all cutting methods (Fig. 7). Furthermore, the so-called lower middle-sized forwarders equipped with an engine power of 120–139 kW conducted the forwarding of timber, with 28.0–30.1% by the cutting method (Fig. 7). The share of forest-hauled timber by the forwarders equipped with an engine power of >199 kW varied between 13.1% and 13.8% by the cutting method (Fig. 7).
Regarding the cutting method proportions in each engine power group (Fig. 8), the same observation as earlier can be made (Fig. 7): Directing of the forest machine fleet is not optimal in terms of the machines engine power and further energy efficiency. Nonetheless, the small harvesters equipped with an engine power of less than 100 kW were more frequently allocated to thinnings, and their use in final cuttings was avoided (Fig. 8). Apart from the small harvesters, the other harvester groups were used similarly for the different cutting methods (Fig. 8).
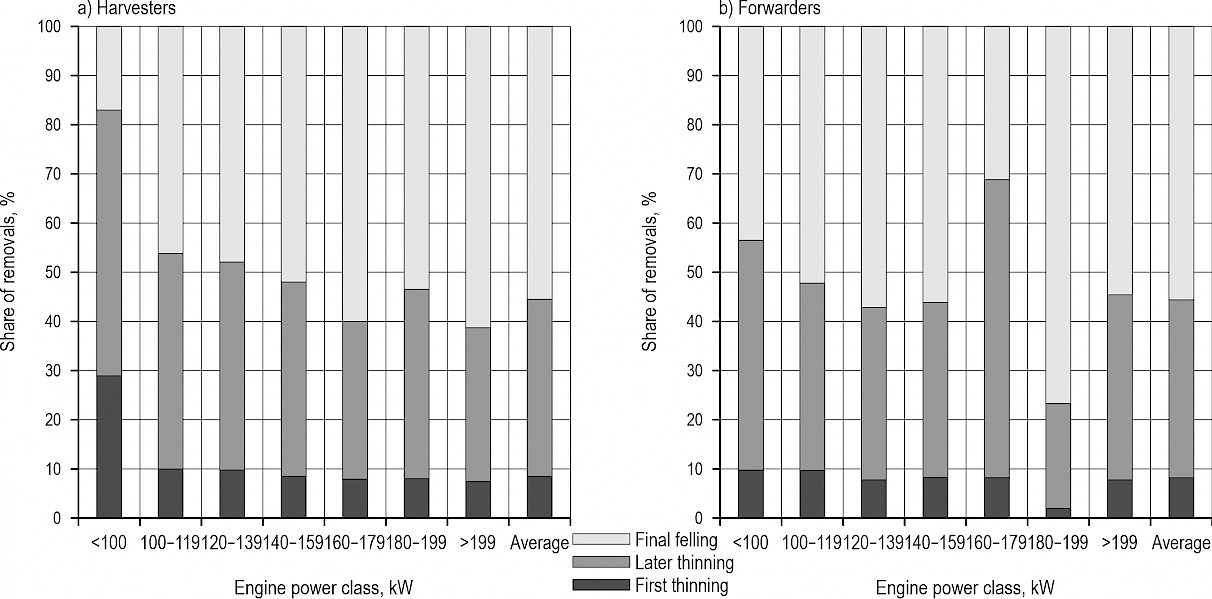
Fig. 8 Distribution of removals harvested by the engine power
Fig. 8 depicts the same trend with the forwarders in forest haulage as with the harvesters: There was no intentional forest machine allocation related to the engine power of the machines in the 2016 study data. However, the share of final cuttings with the forwarders equipped with an engine power of 160–179 kW, as well as the proportion of thinnings with the forwarders of an engine power of 180–199 kW, was smaller than that of the forwarders of other engine power groups (Fig. 8). Nevertheless, it is important to note that the number of these forwarder groups (160–179 kW and 180–199 kW) was quite small (Fig. 3), as was the forwarding volume, which was only around 50,000 m3 (160–179 kW) and 95,000 m3 (180–199 kW).
3.2 Fuel Consumption of Forest Machine Fleet
The calculated fuel consumption totalled 14.2 million litres (ML) for wood harvesting of the removals of 8.9 million m3 in 2016. The share of cutting work was 57.1% (8.1 ML) of the total calculated fuel consumption. The biggest calculated total fuel consumption by the cutting method was in later thinnings (6.4 ML), which was 45.1% of the total fuel consumption in wood-harvesting operations in the forests. The share of first thinnings was 14.0% (2.0 ML) of the total calculated fuel consumption, and the proportion of final fellings was 40.9% (5.8 ML). In first thinnings, the proportion of cutting work from the total fuel consumption was the highest (64.9%), and in later thinnings it was lower (59.9%) than that of first thinnings. On the contrary, when harvesting wood from final fellings, the share of cutting from the total calculated fuel consumption was the lowest, at 51.3% of the total calculated fuel consumption due to wood-harvesting operations in the forests.
The calculated cubic-based fuel consumption of wood harvesting averaged 1.6 L/m3 in the study (Table 5). In final fellings, the average cubic-based fuel consumption of wood harvesting was the lowest (1.2 L/m3). On the other hand, in first thinnings, the average fuel consumption was the highest, on average, 2.8 L/m3 of fuel. Surveying the calculated cubic-based fuel consumption by the cutting method, it can be observed that cutting work consumed more fuel than forwarding in all cutting methods (Table 5).
Table 5 Calculated average cubic-based fuel consumption in cutting and forwarding by cutting method in 2016
|
First thinning |
Later thinning |
Final felling |
Total harvesting |
|
|
Fuel consumption, L/m3 |
||||
|
Cutting |
1.78 |
1.18 |
0.60 |
0.91 |
|
Forwarding |
0.96 |
0.79 |
0.57 |
0.68 |
|
Total harvesting |
2.75 |
1.97 |
1.17 |
1.59 |
3.3 GHG Emissions of Forest Machine Fleet
The calculated CO2 eq. emissions of the harvesting operations of 8.9 million m3 in the forests totalled 37,971 tonnes of CO2 eq., of which 21,676 tonnes were from cutting work and 16,295 tonnes were from forwarding (Table 6). The calculated total CO emissions were 94 tonnes, total HC emissions were 11 tonnes, total CH4 emissions were 2 tonnes, total N2O emissions were 68 tonnes, total SO2 emissions were 115 tonnes, total PM emissions were 2 tonnes and the emissions of NOX totalled 68 tonnes. The cutting work proportions by emission category ranged between 35.1% and 57.1% in the calculated GHG emission data (Table 6).
Table 6 Calculated total GHG emissions in cutting and forwarding by cutting method with the removals harvested (8,916,024 m3)
|
First thinning |
Later thinning |
Final felling |
Total harvesting |
|
|
CO2 eq. emissions, kg |
||||
|
Cutting |
3,448,021 |
10,262,855 |
7,964,988 |
21,675,864 |
|
Forwarding |
1,864,927 |
6,878,490 |
7,551,527 |
16,294,944 |
|
Total harvesting |
5,312,947 |
17,141,346 |
15,516,515 |
37,970,808 |
|
CO emissions, kg |
||||
|
Cutting |
7350 |
21,877 |
16,978 |
46,205 |
|
Forwarding |
5512 |
20,329 |
22,318 |
48,159 |
|
Total harvesting |
12,862 |
42,206 |
39,297 |
94,364 |
|
HC emissions, kg |
||||
|
Cutting |
928 |
2763 |
2145 |
5836 |
|
Forwarding |
656 |
2419 |
2656 |
5730 |
|
Total harvesting |
1584 |
5182 |
4800 |
11,567 |
|
CH4 emissions, kg |
||||
|
Cutting |
193 |
576 |
447 |
1216 |
|
Forwarding |
105 |
386 |
424 |
914 |
|
Total harvesting |
298 |
962 |
871 |
2130 |
|
N2O emissions, kg |
||||
|
Cutting |
54 |
161 |
125 |
340 |
|
Forwarding |
29 |
108 |
119 |
256 |
|
Total harvesting |
83 |
269 |
244 |
596 |
|
NOX emissions, kg |
||||
|
Cutting |
5029 |
14,968 |
11,617 |
31,614 |
|
Forwarding |
4186 |
15,440 |
16,951 |
36,577 |
|
Total harvesting |
9215 |
30,408 |
28,568 |
68,191 |
|
SO2 emissions, kg |
||||
|
Cutting |
10 |
31 |
24 |
66 |
|
Forwarding |
6 |
21 |
23 |
49 |
|
Total harvesting |
16 |
52 |
47 |
115 |
|
PM emissions, kg |
||||
|
Cutting |
106 |
315 |
244 |
665 |
|
Forwarding |
140 |
515 |
565 |
1219 |
|
Total harvesting |
245 |
829 |
809 |
1884 |
The calculated cubic-based CO2 eq. emissions averaged 4259 g/m3 harvested in the study (Table 7). By cutting method, the highest CO2 eq. emissions were recorded in first-thinning stands (7340 g CO2 eq./m3), and the lowest in final fellings (3140 g CO2 eq./m3), which represented only 43% of the corresponding CO2 eq. emissions from first-thinning stands. The calculated CO emissions were, on average, 10.6 g CO/m3, and the NOX emissions averaged 7.6 g NOX/m3. The average cubic-based HC and CH4 emissions were 1.30 and 0.24 g/m3 harvested, respectively (Table 7).
Table 7 Calculated average cubic-based GHG emissions in wood harvesting (including cutting and forwarding) in the forests by cutting method with the removals harvested (8,916,024 m3)
|
Emission category |
First thinning |
Later thinning |
Final felling |
Average |
|
Emissions, g/m3 |
||||
|
CO2 eq. |
7340 |
5274 |
3140 |
4259 |
|
CO |
17.8 |
13.0 |
8.0 |
10.6 |
|
HC |
2.19 |
1.60 |
0.97 |
1.30 |
|
CH4 |
0.176 |
0.239 |
0.412 |
0.239 |
|
N2O |
0.049 |
0.067 |
0.115 |
0.067 |
|
NOX |
12.7 |
9.4 |
5.8 |
7.6 |
|
SO2 |
0.010 |
0.013 |
0.022 |
0.013 |
|
PM |
0.339 |
0.255 |
0.164 |
0.211 |
3.4 Fuel Consumption and GHG Emissions of Forest Machine Relocations
The calculated fuel consumption of relocation trucks totalled 1,234,605 litres, of which the share of driving a loaded relocation truck was 44.6%, and more than half (55.4%) of the calculated fuel consumption was caused by driving empty relocation trucks. For the relocation of one harvesting chain, the calculated fuel consumption averaged 71.1 L/relocation/harvesting chain, in total. The calculated total CO2 eq. emissions of relocation trucks were 2901 tonnes when the annual wood-harvesting volume was 8.9 million m3 (Table 8). The calculated NOX and CO emissions totalled 18.6 and 3.1 tonnes, respectively.
Table 8 Calculated total GHG emissions caused by driving empty and loaded relocation trucks when the total removals harvested were 8,916,024 m3
|
Emission category |
Empty |
Loaded |
Total relocations |
|
Emissions, kg |
|||
|
CO2 eq. |
1,638,089 |
1,263,150 |
2,901,239 |
|
CO |
1955 |
1095 |
3050 |
|
HC |
391 |
210 |
601 |
|
CH4 |
16 |
11 |
27 |
|
N2O |
57 |
31 |
88 |
|
NOX |
11,338 |
7301 |
18,639 |
|
SO2 |
6 |
4 |
10 |
|
PM |
195 |
119 |
314 |
The cubic-based fuel consumption averaged 0.13 L/m3 harvested, and the average calculated fuel consumption of relocation trucks was 43.1 L/100 km. Correspondingly, the cubic-based CO2 eq. emissions in the forest machine relocations of the study averaged 325 g CO2 eq./m3 (Table 9). The calculated cubic-based NOX and CO emissions averaged 2.09 g NOX/m3 and 0.34 g CO/m3.
Table 9 Calculated average cubic-based GHG emissions caused by driving empty and loaded relocation trucks when the total removals harvested were 8,916,024 m3
|
Emission category |
Empty |
Loaded |
Total relocations |
|
Emissions, g/m3 |
|||
|
CO2 eq. |
184 |
142 |
325 |
|
CO |
0.219 |
0.123 |
0.342 |
|
HC |
0.044 |
0.024 |
0.067 |
|
CH4 |
0.022 |
0.001 |
0.003 |
|
N2O |
0.006 |
0.003 |
0.010 |
|
NOX |
1.27 |
0.82 |
2.09 |
|
SO2 |
0.001 |
0.000 |
0.001 |
|
PM |
0.022 |
0.013 |
0.035 |
3.5 Energy Efficiency of Wood-Harvesting Operations
The energy-efficiency calculations illustrated that the energy-efficiency of the wood-harvesting operations including relocation by trucks is at a very good level (Table 10). The energy-efficiency ratios were more than 50 in all options calculated. As in thinning the productivity of cutting and forwarding is lower and fuel consumption is higher than that in final fellings, the energy efficiency was lower in thinnings (Table 10). For instance, in thinnings the energy efficiency of the total harvesting ranged from 63 to 87, and in final fellings it was 147 (Table 10). The forest machine relocations lowered the energy-efficiency ratio of the total wood-harvesting operations by 4.8–10.5% by cutting method (Table 10).
Table 10 Energy efficiencies of wood-harvesting operations by cutting method. The energy-efficiency figures of the total wood-harvesting operations also include the relocation of forest machinery on the roads
|
Wood-harvesting operation |
First thinning |
Later thinning |
Final felling |
Total harvesting |
|
Energy efficiency, kWh/kWh |
||||
|
Cutting (harvester) |
96.8 |
146.0 |
286.1 |
189.6 |
|
Forwarding (forwarder) |
178.9 |
217.8 |
301.6 |
252.2 |
|
Total harvesting |
62.8 |
87.4 |
146.8 |
108.2 |
|
Total wood-harvesting operation (including machine relocations) |
59.8 |
81.7 |
131.3 |
99.6 |
4. Discussion
The Energy Efficiency Directive and energy efficiency agreements were launched to implement the targets of the EU’s climate and energy framework, which guides European governments and companies to improve their energy efficiency and even reach carbon-neutrality targets with increased use of RESs. In this respect, this research on the energy efficiency of wood-harvesting operations is not only important from the environmental point of view, but higher energy efficiency can also improve the profitability of wood-harvesting contractors and the whole forestry sector (cf. Brunberg 2013, Haavikko et al. 2019, Palander et al. 2020). Several studies have confirmed that fuel costs are one of the most essential cost components for logging contractors. For instance, Nordfjell et al. (2003) and Greene et al. (2014) and the latest forestry sector statistics in Finland (Metsäalan kone- ja… 2018) underlined that the share of fuel costs is around 12–20% of the total wood-harvesting costs of logging contractors. Consequently, fuel cost deviations play a decisive role in the business of logging contractors, and in the future, the trend seems to be strengthening (Brunberg 2013, Haavikko et al. 2019).
This study developed and tested the comprehensive energy-efficiency calculation procedure for industrial use of the forestry sector. Generally, as the results of the study are computational, the used functions have a great impact on the results calculated. In fact, the productivity modelling for the harvesters and forwarders was conducted by applying the functions by Eriksson and Lindroos (2014), which are based on the largest Nordic CTL wood-harvesting data ever. Furthermore, the functions by Brunberg (2013), which are based on a wide and extensive follow-up study in Sweden, were used to determine the fuel consumption of forest machines according to their engine power. Moreover, VTT’s Lipasto database (2017) of average emissions was applied for GHG emissions calculations. These Lipasto emission factors are commonly used in Finland and were updated in 2017. In comparison with the emission factors used in several other studies (e.g. Ackerman et al. 2017, Prinz at al. 2018, Hudiburg et al. 2019, Spinelli and de Arruda Moura 2019, Domke et al. 2020), such as EPA (2016), the factors are almost the same and hence the results and conclusions of the study are comparable to them. In addition, the emission factors are applicable to calculating GHG emissions and energy efficiencies in future emissions investigations.
The results illustrated that small and medium-sized harvesters (engine power <160 kW) cut almost half of final-felling removals, while larger machines (engine power >160 kW) cut more than a third of first thinnings. This situation is non-optimal with respect to use of the machine fleet. In cutting, the machine size has a significant impact on machine productivity, as Klvac and Skoupy (2009) suggested, because the most powerful (kW) harvesters are designed for felling trees with the largest stem diameters, which in practice means final fellings. Correspondingly, small and medium-sized harvesters are most suitable for cutting small-diameter trees (i.e. for thinnings) (Jylhä et al. 2019). It is concluded that it is more productive to cut the final fellings with bigger harvesters (e.g. John Deere 1270E, Ponsse Scorpion, and Ponsse Scorpion King), but in the case of thinnings, total relative productivity is better with medium-sized harvesters (e.g. Komatsu 901.4 and Ponsse Beaver). The distribution of forwarders by engine power (kW) was relatively equal to that of harvesters. Some studies have pointed out that large forwarders should be mainly used for final fellings because of their higher productivity (Jiroušek et al. 2007). However, there was no difference in the distribution of machine use between thinnings and final fellings in this study. Forwarders equipped with an engine power of 100–160 kW forwarded most timber (first thinning 74%, later thinning 73%, and final felling 75%). Comparing the harvesting stand data to that of other Finnish studies, it can be noticed that, for example, the average stem size of removals was almost the same. In this study, the average stem size of removals was 305 dm3, while Jylhä et al. (2019) found 327 dm3 and Kuitto et al. (1994) found 309 dm3 in the case of final fellings. Thus, the results are comparable.
In this study, the share of calculated total fuel consumption of wood-harvesting operations including fuel consumption by relocation trucks were as follows: 52% for harvesters, 40% for forwarders, and 8% for relocation trucks. Total calculated fuel consumption was the highest for later thinnings (47%), but only just over a third (37%) of the removals were harvested from later thinnings. Final fellings accounted for more than half (55%) of the total harvesting volume, but only accounted for just over a third (37%) of the total calculated fuel consumption. The relative share of first thinnings was very small (8%) in the wood-harvesting volumes, and their total fuel consumption remained the lowest (16%). However, when looking at the cubic-based fuel consumption, harvesting first thinnings consumed relatively a lot of fuel compared to later harvesting operations.
The average calculated fuel consumption of cutting by harvesters was 0.91 L/m3 and 0.68 L/m3 in forest haulage by forwarders. Harvesters average fuel consumption was higher in first thinnings (1.78 L/m3) than in later thinnings (1.18 L/m3) and final fellings (0.60 L/m3). These results are consistent with other studies in Nordic countries on CTL harvesting operations. Rieppo and Örn (2003) found that cubic-based fuel consumption was higher in first thinnings (1.76 L/m3) than in later thinnings (1.42 L/m3) and final fellings (0.70 L/m3). These fuel consumption figures are slightly lower than the figures reported in this study. According to Jylhä et al. (2019), fuel consumption was 1.18 L/m3 for forest thinnings (including first thinnings and later thinnings) and 0.69 L/m3 for final fellings. Brunberg (2013) reported the same levels in his research: The fuel consumption of harvesters was 1.41 L/m3 (over the bark) in forest thinnings (including first thinnings and later thinnings) and 0.73 L/m3 in final fellings.
Forwarders fuel consumption was higher in first thinnings (0.96 L/m3) than in later thinnings (0.79 L/m3) and final fellings (0.57 L/m3). Rieppo and Örn (2003) studied forwarders fuel consumption with different cutting methods, and their results are parallel to those of this study. They found that fuel consumption was 0.98 L/m3 for first thinnings, 0.80 L/m3 for later thinnings, and 0.62 L/m3 for final fellings. In the study by Brunberg (2013), the fuel consumption of forwarders was slightly higher for final fellings (0.63 L/m3 [over the bark]), whereas they reported the same consumption for forest thinnings (0.86 L/m3). The difference in the relative fuel consumption per m3 between forwarders and harvesters is not remarkable with final fellings, but during first thinnings, harvesters consume 46% more fuel per m3 than forwarders do. This same relative increase in fuel consumption per m3 can also been seen in Rieppo and Örn’s (2003) results for forest haulage by forwarders.
In addition to the above-discussed characteristics of wood harvesting, many other specific factors have been found to influence fuel consumption. Brunberg (2013) revealed that the fuel consumption of wood-harvesting machines increased, on average, by 9% between 2006 and 2012. Brunberg (2013) explained his findings by the fact that the engine power of forest machines increased, but the utilization rate of machines also increased. In this respect, Smidt and Gallagher (2013) and Prinz et al. (2018) underscored the effect of the machine operator, machine type, harvesting conditions, and machine and device settings. With harvesters in particular, the average size of a tree has a significant impact on the machine productivity and fuel consumption (Jiroušek et al. 2007, Smidt and Gallagher 2013, Prinz et al. 2018). In other words, harvesters fuel consumption increases with the growth in a tree’s diameter, but the productivity increases relatively more per unit m3 at the same time. Therefore, fuel consumption per m3 decreases (Rieppo and Örn 2003). In forwarding, the haulage distance and forwarder payload volume affect most productivity and fuel consumption (Jiroušek et al. 2007, Manner et al. 2016, Berg et al. 2019). There are also other important factors that impact fuel consumption in wood harvesting: forest stand location, cutting technique, and forest stand area and removals (Smidt and Gallagher 2013). Furthermore, the skills and education of harvester operators have been found to significantly impact productivity and fuel consumption (Nordfjell et al. 2003, Kärhä et al. 2004, Ovaskainen et al. 2004, Klvac and Skoupy 2009, Ghaffariyan et al. 2018). However, based on the aims of this study and consequently the research data, it was not possible or necessary to investigate and determine the impacts of such specific factors on fuel consumption.
In a recent energy-efficiency study, wood-harvesting contractors evaluated that, from the energy-efficiency point of view, machine relocation distance (km) between harvesting stands is among the ten most significant factors (Haavikko et al. 2019). The average relocation distance of a machine between two forest harvesting stands was 26.3 km. This result is consistent with the results of other studies. Kuitto et al. (1994) found that the average relocation distance was 28 km. Recently, according to Haavikko et al. (2019), contractors determined that the average relocation distance was 26.2 km. In contrast, according to a study comparing Finnish and Swedish wood harvesting by Berg and Karjalainen (2003), the average distance between forest stands of wood harvesting in Sweden was considerably shorter, only 12 km (cf. Wildmark 2014).
The environmental analysis showed that there was a prominent difference in CO2 eq. emissions between the cutting methods. CO2 eq. emissions from the final fellings (3.8 kg/m3) were only half of the later thinnings emissions (6.3 kg/m3). In addition, the emissions from the first thinnings (8.1 kg/m3) were more than double the emissions caused by final fellings. Klvac and Skoupy (2009) investigated harvesters and forwarders GHG emissions in Ireland. The average CO2 figures measured for diesel (harvester 4.97 kg/m3 and forwarder 4.04 kg/m3) are near the results of this study. In addition, Berg and Karjalainen (2003) studied emissions in Finland and Sweden in the late 1980s and early 1990s. Since then, in two decades, the calculated CO2 emissions have substantially decreased per cubic meter, by 90% (including cutting, forwarding, and machine relocation). The main reasons for the reduction in emissions are certainly the same as the reasons for the reduction in fuel consumption (i.e., technological development of harvesters and forwarders to make them more productive and advances in engine technology of machines, but also the development of working methods and habits), not least the holistic transformation of wood harvesting into a fully mechanized process. According to Ackerman et al. (2017), CO2 emissions from harvesters are 1.71 kg/m3 and from forwarders 1.02 kg/m3, which is considerably lower than the results of previous studies. These results are examples of the effects of good harvesting conditions. Recently, Venäläinen et al. (2019) studied CO2 eq. emissions from wood procurement. The same calculation database (VTT’s Lipasto) was used in this study to calculate CO2 eq. emissions. The results are therefore comparable in this respect. CO2 eq. emissions between the cutting methods were relatively the same compared to these study findings, but there were small differences in the absolute values (0.8–1.0 kg CO2 eq./m3), which were caused by the trucks used to relocate forest machinery and harvester operators when they travelled between the harvesting sites.
The energy-efficiency model of wood harvesting was tested for improving the energy efficiency of operations and even reach the carbon-neutrality target with use of RESs in the forest industry. The indicator revealed that wood-harvesting operations (cutting, forwarding, and relocation) were carbon neutral (total harvesting including machine relocations: 100 and total harvesting excluding relocations: 108) (cf. Table 10). The results depicted that wood harvesting is fully carbon neutral. The calculations also compared the energy efficiency of the final-felling method of forests to the thinning methods, as it is important to investigate how much the different permissible methods of wood harvesting affect energy efficiency. The use of the final-felling method increased the average energy efficiency most effectively. The most efficient machines operated in the final fellings and produced an energy-efficiency value of 131 in wood harvesting in 2016. If the wood-harvesting machines are discussed separately, their energy efficiency increases with efficient cutting methods. For example, the energy efficiency of the load of the forwarder was 1.7-fold greater when the cutting method changed from first thinning to final felling. However, there were clear and quite large ranges in energy efficiencies between the wood-harvesting machines and supply chains of the different cutting methods. Consequently, the indicator revealed that the energy efficiency of the wood-harvesting chain is also dependent on the machines used. For instance, the differences in machine size provide a possibility to select operation alternatives. When considering the research conducted in the disciplines of fuel consumption and work productivity, it can be seen that there are also great differences in the harvesting conditions of forest stands. Together, these conditions affect vehicle optimization and scheduling alternatives of harvesting machine fleets. In this respect, the indicator gives harvesting contractors the possibility to plan and manage their vehicles in the wood-procurement area in the most energy-efficient way.
Based on the results of this study, practical solutions can be suggested to climate policy makers. With respect to the energy efficiency of wood harvesting, the goal to create a 100% carbon-neutral base can be achieved in the forest industry by utilizing renewable forest resources. Unfortunately, problems can occur if wood harvesting is limited for the sake of short-term benefits of a carbon sink policy. Many trees might die due to the lack of harvesting or due to forest fires pumping carbon into the climate, which are also warming the climate, accelerating climate change, and causing a shorter rotation of forest life. Therefore, intensive wood harvesting and silvicultural operations should be increased to secure the vital carbon sink of forests, for example, in Finnish conditions, for the 50-year rotation of balanced forestry towards a sustainable forest industry (Palander et al. 2020). As forests are the main absorber of carbon, sustainable forestry is undoubtedly necessary to achieving climate goals and adapting them to the current national economy.
5. Conclusions
This research provides a starting point for the development of energy-efficient wood procurement at Stora Enso WSF. The results give valuable information about the current use of harvesters and forwarders, as well as the allocation of forest machinery in practice. Furthermore, these results underline that it is important not only to focus on the fuel consumption and emissions of harvesters and forwarders, but also to understand the whole value chain, for example, including trucks that are used for machine relocations. More energy-efficient utilization of harvesters and forwarders by cutting method will be emphasized in the future. As the fuel consumption and productivity of forest machines are highly dependent on machine size, there is a need for information about how forest machines should be optimized to different stand types. To decrease fuel consumption and at the same time increase productivity and energy efficiency, it is necessary to investigate how harvesters and forwarders are currently used in wood-harvesting operations. Furthermore, the challenge for optimal use of harvesters is that often the same stand contains forest compartments or plots that require different treatments. In this case, even from the point of view of energy efficiency, it might not make sense to bring a separate harvester for each plot to be cut, which would be the most optimal for the dimensions of the trees in each plot. In addition, logging contractors operate in a limited operational area, making it financially possible for few contractors to maintain forest machines of many capacities. Thus, more contractors very commonly have the so-called general-purpose harvesters suitable for both thinning and final felling.
During past decades, Berg (1997) and Venäläinen et al. (2019), for example, have studied fuel consumption in wood harvesting, but all these studies are based on calculations. Therefore, on the contrary, it is essential to research fuel consumption of wood-harvesting machines based on real data. There is a need for more detailed research about the factors affecting the fuel consumption of harvesters and forwarders. To reduce fuel consumption and emissions and at the same time increase productivity, more research is needed on the factors that affect them and the significance of their impact. There are no large-scale long-term studies on fuel consumption and energy efficiency in the whole wood-harvesting system. Such a follow-up study would make it possible to deepen the issues raised in this study and to get a closer look at the variables that affect fuel consumption through different cutting methods. Furthermore, with further study, it would be possible to investigate the impact of harvesting conditions or forest machine operators on fuel consumption. In addition, a follow-up study on relocation trucks would give more detailed information on actual relocation distances, possible delays, and actual routes. Moreover, it would be useful to expand research to fuel consumption and GHG emissions of cars, which forest machine operators use for daily travel to harvesting stands. Furthermore, GHG emissions could be based on actual data measured. With development, the productivity of harvesters has increased, and emissions have decreased, but at the same time, the use of AdBlue has come to reduce GHG emissions. According to a study by Björheden (2019), AdBlue’s share of harvesters fuel consumption was determined in Sweden, depending on the harvester model and type. In the future, we should also research AdBlue’s total GHG emissions.
Acknowledgments
The authors would like to thank the Stora Enso company for the opportunity to use its real wood-harvesting data and especially Mr. Teppo Salmi for retrieving it from the ERP system by Stora Enso. We would also like to thank the forest machine entrepreneurs contracted by Stora Enso WSF for supplementing the machine information, as well as the forest machine manufacturers John Deere, Komatsu and Ponsse for helping in data checking.
6. References
ABC stations, 2015: Diesel, heating oil (for heating and diesel engine use), winter grade, Product Data Sheet. Available at: https://www.abcasemat.fi/fi/polttoaineet/tuotetiedot
ABC stations, 2017: Diesel, heating oil (for heating and diesel engine use), summer grade, Product Data Sheet. Available at: https://www.abcasemat.fi/fi/polttoaineet/tuotetiedot
Ackerman, P., Williams, C., Ackerman, S., Nati, C., 2017: Diesel Consumption and Carbon Balance in South African Pine Clear-Felling CTL Operations: a Preliminary Case Study. Croatian Journal of Forest Engineering 38(1): 65–72.
Alakangas, E., Hurskainen, M., Laatikainen-Luntama, J., Korhonen, J., 2016: Suomessa käytettävien polttoaineiden ominaisuuksia (Properties of fuels used in Finland). VTT Technology 278.
Berg, S., 1997: Some aspects of LCA in the analysis of forestry operations. Journal of Cleaner Production 5(3): 211–217. https://doi.org/10.1016/S0959-6526(97)00040-1
Berg, S., Karjalainen, T., 2003: Comparison of greenhouse gas emissions from forest operations in Finland and Sweden. Forestry 76(3): 271–284. https://doi.org/10.1093/forestry/76.3.271
Berg, S., Ersson, B.T., Manner, J., 2019: Distance driven and driving speed when forwarding during final felling in Central Sweden. Journal of Forest Science 65(5): 183–194. https://doi.org/10.17221/23/2019-JFS
Björheden, R., 2019: Uncovering the technical performance potential of CTL harvesters. Presentation. NB-Nord Conference: Forest Operations in Response to Environmental Challenges, June 3–5, Honne Conference Center, Bir, Norway.
Brunberg, T., 2007: Bränsleförbrukningen hos skördare och skotare vecka 13 och 39, 2006 (Fuel consumption of harvesters and forwarders during the weeks of 13 and 39, 2006). Arbetsrapport Från Skogforsk 629.
Brunberg, T., 2013: Bränsleförbrukningen hos skogsmaskiner 2012 (Fuel consumption in forest machines 2012). Arbetsrapport Från Skogforsk 789.
Brunberg, T., Granlund, P., Nordén, B., 2004: Bränslemätningar på skotare och skördare (Fuel metering of forwarders and harvesters). Arbetsrapport Från Skogforsk 585.
Dijkstra, E.W, 1959: A note on two problems in connexion with graphs. Numerische Mathematik 1: 269–271.
Directive 2012/27/EU of the European Parliament and of the Council of 25 October 2012 on Energy Efficiency, amending Directives 2009/125/EC and 2010/30/EU and repealing Directives 2004/8/EC and 2006/32/EC, 2012.
Domke, G.M., Walters, B.F., Nowak, D.J., Smith, J.E., Ogle, S.M., Coulston, J.W., Wirth, T.C., 2020: Greenhouse gas emissions and removals from forest land, woodlands and urban trees in the United States, 1990-2018. Resource Update FS-227. Madison, WI, USA, Department of Agriculture, Forest Service, Northern Research Station.
Energiatehokkuuslaki (Energy Efficiency Act in Finland) 1429/2014, 2014.
EPA, 2016: Direct Emissions from Mobile Combustion Sources. Greenhouse Gas Inventory Guidance. United States Environmental Protection Agency. Washington DC, USA.
Eriksson, M., Lindroos, O., 2014: Productivity of harvesters and forwarders in CTL operations in northern Sweden based on large follow-up datasets. International Journal of Forest Engineering 25(3): 179–200. https://doi.org/10.1080/14942119.2014.974309
European Commission, 2019: Report from the Commission to the European Parliament and the Council. Preparing the ground for raising long-term ambition EU Climate Action Progress Report 2019. COM(2019)559 final.
European Union, 2011: Communication from the Commission to the European Parliament, the Council, the European Economic and Social Committee and the Committee of the Regions: A Roadmap for moving to a competitive low carbon economy in 2050.
European Union, 2014: Communication from the Commission to the European Parliament, the Council, the European Economic and Social Committee and the Committee of the Regions: A policy framework for climate and energy in the period from 2020 to 2030. COM/2014/015 final.
Finnish Government, 2020: Programme of Prime Minister Sanna Marin’s Government 2019: Inclusive and competent Finland – a socially, economically and ecologically sustainable society. Available at: https://valtioneuvosto.fi/en/marin/government-programme
Ghaffariyan, M.R., Apolit, R., Kuehmaier, M., 2018: A Short Review of Fuel Consumption Rates of Whole Tree and Cut-To-Length Timber Harvesting Methods. Current Investigation in Agriculture and Current Research 5(2): 651–653. http://dx.doi.org/10.32474/CIACR.2018.05.000209
Greene, W.D., Biang, E., Baker, S.A., 2014: Fuel Consumption Rates of Southern Timber Harvesting Equipment. In: Proceeding of the conference of the 37th Council on Forest Engineering (COFE) Annual Meeting, 2014, Moline, IL, USA.
Haavikko, H., Kärhä, K., Hourula, M., Palander, T., 2019: Attitudes of Small and Medium-Sized Enterprises towards Energy Efficiency in Wood Procurement: A Case Study of Stora Enso in Finland. Croatian Journal of Forest Engineering 40(1): 107–123.
Hakkila, P., Saranpää, P., Kalaja, H., Repola, J., 2002: Suomalainen havukuitupuu - Laadun hallinta ja vaihtelu (Finnish softwood pulpwood - Quality management and variation). Finnish Forest Research Institute, Handout.
Holzleitner, F., Stampfer, K., Visser, R., 2011: Utilization Rates and Cost Factors in Timber Harvesting Based on Long-term Machine Data. Croatian Journal of Forest Engineering 32(2): 501–508.
Hudiburg, T.W., Law, B.E., Moomaw, W.R., Harmon, M.E., Stenzel, J.E, 2019: Meeting GHG reduction targets requires accounting for all forest sector emissions. Environmental Research Letters 14(9): 095005. https://doi.org/10.1088/1748-9326/ab28bb
Ihalainen, A., Vaahtera, E., 2019: Forest resources. In: Ihalainen, A., Mäki-Simola, E., Peltola, A., Sauvula-Seppälä, T., Torvelainen, J., Uotila, E., Vaahtera, E., Ylitalo, E., (Eds). Finnish forest statistics, Natural Resources Institute Finland, 17–40 p.
Jiroušek, R., Klvač, R., Skoupý, A., 2007: Productivity and costs of the mechanised cut-to-length wood harvesting system in clear-felling operations. Journal of Forest Science 53(10): 476–482. https://doi.org/10.17221/2088-JFS
Jylhä, P., Jounela, P., Koistinen, M., Korpunen, H., 2019: Koneellinen hakkuu: Seurantatutkimus (Mechanized cutting: Follow-up study). Natural Resources Institute Finland, Natural resources and bioeconomy studies 11/2019.
Kainulainen, J., Lindblad, J., 2005: Puutavaralajien tuoretiheyden alueellinen vaihtelu mittausasemien vastaanottomittauksessa (Regional variation in green density of timber assortments in receiving measurements at measuring stations). Working Papers of the Finnish Forest Research Institute 19.
Kauppinen, J., 2010: Puunkorjuuyritysten konesiirtojen toteutustavat, kustannukset ja ajanmenekit - Otos Pohjois-Savon puunkorjuuyrityksistä (Logging Companies Harvester Relocation Costs and Down Time Caused by Relocations). Bachelor Thesis, North Karelia University of Applied Sciences, Joensuu, Finland.
Klvac, R., Skoupy, A., 2009: Characteristic fuel consumption and exhaust emissions in fully mechanized logging operations. Journal of Forest Research 14(6): 328–334. https://doi.org/10.1007/s10310-009-0143-7
Kuitto, P.-J., Keskinen, S., Lindroos, J., Oijala, T., Rajamäki, J., Räsänen, T., Terävä, J., 1994: Mechanized cutting and forest haulage. Metsäteho, Tiedotus 410.
Kärhä, K., Rönkkö, E., Gumse, S.-I., 2004: Productivity and Cutting Costs of Thinning Harvesters. International Journal of Forest Engineering 15(2): 43–56. https://doi.org/10.1080/14942119.2004.10702496
Kärhä, K., Poikela, A., Rieppo, K., Imponen, V., Keskinen, S., Vartiamäki, T., 2007: Korjurit ainespuun korjuussa (Harvesting industrial roundwood with harwarders). Metsäteho, Report 200.
Lindblad J., Repola J., 2019: Mänty- ja koivukuitupuun tuoretiheys paino-otantamittauksessa ja tuoretiheyden mallinnus varastointiajan perusteella (Green density of Scots pine and birch pulpwood by weight sampling and modeling of green density based on storage time). Metsätieteen aikakauskirja 2019, 10101.
Lipasto database, 2017: Työkoneiden keskimääräinen päästö ja energia polttoainelitraa kohden Suomessa vuonna 2016 & Maansiirtoauto ilman perävaunua, Kokonaismassa 32 t, Kantavuus 19 t, Taajama, Katuajo, Keskimäärin, Vuosi 2016 (Average GHG emissions and energy of work machines per liter of fuel in Finland, 2016 & Earthmoving truck without trailer, Gross weight 32 t, Load capacity 19 t, Driving along density populated areas in Finland, 2016). VTT. Available at: http://lipasto.vtt.fi/yksikkopaastot
Manner, J., Nordfjell, T., Lindroos, O., 2016: Automatic load level follow-up of forwarders' fuel and time consumption. International Journal of Forest Engineering 27(3): 151–160. https://doi.org/10.1080/14942119.2016.1231484
Marjomaa, J., 1992: Puutavaralajien tuoretiheyksien vaihtelu (Variation in the weight of timber assortments). Metsäteho, Review 4/1992.
Masson-Delmotte, V., Zhai, P., Pörtner, H.-O., Roberts, D., Skea, J., Shukla, P.R., Pirani, A., Moufouma-Okia, W., Péan, C., Pidcock, R., Connors, S., Matthews, J.B.R., Chen, Y., Zhou, X., Gomis, M.I., Lonnoy, E., Maycock, T., Tignor, M., Waterfield, T., (Eds), 2018: Summary for Policymakers. Global Warming of 1.5°C. An IPCC Special Report on the impacts of global warming of 1.5°C above pre-industrial levels and related global greenhouse gas emission pathways, in the context of strengthening the global response to the threat of climate change, sustainable development, and efforts to eradicate poverty. IPCC. Available at: https://www.ipcc.ch/site/assets/uploads/sites/2/2019/05/SR15_SPM_version_report_LR.pdf
Metsäalan kone- ja autokustannusindeksi 2015 = 100, Käsikirja (Machine and truck cost index in forestry, 2015 = 100, Handbook), 2018: Statistics Finland.
Ministry of Agriculture and Forestry, 2019: The National Forest Strategy 2025 – an updated version Government Resolution of 21 February 2019. Publications of Ministry of Agriculture and Forestry in Finland 7/2019.
Neste, 2020a: Neste Polttoöljy talvilaatu (Neste Sulphur light fuel oil, winter grade), Technical Data Sheet. Available at: https://www.neste.fi/static/datasheet_pdf/160205_fi.pdf
Neste, 2020b: Neste Polttoöljy kesälaatu (Neste Sulphur light fuel oil, summer grade), Technical Data Sheet. Available at: https://www.neste.fi/static/datasheet_pdf/160360_fi.pdf
Nordfjell, T., Athanassiadis, D., Talbot, B., 2003: Fuel Consumption In Forwarders. International Journal of Forest Engineering 14(2): 11–20. https://doi.org/10.1080/14942119.2003.10702474
Official Statistics of Finland, 2019: Greenhouse gases. 2018, preliminary data. Statistics Finland, Environment and Natural Resources 2019. Available at: http://www.stat.fi/til/khki/2018/khki_2018_2019-12-12_tie_001_en.html
Ovaskainen, H., Uusitalo, J., Väätäinen, K., 2004: Characteristics and Significance of a Harvester Operators’ Working Technique in Thinnings. International Journal of Forest Engineering 15(2): 67–77. https://doi.org/10.1080/14942119.2004.10702498
Palander, T., Haavikko, H., Kärhä, K., 2018: Towards sustainable wood procurement in forest industry – The energy efficiency of larger and heavier vehicles in Finland. Renewable and Sustainable Energy Reviews 96: 100–118. https://doi.org/10.1016/j.rser.2018.07.043
Palander, T., Haavikko, H., Kortelainen, E., Kärhä, K., 2020: Comparison of Energy Efficiency Indicators of Road Transportation for Modeling Environmental Sustainability in »Green« Circular Industry. Sustainability 12(7): 2740. https://doi.org/10.3390/su12072740
Prinz, R., Spinelli, R., Magagnotti, N., Routa, J., Asikainen, A., 2018: Modifying the settings of CTL timber harvesting machines to reduce fuel consumption and CO2 emissions. Journal of Cleaner Production 197(Part 1): 208–217. https://doi.org/10.1016/j.jclepro.2018.06.210
Rajamäki, J., Kariniemi, A., Oijala, T., 1996: Koneellisen harvennushakkuun tuottavuus (Productivity of mechanized cutting). Metsäteho, Report 8.
Rieppo, K., Örn, J., 2003: Metsäkoneiden polttoaineen kulutuksen mittaaminen. Esitutkimus (Measuring the fuel consumption of forest machines. Preliminary study). Metsäteho, Report 148.
Seppänen, R., Kervinen, M., Parkkila, I., Karkela, L., Meriläinen, P., 2012: MAOL-tables. Otavan kirjapaino Oy, Helsinki, 1–167 p.
Smidt, M., Gallagher, T., 2013: Factors affecting fuel consumption and harvesting costs. Paper presented in 36th Council on Forest Engineering (COFE): Forest Operations for a Changing Landscape, Missoula, MT, USA.
Spinelli, R., de Arruda Moura, A.C., 2019: Decreasing the Fuel Consumption and CO2 Emissions of Excavator-Based Harvesters with a Machine Control System. Forests 10(1): 43. https://doi.org/10.3390/f10010043
Stora Enso, 2019: Stora Enso’s Policy for Energy and Carbon. Available at: https://www.storaenso.com/-/media/documents/download-center/documents/sustainability/policy-for-energy-and-carbon_2019.pdf
Stora Enso Wood Supply Finland, 2015: Energiatehokkuuden johtamisjärjestelmä ISO 50001. Stora Enso Metsä, Tavoitteet ja toimenpiteet (ISO 50001 Energy efficiency management system. Stora Enso Wood Supply Finland, Targets and measures). Stora Enso, Internal document.
Trade Association of Finnish Forestry and Earth Moving Contractors (1996–2016), 1996–2016: Koneyrittäjät Machine Catalogues.
Väätäinen, K., Asikainen, A., Sikanen, L., Ala-Fossi, A., 2006: The cost effect of forest machine relocations on logging costs in Finland. Forestry Studies 45: 135–141.
Väätäinen, K., Lappalainen, M., Asikainen, A., Anttila, P., 2008: Kohti kustannustehokkaampaa puunkorjuuta – Puunkorjuuyrittäjän uusien toimintamallien simulointi (Towards more cost-effective timber harvesting – Simulation of new operating models for a timber harvesting entrepreneur). Working Papers of the Finnish Forest Research Institute 73.
Väätäinen, K., Laitila, J., Hyvönen, P., Hirvelä, H., Packalen, T., Kankaanhuhta, V., 2019: Cut to length loggings and machine relocations in Eastern Finland - discrete event simulation study. Presentation. FORMEC 2019, Hungary/Austria, 6-9 October 2019. Available at: https://www.formec.org/images/proceedings/2019/presentations/A-0088.pdf
Väkevä, J., Kariniemi, A., Lindroos, J., Poikela, A., Rajamäki, J., Uusi-Pantti, K., 2001: Puutavaran metsäkuljetuksen ajanmenekki (Time consumption in forest haulage). Metsäteho, Report 123.
Venäläinen, P., Strandström, M., Poikela, A., 2019: Puun korjuun ja kuljetusten päästöjen nykytila ja vähennyskeinot (Current status and means of reducing emissions in wood harvesting and timber transportation). Metsätehon tuloskalvosarja 12/2019.
Wildmark, L., 2014: Flyttavstånd och flyttkostnader för skogsmaskiner samt ruttplanering hos Södra Skogsägarna (Forest machine relocation distances, costs and route planning at Södra Skogsägarna). Sveriges lantbruksuniversitet, Institutionen för skogens biomaterial och teknologi, Arbetsrapport 8/2014.
World Economic Forum, 2019: This infographic shows CO2 emissions all around the world. Available at: https://www.weforum.org/agenda/2019/09/global-carbon-dioxide-emissions-chart-of-day/
Ylitalo, E., 2019: Forest industries’ wood consumption. In: Ihalainen, A., Mäki-Simola, E., Peltola, A., Sauvula-Seppälä, T., Torvelainen, J., Uotila, E., Vaahtera, E., Ylitalo, E., (Eds). Finnish forest statistics, Natural Resources Institute Finland: 125–132 p.
© 2021 by the authors. Submitted for possible open access publication under the
terms and conditions of the Creative Commons Attribution (CC BY) license (http://creativecommons.org/licenses/by/4.0/).
Authors’ addresses:
Prof. Teijo Palander, PhD
e-mail: teijo.s.palander@uef.fi
University of Eastern Finland
Faculty of Science and Forestry
P.O. Box 111
80101 Joensuu
FINLAND
Kalle Kärhä, PhD
e-mail: kalle.karha@storaenso.com
Hanna Haavikko *
e-mail: hanna.haavikko@gmail.com
Mika Korvenranta
e-mail: mika.korvenranta@storaenso.com
Stora Enso
Forest Division
Forest Finland
P.O. Box 309
00101 Helsinki
FINLAND
Asko Poikela
e-mail: asko.poikela@metsateho.fi
Metsäteho Oy
Vernissakatu 1
01300 Vantaa
FINLAND
* Corresponding author
Received: July 2, 2020
Accepted: May 5, 2021
Original scientific paper