
Influence of Intelligent Boom Control in Forwarders on Performance of Operators
doi: 10.5552/crojfe.2022.965
volume: 43, issue:
pp: 18
- Author(s):
-
- Zemánek Tomáš
- Fiľo Petr
- Article category:
- Original scientific paper
- Keywords:
- hydraulic crane, forwarder, boom tip control, IBC
Abstract
HTML
This paper deals with the influence of an Intelligent Boom Control (IBC) in forwarders on the work of operators. The work with the IBC and standard system of crane control was measured by the use of a John Deere harvester and forwarder simulator. Two individuals without any practical training and two individuals with experience in the control of the crane took the measurements. The monitoring included eight different performance indicators. The use of the IBC system allowed the untrained operators to increase their work output by 27. With the use of the IBC system, these individuals also showed 53% fewer direct damages to the machine. However, our findings show that the length of experience influenced the performance of the operators out of all the monitored indicators. Notwithstanding that fact, the use of the IBC system has a direct positive influence on the economy of the machine operation.
Influence of Intelligent Boom Control in Forwarders on Performance of Operators
Tomáš Zemánek, Petr Fiľo
Abstract
This paper deals with the influence of an Intelligent Boom Control (IBC) in forwarders on the work of operators. The work with the IBC and standard system of crane control was measured by the use of a John Deere harvester and forwarder simulator. Two individuals without any practical training and two individuals with experience in the control of the crane took the measurements. The monitoring included eight different performance indicators. The use of the IBC system allowed the untrained operators to increase their work output by 27
. With the use of the IBC system, these individuals also showed 53% fewer direct damages to the machine. However, our findings show that the length of experience influenced the performance of the operators out of all the monitored indicators. Notwithstanding that fact, the use of the IBC system has a direct positive influence on the economy of the machine operation.
Keywords: hydraulic crane, forwarder, boom tip control, IBC
1. Introduction
Worldwide, approximately 20% of timber is harvested by using the fully mechanized short-length logging method (Ponsse 2018). The share of this assortment method in the total volume of harvested timber has been continually growing in Europe, exceeding 90% in some northern countries (Finland, Sweden). In other European countries, the share is lower due to different natural conditions and dissimilar historical development of forestry. The Information of Forests and Forestry in the Czech Republic (Ministry of Agriculture of the Czech Republic 2019) states that in 2018 the share of the assortment method in the total volume of harvested timber amounted to 32% in the Czech Republic.
Forwarders are typical representatives of the fully mechanized short-length logging method for primary timber transport in the locality of stump – roadside landing. Forwarders are technically advanced machines, the development of which is particularly focused on the fields of telematics, design of chassis, drive and hydraulic cranes in multinational manufacturing corporations. The machine-operator interaction is also an important field of innovation. In this sense, the development focuses on exploring operator workload, fatigue and skill, as well as on the safety and automation of routine work operations.
Hydraulic crane handling occupies a significant part of the forwarder operator's work cycle. The wide range and fluctuation of the share of hydraulic crane handling in the total operator's work cycle mentioned in the literature is especially affected by operator's skills, cargo volume, parameters of loaded logs, their concentration on the site and by the extraction distance. Sánchez-García et al. (2016) state that the time-share of hydraulic crane handling within a work cycle consisting of primary transport of logging residues is 48.3%. Proto et al. (2018) mention 67.2% in the primary transport of roundwood logs in coniferous stands, and Ghaffariyan (2012) claims even 80% in the primary transport of coniferous pulpwood. It follows therefore that, in order to increase the productivity of primary transport by forwarder, it is expedient to focus on the most time-consuming part of the work cycle – load handling. Travel between the forest stand and roadside landing can also be another time-consuming part of the forwarder's work cycle. However, this issue is beyond the scope of this article.
Most of the above parameters, which influence the amount and proportion of time spent operating a hydraulic crane with a load in preparation, are often based on the logging conditions of specific worksites. Capabilities and skills of the operator controlling the hydraulic crane have a direct influence on the work performance as well as on the damages caused by log handling to the machine or trees in the forest stand. Operator's work experience can be hardly affected over a short time horizon; however, optimization of workplace ergonomics with special attention to intuitive control of hydraulic crane and to increased automation of routine work operations should be feasible. The system of boom tip control (BTC) is a partial method for optimizing automated work with hydraulic crane.
In 2013, John Deere Forestry introduced their own BTC system under the commercial name Intelligent Boom Control for forwarders. In 2017, the system was also adapted to harvester work cycles. According to Operator's Instructions (DEERE & COMPANY 2017), the main advantages of the system are continuity, precision and simplicity of control, work productivity with the hydraulic crane increased by up to 10%, and extended service life of the machine. The main components of the IBC system in forwarders are sensors of the position of hydraulic crane booms built in the hydraulic cylinders, MECA (RFC) control unit and software. In addition, the IBC system features integrated damping of all main directions of the movement of hydraulic crane booms. Electronic end stops of pistons reduce small undesirable movements of hydraulic crane caused by the operator. This function prevents impact load on the hydraulic crane in end positions, thus protecting the hydraulic cylinders and hydraulic crane construction. The IBC system also provides a function regulating the speed of hydraulic crane boom tip during handling operations in the horizontal plane.
Working with the IBC-equipped hydraulic crane, the operator uses joysticks to control only the speed of movement and the boom tip position. In order to reach the required speed and movement direction of the hydraulic crane, speed of movement is calculated by software for each piston by means of linear optimization. The operator controls horizontal and vertical boom tip movements by the left and right joystick, respectively. In this case, the hydraulic crane is controlled as a unified whole. By contrast, in the standard mode of hydraulic crane control, the operator controls individually the movements of the main arm, knee-action arm and telescopic arm to achieve the correct speed and position of hydraulic crane boom tip.
In working with the IBC system IBC (Fig. 1), the hydraulic cylinders with the built-in sensors provide information about the movement of arms by means of CAN bus into the rear MECA control unit. In the machine control system, the IBC sensors are defined under the CAN 3 bus of sensors. The rear MECA (RFC) control unit can process inputs from the sensors on the hydraulic cylinders and compare the data by means of controller algorithms with inputs provided by the operator by means of commands through joysticks. Based on results, the IBC system gives independent commands for valve control to the valve of the crane arm (DEERE & COMPANY 2017).
In this paper, the following assumptions are verified:
Þ as compared with the standard system of hydraulic crane control, the IBC system increases work productivity of forwarder operators
Þ the use of IBC system is particularly beneficial for less experienced operators
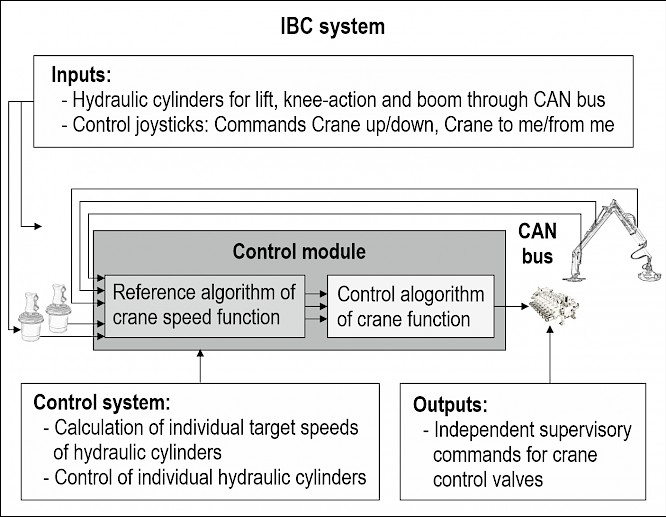
Fig. 1 Basic principles of IBC system work (DEERE & COMPANY)
Simulators are increasingly more used for training individuals in many fields of human activities such as road traffic, aviation, agriculture or forestry. Using a simulator represents a safe and economical alternative to the training of new drivers in real conditions. The same reasons also apply to using simulators for scientific purposes where the main advantages include experiment repeatability and easy collection of data.
In this connection, many authors deal with the portability of data obtained from the simulator into the real environment. Deniaud et al. (2015) state that, although the physical validity of simulators is continually improving, their psychological and behavioural validity remains problematic. Sophisticated simulators of high physical validity (original cabin and seat, instrumentation and dynamic base of the simulator) are relatively expensive; nevertheless, their use can positively influence the validity of obtained results. Burnett et al. (2007) state that drivers tested in the simulator with a real cabin showed higher situation awareness and more conservative driving style than drivers tested in the simulator only equipped with a control panel. During the work on the simulator, Burnett et al. (2007) did not observe health problems like sickness, giddiness or headache among operators. Such complications can severely affect capabilities of drivers (Klüver et al. 2016). According to Wang et al. (2010), however, the use of high physical validity simulators is not necessary for obtaining useful information about how a person will act in the concrete situation. Some authors verify the simulator validity by comparing travelling speed with the real environment. Branzi et al. (2017) used this method to test the predicted efficiency of safety measures in the city traffic. Yan et al. (2012) compared the speed of drivers in the real environment of controlled road intersection with its true copy in the simulator environment.
Nonetheless, the literature search offers a relatively wide spectrum of positive effects of simulator use. There are for example studies assessing the relation between the age of drivers and the vehicle control. Marlenga et al. (2017) tested by means of a simulator how the age of adolescents affects safety of agricultural tractor control. Lee and Winston (2016) explored the relation between the stress of young drivers induced by complicated traffic situation and their capability of safe driving. Matas et al. (2016) evaluated expedience of simulator employment in testing old-age drivers. Klüver et al. (2016) studied the behaviour of drivers on simulators with the fixed and movable base finding a significant interaction between age and gender in simulators with the fixed base. This interaction was not confirmed in simulators with the movable base and during tests in real road traffic conditions. The influence of driver's attention concentration on the safety of driving is another group of tasks tested on simulators. Reimer and Mehler (2011) and Wandtner et al. (2016) investigated whether the safety of vehicle control was affected when drivers fulfilled cognitive tasks not related to driving. Shechtman et al. (2009) compared errors made by drivers on the simulator and in the real environment. De Winter et al. (2009) assessed the relation between results of drivers travel on the simulator and their driving quality in real traffic. Another domain of research focuses on control elements and information interface in the vehicle. Wang et al. (2010) dealt with the control of vehicle information interface and evaluated the validity of data obtained on the simulator and in the vehicle in real road traffic. With the use of a simulator, Naujoks et al. (2015) tested the assistance travel systems in connection with the time during which the driver's hands are not on the wheel in relation to the safety of vehicle control.
On the other hand, the authors of the following studies did not confirm the positive validity of data obtained from the simulator or established it with some reservations. Zöller et al. (2015) dealt with a possibility to simulate prevention of road accidents due to non-compliance with safe distance (rear-end collisions). The validity was not confirmed because of missing vestibular feedback from simulator drivers. Bellem et al. (2017) tested the use of simulator with the movable base to study the comfort of autonomous driving of vehicles. They concluded that the validity of results obtained from the simulator depends very much on parameters of the motion system of simulator base when the speed is underestimated in the virtual environment. Helland et al. (2013) dealt with a possibility of using the simulator to evaluate driving capabilities of drivers under the influence of alcohol. One of the problems was that drivers on the simulator did not quite perceive the danger. In their work focused on the use of simulator in the research of drivers reactions while driving sleepy, Hallvig et al. (2013) claim that working on the simulator evokes higher levels of sleepiness in the drivers than real road traffic conditions.
Simulators are also frequently used in forestry, namely the harvester or forwarder simulators with the fixed or movable base, possibly also more cost efficient laptop simulators equipped only with armrests with control elements. Ovaskainen (2005) sees main shortcomings of harvester simulators especially in the operator's view of the workspace, in the simulation of the working stage of felling, in the insufficient interaction of cut/standing trees (damage during felling or delimbing) and in the action of dynamic forces in the virtual environment. The author arrived at these conclusions comparing the work of harvester operators in thinning and main felling operations on the simulator and in the real forest stand.
Training of novice operators is a typical example of the commercial use of harvester and forwarder simulators in forestry. Advantages are mentioned by Lopes et al. (2008), who monitored the training of 39 future harvester operators on the simulator. The authors see the beneficial effect especially in the increasing performance of operators during the training. Testing the performance of operators on the simulator in diverse working conditions and using different working procedures is a frequent theme of many scientific works. Ackerman et al. (2016) investigated, in the simulator environment, the way in which the planting distance of pine affects the follow-up operator's performance in thinning operations and their costs. Martins et al. (2009) studied a similar issue on the simulator and in the real stand in eucalypt plantations. Ovaskainen et al. (2011) explored the influence of three different procedures of logging by harvester in thinning and final felling operations on the total working efficiency. Palander et al. (2012) used the simulator to analyze work procedures of five harvester operators in relation to their working efficiency and fuel consumption. Da Silva Lopes et al. (2010) compared the performance of 26 operators with no practical experience during the training on the forwarder simulator.
Other themes of scientific studies using simulators include e.g. the physical, physiological and mental loads on operators during some work operations (Dvořák et al. 2016, Fiľo 2014), optimization of bucking by the harvester measuring system (Kivinen 2006) or accuracy of the manual recording of time studies taken by individuals with varying levels of training as compared with the automatic data collection (Nuutinen et al. 2008).
The time of working with the hydraulic crane constitutes a major part of the working cycle of forwarder operators. Studying the possibilities of the automation of these work operations has therefore become a subject of interest since the late 1980s and early 1990s. Löfgren, Wikander (2009) studied the kinematic driving strategy in order to achieve the maximum lifting capacity suitable for PC-controlled hinged hydraulic cranes. Lindroos et al. (2015) analyzed various sensing technologies to estimate the harvester head position and discussed their pros and cons with respect to potential applications, accuracy and costs. Automation of routine operations in the hydraulic crane control can increase the performance of forwarder operators within a relatively short time. The fact was recently confirmed by e.g. Manner et al. (2017), who compared in their study the system of boom tip control (BTC) with the standard mode of hydraulic crane control. The aim of their work was to find whether the BTC system makes the hydraulic crane control easier and whether it affects the slope of a curve of learning in novice crane operators. According to their results, there was no significant difference between the two systems in the learning curves; however, the BTC system increased the productivity of the work of operators and simplified the hydraulic crane control.
2. Materials and Methods
All measurements were taken in the laboratory of the Department of Engineering, Faculty of Forestry and Wood Technology, Mendel University in Brno, in which the simulator of harvester and John Deer forwarder version 3.2 with the fixed base and TimberMatic H12 measuring and control system is installed. The room features a relatively constant temperature of 22–24˚C (Boucsein 2012, Dawson et al. 2007, Wever 1979), air humidity of 40–60%, illumination intensity ranging from 700–900 lx and noise level that was in all cases of measurements lower than 50 dB. Since the working conditions (outdoor temperature, air humidity, illumination intensity and noise level) were the same for all operators, their possible influence on the results of measurements was presumed to be the same (Kramer 1990, Wever 1979). The measurements were taken from March to September 2015. Four examined individuals – two beginners and 2 experienced forwarder operators aged 23–41 years (students and employees from the Faculty of Forestry and Wood Technology, Mendel University in Brno) attended the research. The length of their practice with the hydraulic crane was 0, 1, 52 and 61 months. In order to prevent possible distortion and hence erroneous experimental results, all probands were strictly forbidden to use alcohol and other addictive drugs minimally for two days before the measurements (Mulder L. and Mulder G. 1987). They were informed about this requirement in advance. On the day of measurement, the research participants were to follow the standard drinking and eating regime including a lunch break of minimally half an hour.
The examined individuals had to load and unload 4 m long logs in the environment of forwarder simulator without travels on the site. Each of the individuals got through a total of 4 days working on the simulator – two days with the use of IBC system and 2 days with the standard system of hydraulic crane control. The steering methods (IBC, standard) alternated every day and the order of these methods (determination of the first method for the first day of measurements) was different for each operator. This procedure was adopted to eliminate as much as possible the influence of skill and order of days (impact of fatigue, monotonous work, biorythms and cognitive loads, see Dawson et al. 2007, Wever 1979). It is known that with a new task, performance improves at the beginning through conscious training and becomes stable at its optimum (the negative acceleration curve, see Sternberg 2011). After that, it fluctuates according to the degree of automation (habituation), oscillations of attention (Chmelař and Osecký 1974) and also according to the task characteristics (difficulty, see Sternberg 2011) – in our case IBC and standard steering methods. This is why the reduced reliability of measurements given by the small sample of operators was in this area compensated for by the increased number of measuring days and duration of individual measurements (on average 8–9 hours in a day). The examined individuals knew nothing about the purpose of the experiment, neither were they informed about their performance to prevent a possible feedback impact. According to the described research design, the following categorized variables (either dichotomized or including three to four categories) were established as independent factors: method of hydraulic crane control (standard and IBC), practice (two examined individuals with no practice and two individuals with experience in hydraulic crane control), day of measurement (first, second, third and fourth) and time interval of measurement (downstream records from individual partial 20 min. sections were connected into consistent time slots lasting about four hours in the morning and in the afternoon – half-a-day work shifts). The work section of 20 minutes was chosen for technical reasons of data recording in the simulator as mentioned below. For example, the below mentioned Parallel and Control performance indicators are continually updated with the improving skills of the operator, and for the Loading and Unloading performance indicators, data are recorded only for the last load or unload of logs.
The programme used to evaluate the work of operators on the simulator was Score Editor, Version 3.2.0, which allows to monitor the below performance indicators. The first one-word expression is the designation of performance indicator in tables and graphs; its explanation follows.
Þ Time: time of work with the hydraulic crane in minutes within a defined work cycle including hydraulic crane base slewing, movements of main, swing and telescopic arms, grapple turning, opening and closing. As compared with the beginner, the skilled operator shows a lower share of miscellaneous time during loading or unloading and a higher share of work with the hydraulic crane.
Þ Parallel: average number of simultaneous movements of hydraulic crane and grapple. Types of movements are described above (see Time). More experience in controlling the hydraulic crane is seen in a higher number of simultaneous movements.
Þ Control: skill in steering the hydraulic crane is a dimensionless variable with values ranging between 0–1 to two decimal positions. The simulator programme will compute an optimum hydraulic crane trajectory for the performed work operation and number 1 classifies the operator complying with the trajectory; if he deviates from the trajectory, the classification is proportionally decreased.
Þ Errors: a sum of below listed errors made by the operator inappropriately handling hydraulic crane or the grabbed logs – damage to cabin, front bars of cargo space, stanchions and other forwarder parts, damage to standing trees.
Þ Loading: quality of the alignment of log butt ends loaded in the forwarder cargo space including possible log crossing is a dimensionless variable with values ranging between 0–1 to two decimal positions. If the alignment of log butt ends is flawless and without crossing, the operator is classified with 1.
Þ Unloading: quality of the alignment of butt ends of logs unloaded in the stack including possible log crossing is a dimensionless variable with values ranging between 0–1 to two decimal positions. If the alignment of log butt ends is flawless and without crossing, the operator is classified with 1.
Þ Logs: number of logs displaced within a defined work cycle (20 minutes). As compared with less experienced operators, experienced operators can move a greater number of logs thanks to more skilful handling of the hydraulic crane and a higher number of grabbed logs.
Þ Trajectory: ratio of the track in metres, circumscribed by the hydraulic crane boom tip during a defined work cycle and the number of logs displaced in that cycle. As compared with beginners, experienced operators have the track shorter thanks to labour saving movements of the hydraulic crane in handling the logs.
The data was evaluated by using the SPSS (version 20) and Statistica (version 12) statistical-analytical softwares. Within the statistical analysis, we used the following tests of distribution normality of descriptive statistics: Shapiro-Wilk W test, Lilliefors test for normality, goodness of fit tests (One Sample Kolmogorov-Smirnov test and Chi-squared test). To compare differences of mean values, we used ANOVA, MANOVA and control T-tests (for independent data files) and their non-parametric analogue of Mann Whitney test of two sample means, Two Sample Kolgomorov–Smirnov test (to verify the Mann-Whitney test) and Kruskal-Wallis multiple sample test. With respect to a relatively low number of N, the check appeared to be useful because MANOVA uses the number of N derived from the variable with the lowest number of N for comparing the groups, while all the other tests are the opposite (T-tests, Mann-Whitney and Kolmogorov-Smirnov tests perform the calculations from all available valid N values). In our case, the difference is usually approximately 60 N (minimum and maximum in the method of hydraulic crane control is N – 36 and N – 96, respectively), which affects the significance of some findings. Mutual (control) findings obtained through parametric and non-parametric methods then match in significance except for some small deviations.
Since the data did not always show normal distribution, we decided for a more detailed comparison of medians, means and retransformed means by using Box-Cox transformation. We also took into account the range of quartile values with the data distribution being also assessed based on box diagrams (box plots), P-P graphs, Q-Q graphs, histograms and/or Levene's test. From the analysis of histograms, it seems that the »abnormal« data distribution is given by experience in some performance indicators because these performance indicators exhibit two altogether normally distributed »peaks of Gaussian shape« (respondents without/with experience).
From the P-P graphs and maximum values, we detected a regular occurrence of two outliers that can be considered as systematic (systematic error) and, therefore, we eliminated them from further analyses. The mentioned two outliers are the first two 20-min. measurements taken on the first day in the first examined person with the lowest length of practical experience and so the data can be taken for training. After their removal, the values of data skewness and kurtosis would markedly decrease and the normality of data distribution would markedly increase (P-P graphs); the respective data (medians, means) in the quartiles thus acquiring standard error comparable with the Gaussian distribution.
We used MANOVA to examine differences among the mean values of all performance indicators both in connection with the factors of experience, the methods of hydraulic crane control (standard, IBC), which were defined as so-called internal effect factors, and in connection with factor featuring a so-called intergroup effect that included the day of measurement and the time interval of measurement. As a matter of course, we examined also their potential interactions affecting the performance indicators. In other words, we analyzed both the main effects of the factors, and their interactions (amplifying or attenuating influence) of two fixed factors that may manifest in the values of performance indicators.
By means of stepwise linear regression (for a partial verification of the validity of this method, we used scatter diagrams and a histogram for standardized residuals according to which the suitability of this method was to a certain extent confirmed), we searched the degree of continuity (effect) of research factors-predictors with the indicators of operators performance, investigating the specification of extent to which the effect can be attributed to the factors while maintaining a linear relationship. In short, we investigated the share of the research factors in differences among the mean values of operators performance indicators (by means of the so-called standardized Beta coefficients) and to what extent the share can be explained by means of these factors (by using the so-called coefficient of multiple R2 determination).
3. Results
In this descriptive part of our paper, we present Table 1 with basic descriptive data (means and standard errors) of eight partial indicators of operators' performance in the course of their work on the forwarder simulator. Descriptive data of the performance indicators of four examined operators (two operators no. 1 and 2 without training and two experienced operators no. 3 and 4) and descriptive data of performance indicators achieved in the respective days of measurement are presented only for hydraulic crane control by the IBC system because the descriptive data for the standard method are different. This data reflects the »influence« of experience (values of the first and second operators without training as compared with the values of the third and fourth operators with experience) and the »effect« of the operators’ learning in the respective days of measurement (the first day was omitted after the removal of outliers due to lesser data). The values of means and standard errors in the performance indicators of AM and PM measurements are calculated from both methods of hydraulic crane control because they do not differ too much according to this criterion (factor of the method of hydraulic crane control). Numbers of measurements (N) are presented both by research factors (according to results achieved in the individual operators, days of measurement, time intervals of measurements and method of hydraulic crane control), and by performance indicators, which do not have the identical number of measurements (N) because due to a technical failure, some data of performance indicators could not be recorded (the fourth operator in the second day of measurement). Hence, the Time, Parallel, Control and Errors performance indicators have the number of measurement different from the performance indicators of Loading and Unloading, Logs and Trajectory.
Fig. 2 presents the values of performance indicators divided according to the method of hydraulic crane control (standard and IBC) and according to the performance of each operator. Operators can be divided according to the length of experience into two beginners without training and two advanced operators with the experience of 52 and 61 months, respectively. In order to be able to compare the values of individual performance indicators in Fig. 2, the original values were converted to Z-scores (containing positive and negative values with a maximum of ca. +1.5, minimum ca. -1.5 and middle of approx. 0).
Table 1 Descriptive data from working with IBC method and from both methods of hydraulic crane control (standard and IBC)
|
Performance indicators |
IBC only |
IBC only |
Both methods |
|||||||||
|
Operators 1 and 2 (without), Operators 3 and 4 (with) experience |
Day of measurement |
Time of measurement |
Method of control |
|||||||||
|
Operator 1 |
Operator 2 |
Operator 3 |
Operator 4 |
Day 2 |
Day 3 |
Day 4 |
AM |
PM |
Stnd |
IBC |
||
|
Time |
Means |
11.66 |
12.86 |
16.44 |
16.62 |
16.63 |
14.04 |
13.90 |
14.06 |
15.57 |
14.77 |
14.40 |
|
SD |
1.43 |
0.92 |
0.61 |
0.48 |
0.55 |
2.24 |
2.52 |
2.34 |
1.67 |
2.11 |
2.37 |
|
|
Parallel |
Means |
2.28 |
2.25 |
2.80 |
2.79 |
2.78 |
2.48 |
2.49 |
2.05 |
2.25 |
1.69 |
2.53 |
|
SD |
0.08 |
0.11 |
0.07 |
0.05 |
0.05 |
0.29 |
0.26 |
0.54 |
0.41 |
0.30 |
0.28 |
|
|
N |
24 |
24 |
24 |
24 |
15 |
46 |
35 |
124 |
64 |
92 |
96 |
|
|
Control |
Means |
0.57 |
0.58 |
0.62 |
0.61 |
0.61 |
0.59 |
0.59 |
0.58 |
0.61 |
0.58 |
0.60 |
|
SD |
0.05 |
0.02 |
0.03 |
0.02 |
0.02 |
0.04 |
0.04 |
0.05 |
0.04 |
0.06 |
0.04 |
|
|
Errors |
Means |
3.67 |
2.88 |
1.42 |
0.96 |
0.93 |
2.83 |
2.00 |
3.40 |
2.02 |
3.66 |
2.23 |
|
SD |
3.16 |
2.09 |
1.06 |
1.00 |
1.10 |
2.75 |
1.64 |
3.91 |
2.68 |
4.48 |
2.28 |
|
|
Load |
Means |
0.23 |
0.46 |
0.58 |
– |
– |
0.42 |
0.43 |
0.40 |
0.47 |
0.41 |
0.42 |
|
SD |
0.24 |
0.23 |
0.15 |
– |
– |
0.25 |
0.25 |
0.28 |
0.25 |
0.29 |
0.25 |
|
|
N |
12 |
12 |
12 |
– |
– |
20 |
16 |
55 |
18 |
37 |
36 |
|
|
Unload |
Means |
0.08 |
0.18 |
0.39 |
– |
– |
0.11 |
0.35 |
0.17 |
0.19 |
0.13 |
0.21 |
|
SD |
0.10 |
0.16 |
0.37 |
– |
– |
0.13 |
0.33 |
0.26 |
0.27 |
0.25 |
0.27 |
|
|
Logs |
Means |
37.46 |
54.58 |
89.38 |
– |
– |
59.98 |
61.09 |
57.56 |
75.22 |
63.72 |
60.47 |
|
SD |
9.06 |
12.23 |
8.55 |
– |
– |
23.68 |
24.57 |
25.88 |
26.14 |
29.83 |
23.91 |
|
|
N |
24 |
24 |
24 |
– |
– |
40 |
32 |
107 |
37 |
72 |
72 |
|
|
Trajectory |
Means |
18.95 |
15.90 |
10.83 |
– |
– |
15.59 |
14.77 |
17.07 |
13.48 |
17.07 |
15.23 |
|
SD |
3.65 |
3.43 |
0.76 |
– |
– |
4.18 |
4.77 |
6.92 |
4.08 |
7.97 |
4.44 |
|
The power of differences in the average values of performance indicators in response to IBC and standard steering methods is usually expressed by standardized effects (Es) and power calculations (power). In spite of a low number of all N (4), relatively high values of these quantities are found in the performance indicator parallel where power is 0.369 and Es is 2.897. The second highest values of power = 0.058 and Es = 0.423 were recorded in the performance indicator errors.
Findings from Fig. 2 are documented by data presented in Tables 2 and 3. We included only statistically significant data (acquired through the T-test and Mann-Whitney test) informing about significant differences in the mean values of respective performance indicators, which were calculated separately for the group of two operators without training and for the group of two experienced operators.
The data in Tables 2 and 3 cannot be considered decisive for the confirmation of our two basic assumptions because the significant differences of the mean values of performance indicators given by the methods of hydraulic crane control are not affected by other independent variables (length of experience, day of measurement, time interval of measurement). Notwithstanding this fact, we present them for practical reasons because they provide more insight into dissimilarities in controlling hydraulic crane between the examined individuals without training and experienced individuals. As compared with the more experienced operators, the operators without training show a higher number of performance indicators with significant differences in their mean values relating to the methods of hydraulic crane control.
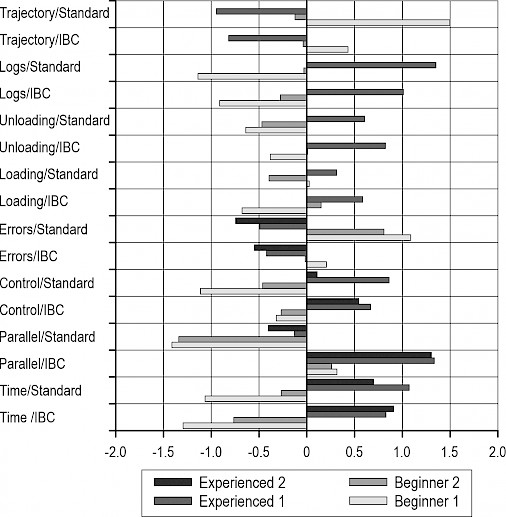
Fig. 2 Values (Z-scores) of performance indicators of operators divided according to the method of hydraulic crane control (standard and IBC) and according to the performance of each operator (operator´s experience)
Table 2 Descriptive data and statistically significant differences among performance indicators as related to the methods of hydraulic crane control used by operators without training
|
Method of control |
T-test: Equal variances assumed |
Operators without training |
||||||||||
|
Performance indicators |
Parametric test |
Nonparametric test |
Descriptives |
|||||||||
|
Independent Samples Test |
||||||||||||
|
T-test for Equality of Means |
Mann-Whitney U |
Wilcoxon W |
Z |
Asymp. Sig. (2-tailed) |
N |
Mean |
Std. Deviation |
|||||
|
t |
df |
Sig. (2-tailed) |
Mean Difference |
|||||||||
|
Standard |
Time |
4.18 |
92 |
0.000 |
1.03 |
581.00 |
1757.00 |
-3.96 |
0.000 |
46 |
13.29 |
1.02 |
|
IBC |
– |
– |
– |
– |
– |
– |
– |
– |
– |
48 |
12.26 |
1.33 |
|
Standard |
Parallel |
-43.63 |
92 |
0.000 |
-0.84 |
0.00 |
1081.00 |
-8.35 |
0.000 |
46 |
1.43 |
0.09 |
|
IBC |
– |
– |
– |
– |
– |
– |
– |
– |
– |
48 |
2.27 |
0.10 |
|
Standard |
Control |
-2.19 |
92 |
0.031 |
-0.02 |
848.50 |
1929.50 |
-1.94 |
0.052 |
46 |
0.56 |
0.04 |
|
IBC |
– |
– |
– |
– |
– |
– |
– |
– |
– |
48 |
0.58 |
0.04 |
|
Standard |
Errors |
4.36 |
92 |
0.000 |
3.14 |
518.00 |
1694.00 |
-4.47 |
0.000 |
46 |
6.41 |
4.18 |
|
IBC |
– |
– |
– |
– |
– |
– |
– |
– |
– |
48 |
3.27 |
2.68 |
|
Standard |
Unloading |
-2.79 |
44 |
0.008 |
-0.09 |
140.00 |
393.00 |
-2.98 |
0.003 |
22 |
0.03 |
0.08 |
|
IBC |
– |
– |
– |
– |
– |
– |
– |
– |
– |
24 |
0.13 |
0.14 |
In connection with the methods of hydraulic crane control, the performance indicators of Time, Control and Unloading differ significantly only with the operators without training: as compared with the standard method, lower values of Time appear in the hydraulic crane IBC control system. By contrast, the performance indicators of Control and Unloading exhibit significantly higher values in this group of probands. With the use of IBC method, the operators with experience reach significantly lower values in the Logs performance indicator and higher values in the Trajectory performance indicator, compared with the standard method of hydraulic crane control.
The performance indicators of Parallel and Errors deserve a special attention because their dissimilarities relate both to the methods of hydraulic crane control, and to the operators' length of experience. In addition, they are so big that they were detected even by using MANOVA (Table 4).
Table 3 Descriptive data and statistically significant differences among performance indicators as related to the methods of hydraulic crane control used by experienced operators
|
Method of control |
T-test: Equal variances assumed |
Experienced operators |
||||||||||
|
Performance indicators |
Parametric test |
Nonparametric test |
Descriptives |
|||||||||
|
Independent Samples Test |
||||||||||||
|
T-test for Equality of Means |
Mann-Whitney U |
Wilcoxon W |
Z |
Asymp. Sig. (2-tailed) |
N |
Mean |
Std. Deviation |
|||||
|
t |
df |
Sig. (2-tailed) |
Mean Difference |
|||||||||
|
Standard |
Parallel |
-48.42 |
90 |
0.000 |
-0.80 |
0.00 |
990.00 |
-8.26 |
0.000 |
44 |
1.99 |
0.10 |
|
IBC |
– |
– |
– |
– |
– |
– |
– |
– |
– |
48 |
2.79 |
0.06 |
|
Standard |
Errors |
-1.99 |
90 |
0.049 |
-0.44 |
765.00 |
1755.00 |
-2.42 |
0.016 |
44 |
0.75 |
1.06 |
|
IBC |
– |
– |
– |
– |
– |
– |
– |
– |
– |
48 |
1.19 |
1.04 |
|
Standard |
Logs |
3.59 |
46 |
0.001 |
9.04 |
128.00 |
428.00 |
-3.30 |
0.001 |
24 |
98.42 |
8.90 |
|
IBC |
– |
– |
– |
– |
– |
– |
– |
– |
– |
24 |
89.38 |
8.55 |
|
Standard |
Trajectory |
-3.42 |
46 |
0.001 |
-0.83 |
118.00 |
418.00 |
-3.51 |
0.000 |
24 |
10.01 |
0.91 |
|
IBC |
– |
– |
– |
– |
– |
– |
– |
– |
– |
24 |
10.83 |
0.76 |
Table 4 Results obtained from MANOVA
|
Tests of Between-Subjects Effects |
||||||
|
Source |
Type III Sum of Squares |
df |
Mean Square |
F |
Sig. |
|
|
Intercept |
Time |
.701 |
1 |
.701 |
4.477 |
.038 |
|
Parallel |
.199 |
1 |
.199 |
10.326 |
.002 |
|
|
Time interval of measurements (AM, PM) |
Time |
.900 |
1 |
.900 |
5.751 |
.020 |
|
Parallel |
.196 |
1 |
.196 |
10.174 |
.002 |
|
|
Method of control (IBC, Standard) |
Parallel |
37.356 |
1 |
37.356 |
1940.649 |
.000 |
|
Errors |
3.138 |
1 |
3.138 |
3.512 |
.066 |
|
|
Experience |
Time |
46.301 |
1 |
46.301 |
295.848 |
.000 |
|
Parallel |
17.239 |
1 |
17.239 |
895.558 |
.000 |
|
|
Control |
19.588 |
1 |
19.588 |
31.342 |
.000 |
|
|
Errors |
20.670 |
1 |
20.670 |
23.134 |
.000 |
|
|
Loading |
6.460 |
1 |
6.460 |
7.642 |
.008 |
|
|
Unloading |
20.169 |
1 |
20.169 |
26.658 |
.000 |
|
|
Logs |
48.558 |
1 |
48.558 |
227.714 |
.000 |
|
|
Trajectory |
36.986 |
1 |
36.986 |
69.465 |
.000 |
|
Results of this analysis indicate, among other things, that all performance indicators exhibit significant differences in their mean values and variances only in relation to the factor of experience. Compared with the operators with minimum experience, the examined individuals with a markedly more experience in controlling the hydraulic crane showed on the simulator significantly higher values in the performance indicators of Time, Parallel, Control, Loading, Unloading and Logs and significantly lower values of Errors and Trajectory performance indicators.
The fewest significant differences among the performance indicators of individual operators are observed in relation to the days of measurement. In the connection with this factor, the differences in mean values were recorded only with using ANOVA (Time: F=4.837, P<0.003; Parallel: F=43.389, P<0.000; Loading: F=2.796, P<0.047; Unloading: F=4.738, P<0.005); with the application of MANOVA, they were not recorded. The values of the Time indicator were significantly higher in the first and second day as compared with the third and fourth day. The values of the Parallel indicator were exactly opposite with the mean values measured in the first and second day being markedly lower than those measured in the third and fourth day. The lowest values of the Loading indicator were recorded in the first days as compared with all the other days, and by contrast, the lowest values of the Unloading indicator were recorded in the last day.
The methods of hydraulic crane control (standard, IBC) and the time interval during the day (AM, PM) have a similar significant context with two performance indicators. The only difference is that, when MANOVA is used, differences of mean values and their variances in the Errors performance indicator are on the edge of statistical significance as related to the factor of the method of hydraulic crane control. With ANOVA, the differences were F=8.353; P<0.004, and with the T-test, the differences were similar t=2.890; df=184; P<0.004). Again, in line with the T-test results, the mean values of the Parallel indicator were markedly higher when the method of hydraulic crane control with the IBC system was used as compared with the standard method of control. The situation was exactly the opposite in the mean values of the Error indicator.
Compared with the afternoon shift, the individuals examined on the simulator in the morning reached significantly higher values. Apart from the highest differences in the Time and Parallel performance indicators, confirmed also with the use of MANOVA – see Table 4, ANOVA and T-tests (data presented under the condition of Equal variances assumed) brought also significant differences in the performance indicators of Control (ANOVA: F=11.587, P<0.001; T-test: t=-3.404, df=184, P<0.001) and Logs (ANOVA: F=11.721, P<0.001; T-test: t=-3.424, df=140, P<0.001). The higher performance of operators in the morning was also confirmed by significantly lower mean values, which can be found in this time interval in the Errors performance indicator (ANOVA: F=7.020, P<0.009; T-test: t=2.650, df=184, P<0.009) and the Trajectory performance indicator (ANOVA: F=8.285, P<0.005; T-test: t=2.878, df=140, P<0.005).
The combination (interaction) of the method of hydraulic crane control (standard, IBC) with the length of experience does not lead to increased significance of any performance indicator, which indicates that each of the factors has a link of its own with these indicators, not related to the other factors. Also, the introduced so-called intercept would increase rather than decrease the statistical significance, which could among other things show whether the choice of independent variables (factors) is suitable. Besides, all mentioned findings about the measure of the relationship (Fischer F) are also corroborated by findings from the regression analysis (R2 coefficients of multiple determination and Beta coefficients).
The results of T-tests, Mann-Whitney test, Kolmogorov-Smirnov test and Kruskal-Wallis test are not inconsistent with the results of MANOVA, by which they contribute to their confirmation and to suitability of MANOVA application (in other words, lower normality and data symmetry have no essential influence on the results).
The below presented bar graphs (Figs. 3 and 4) show basic differences in the Errors and Parallel performance indicators in relation to the operators' experience and method of hydraulic crane control (IBC, standard). Differences among the means related to the control method and the length of experience range from 3.15 to 0.44 and from 5.66 to 2.08, respectively. Whereas the difference among mean values related to the operators' experience and methods of hydraulic crane control is nearly identical in the Parallel performance indicator (differences among the means across the categories are in general very similar with the experienced operators reaching systematically higher values in both methods of hydraulic crane control), the situation is different with the Errors performance indicator. The operators without training exhibit a big difference in the number of errors as related to the method of hydraulic crane control (double amount of errors appearing in the standard control method as compared with the IBC method). The experienced operators exhibit a smaller difference smaller despite the fact that the number of errors in the new IBC method of control is significantly higher as compared with the standard method. Nevertheless, the number of errors itself is not too big from the practical point of view (as compared with the operators without training, the operators with experience make approximately half as many errors in using the IBC method and even up to eight times fewer errors in using the standard method of simulator control).
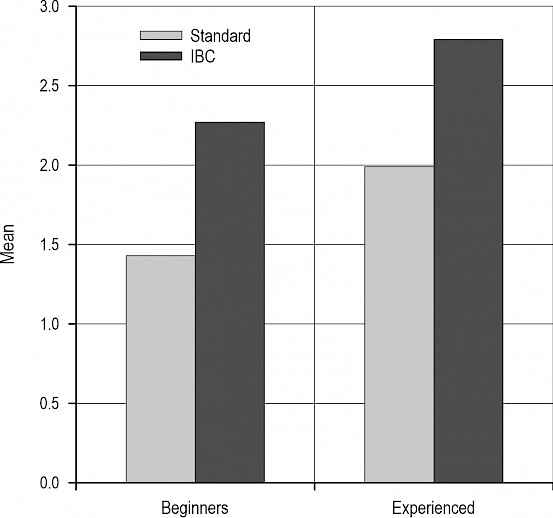
Fig. 3 Descriptive data (means) for the Parallel performance indicator as related to the experience of operators and methods of hydraulic crane control
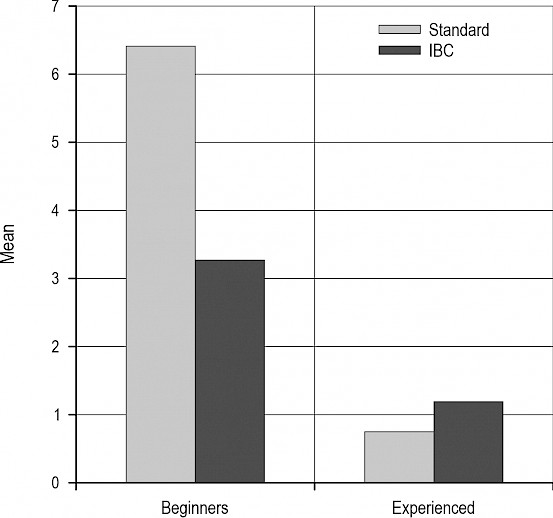
Fig. 4 Descriptive data (means) for the Errors performance indicator as related to the operators' experience and methods of hydraulic crane control
3.1 Division of Performance Indicators According to Their Relation to Research Factors
In our opinion, only those performance indicators whose values of means differ not only statistically significantly but also for example by the Fischer F value, R2 coefficient of multiple determination, or according to the criterion of the size of standard deviations, which are compared with the size of differences among the means, should be explored in detail. Specifically, a difference between the values of two and more files of data (variables) should be at least a third up to a half of the size of their averaged standard deviations. According to these criteria thanks to which the findings acquire significance not only in terms of statistics but namely in terms of facts, essential differences in our research appear in the mean values of the Time, Parallel, Logs and Trajectory indicators. In addition, we are aware of the fact that for the regression analysis a minimum of four and more categories contained in the independent variables (factors) should be used. In our case, the dichotomized variable of the method of hydraulic crane control does not meet the requirement (experience was categorized into 4 categories according to its length). Therefore, the results are considered with great care and reserve. A detailed analysis of regression models explaining relationships among operators' performance indicators and research factors will be given attention in the follow-up paper of the authors.
Table 5 shows all performance indicators for comparison. By contrast to all other indicators, Time, Parallel, Logs and Trajectory have up to nine times higher measure of explaining the differences in their mean values by means of research factors – predictors (expressed by means of the coefficient of multiple determination elucidating the variance of independent variables – performance indicators by the linear combination of predictors – research factors; design. R2). The lowest value was min. 60% (indicator of Trajectory) and, therefore, it can be considered sufficient in itself. Thus, the high values of the coefficients of multiple correlation of selected indicators (97% in the Parallel indicator) »exemplify« their significance in the strength of relations with the predictors. Apart from that, this information also shows to what extent the relationships are linear. The selection of linear regression for the explanation of the correlation of variables seems optimal. However, a detailed exploration of more regression models is needed to verify the fact that would go beyond the scope and focus of this paper. The table further shows the share of predictors in differences in the mean values of performance indicators (expressed by means of so-called standardized Beta coefficients). In short, the higher values are reached by the standardized Beta coefficient, the higher is the influence of the respective factor on the selected performance indicator (the highest values of standardized Beta coefficients are in bold letters in the table).
Performance indicators presented in bold letter in the above table exhibit a correlation of 60% and higher with the predictors of experience and method of hydraulic crane control. Italics and strike thru letters denote the Loading performance indicator, which has the lowest correlation with the predictors. The presented Table 5 indicates again, among other things, that as compared with all other factors, the factor of experience has the greatest influence on all performance indicators with the exception of the Parallel indicator. In short, experience is in fact the only strong factor influencing the performance indicators (except for the Parallel indicator). Namely, in the Time performance indicator, R2 increases only by 1.6% by adding the predictor of the method of hydraulic crane control and only by 2.3% by the addition of the method of hydraulic crane control and the day of measurement. In the Control performance indicator, adding the day of measurement increases R2 by 2.5%, in the Errors performance indicator, the addition of the day of measurement increases R2 by 5.3%. In the Logs performance indicator, the addition of the method of hydraulic crane control increases R2 by 0.4%, and in the Trajectory indicator, the addition of the day of measurement would increase R2 only by 2.1%. The Loading and Unloading performance indicators relate exclusively to experience. Moreover, R2 in the Loading performance indicator is so small that in the case of a further statistical analysis (analysis of main components and factor analysis that will be included in the follow-up paper of the authors), this performance indicator should be removed. Undesirable co-linearity among the data was not significantly demonstrated; contrariwise, the date range between P<0.80 – P<0.98.
If the data is put together in Table 5, it is obvious that experience has the biggest linear correlation with the performance indicators of Logs (82%), Time (71%) and Trajectory (58%). Except for the Loading performance indicator (9%), its correlation with the other indicators is 22–31% including the Parallel indicator, which has the closest linear correlation with the predictor of the method of hydraulic crane control (68%). Thus, it is possible to state that, with the increasing experience of examined individuals (operators 1, 2, 3 and 4 in the ascending order according to the length of experience), their performance improves linearly in all performance indicators. The only exception is Loading, whose relation is the smallest and has no linear direction even if related to the experience of examined individuals in the control of hydraulic crane.
Table 5 Correlation between operators' performance indicators and main predictors, and influence of predictors on mean values of operators' performance indicators
|
Model |
R |
R Square |
Adjusted R Square |
Std. Error of the Estimate |
Standardized Coefficients Beta |
t |
Sig. |
|
|
Time |
experience |
.843a |
0.710 |
0.709 |
1.165 |
.843 |
21.240 |
.000 |
|
Parallel |
method |
.823b |
0.677 |
0.676 |
0.2872094 |
.823 |
19.653 |
.000 |
|
Parallel |
method |
.945c |
0.893 |
0.892 |
0.1657555 |
.816 |
33.759 |
.000 |
|
experience |
.465 |
19.221 |
.000 |
|||||
|
Control |
experience |
.481a |
0.232 |
0.228 |
0.038 |
.481 |
7.450 |
.000 |
|
Errors |
experience |
.556a |
0.309 |
0.305 |
2.836 |
-.556 |
-9.073 |
.000 |
|
Loading |
experience |
.314a |
0.099 |
0.086 |
0.262 |
.314 |
2.767 |
.007 |
|
Unloading |
experience |
.515a |
0.266 |
0.255 |
0.227 |
.515 |
4.923 |
.000 |
|
Logs |
experience |
.905a |
0.818 |
0.817 |
11.323 |
.905 |
25.122 |
.000 |
|
Trajectory |
experience |
.765a |
0.585 |
0.582 |
3.986 |
-.765 |
-14.050 |
.000 |
|
a predictors: constant, experience b predictors: constant, method of hydraulic crane control c predictors: constant, method of hydraulic crane control, experience |
||||||||
4. Discussion
We used eight performance indicators to evaluate the work of operators on the simulator. The performance indicators were of dissimilar informative value as to the evaluation of the influence of IBC method of hydraulic crane control on the operator's performance. As mentioned above, the performance indicators of Loading and Unloading did not show any correlation with the method of hydraulic crane control; the only dominant correlation was with the length of operators' experience. Of all studied performance indicators, the Loading and Unloading indicators exhibited the smallest differences between the performance values of beginners and experienced operators within the Z-scores. In handling the logs, vibrations and shakes transmitted to the forwarder cabin are important dynamic feedback for the operator in the real environment, namely during the grapple operations. The absence of this dynamic feedback showed most apparently in the results of Loading and Unloading indicators when the fixed-base simulator was used. A frequent problem of probands in the virtual environment was correct gripping of the log or a bundle of logs and placing it into the cargo space or onto the log dump in an appropriate way. Problems with the insufficient feedback in simulators were pointed out for example by Ovaskainen (2005) or Zöller et al. (2015). Other phenomena affecting the impaired informative value of the above indicators included poor situation awareness of the operator and his unsatisfactory view from the virtual cabin of the forwarder. Ovaskainen (2005) or Da Silva Lopes et al. (2010) emphasize these facts in their studies, too. Consequently, it can be concluded that the simulator used for determining the Loading and Unloading performance indicators has insufficient ecological validity (measure of applicability of results in real conditions).
Based on the evaluation of Z-scores, the beginners working with the IBC system showed essential improvement in the performance indicators of Parallel, Errors and Control as compared with the standard method of hydraulic crane control. According to our findings, the first two indicators (Parallel and Errors) are influenced not only by the method of hydraulic crane control but also by the operators' length of experience. This is an expected result particularly in the Parallel indicator because the increased number of simultaneous hydraulic crane movements follows out from the very principle of IBC system functioning, which is to a certain extent independent of operator's activities. Hence, the essential increase of values in the Parallel indicator occurred not only in the beginners but also in the experienced operators. In the beginners, the higher number of simultaneous hydraulic crane movements within the Parallel indicator was positively reflected in handling logs as well as in a simpler and more expedient choice of boom tip track (Control). In the operators with no experience the fact contributed to the shortened total track of the hydraulic crane boom tip needed for the displacement of 1 m3 of timber (Trajectory). In the experienced operators, the results of Control and Trajectory indicators were not so clear. Effects of memory proactive interference and Pavlov's dynamic stereotype likely played an important role – see below. This is why the experienced operators with the fixed habits of standard hydraulic crane control had mostly worse results in the Control and Trajectory performance indicators. In the Errors performance indicator, the beginners using the IBC system showed a multiple reduction of errors during work operations. The IBC system simplifies the control of hydraulic crane, which allows especially beginners to focus their attention on other aspects of performed operations and thus to reduce the number of errors. However, the experienced operators using the IBC system showed without exception an increased number of errors in the Errors indicator. Reasons are similar as in the above-mentioned Control and Trajectory performance indicators.
In the evaluation of Z-scores, the biggest differences in the values of indicators between the beginners and experienced operators in the standard method of hydraulic crane control were observed in the Logs, Trajectory, Control and Errors performance indicators, which corresponds with our findings about their strong linear correlation with experience in the first three indicators. The IBC method managed to decrease greatly these differences in the values of indicators in the beginners in the parameters of Trajectory, Errors and Control. In other words, thanks to the IBC system, the performance of beginners identified by these indicators partly neared the performance of experienced operators. The IBC system inherently affects only the work with the hydraulic crane, not with the grapple. This is why the Logs indicator is affected by the IBC system function only to a certain extent in the displacement of logs. The gripping of logs by the grapple fully reflects experience, i.e. the length of operator's experience. In the Time indicator, the beginners and partly also the experienced operators exhibited increased unproductive work time with the use of the IBC system.
Comparing the two systems of hydraulic crane control in real conditions, Manner et al. (2017) declare higher work productivity of novice operators in the system of boom tip control thanks to simpler crane control and shorter overall track of the end part of hydraulic crane. The results are in line with our findings related to novice operators on the simulator, which result in positive changes in the Parallel, Trajectory, Errors and Control performance indicators.
Undoubtedly, the length of experience and experience are the basic factor in our research, determining the performance rate of forwarder operators in the monitored indicators. Thus, the fact that human factor is the primary element deciding on overall work quality and quantity has been confirmed again. Trying to find the answer to the question what is behind the concept of experience, we shall definitely get to themes connected with the psychophysiology of man. The capability of controlling the hydraulic crane is formed doubtlessly by both all cognitive processes (perception, attention, memory and thinking processes) and sensomotor processes (fine motor skills). All these processes and their contents, which can be called processes and contents of information processing, are further differentiated and integrated under the influence of learning, which leads individuals to higher performance and lower number of errors (Sternberg 2011). The same happened in our case. In addition to the mentioned long-term effect of learning, our research also confirmed the effect of learning during the research in line with the research results of Lopes et al. (2008) and Da Silva Lopes (2010), because it showed, at least to a limited extent, that the performance of all operators was better and better from day to day of measurement. However, learning can have a negative influence, too. The phenomenon of memory proactive interference (Rohrracher 2014, Preiss and Křivohlavý 2009), at which incapability of acquiring new information occurs is known, as well as the phenomenon of Pavlov's dynamic stereotype when »old« experience and skills are hard to rework (quotation according to Simonov 1986). The negative influence of the former experience was apparently shown in the number of operators with the most experience, when working with the hydraulic crane and the IBC system switched on. They exhibited more errors as compared with their former work when they used the standard method, to which they were long used to. Despite the effect of short-term (days) and long-term (years) learning, the performance of operators is also influenced by working time. As compared with the PM hours, their performance is higher in the morning, the fact being apparently related to circadian rhythms and curves of labour performance. As it was demonstrated many times, man achieves top performance between 9.00–11.00 AM (Coloquhoun 1971, Folkard 1990, Monk 1991, Pöppel et al. 1970, Wever 1979) and the performance optimum of manual activities requiring sensomotor coordination is in the second or third hour from the beginning of work (Kraepelin 1902, Florence 2003). These findings concerning the circadian variability in the operators' performance are also documented by sudden slumps at the beginning of PM measurements (see Table 1), which is probably related to a so-called post lunch dip phenomenon (Coloquhoun 1971, Kleitman 1963).
The above information can be used particularly in the economic and ecological fields. As a model case, we can mention Operator 1 working with the IBC system. The increased number of simultaneous hydraulic crane movements and the shortened overall track of the end part of the hydraulic crane made it possible for this operator without training to increase the number of displaced logs per minute from 2.52 to 3.20. If taking into account eight working hours, machine employment at 60% and the share of work with the hydraulic crane of 50% within a work cycle, the operator can load 49 logs more in one shift. With the stem volume of 0.24 m3 used on the simulator, this number of logs amounts to somewhat less than 12 m3. Hence, within a month, the operator can transport to the roadside landing approximately 235 m3 more, by which the price would decrease only in terms of labour cost approximately by 1591.00 CZK (price of 1 m3 timber would decrease by 6.77 CZK, i.e. by ca. 0.26 EUR). Since the average gross wage in the Czech Republic was 27,621.00 CZK in forestry in the 4th quarter of 2018 (ca. 1076.00 EUR) according to the Czech Statistical Office (2019), the saving would be 5.8%. In addition to the above factors (the number of simultaneous hydraulic crane movements and the shortened overall track of the hydraulic crane), other factors may contribute to an increased performance or facilitate a decrease in workload. These factors are a reduction in the number of unnecessary and stochastic crane movements, fuel consumption, operator fatigue, machine wear and associated delays in machine repairs, etc. Due to this, the percentage estimate in savings mentioned can be considered as an underestimate.
The economic benefit of using the IBC method by operators without training is ever more pronounced by the essential reduction of errors in their work with the hydraulic crane. We found out that a third of operator's errors in working with the standard system of hydraulic crane control caused damage to the forwarder cabin. Repair of this machine part is rather costly. The most common error of the operator without training during the loading or unloading of logs was damage to hydraulic hoses at the grapple, caused by the contact with stanchions. If the operator has no spare part available, failures of this type represent primarily the loss of time. Another risk following out from damage to hydraulic hoses – if the machine is not equipped with biologically degradable hydraulic oil – is damage to the environment by the leakage of service fluids. The use of the IBC system allowed reducing direct damages to the machine by 53%. As to undesirable contacts of displaced logs or hydraulic crane with the forwarder (without damage to the machine), the number of errors was reduced even by 73%. The undesirable contacts of logs or hydraulic crane with the machine represent a risk especially in the long-term perspective by increased machine wear and impaired service life.
We would like to use our laboratory results obtained on the forwarder simulator for the comparison with field measurements taken on the forwarder within the project TAČR »Forwarder for timber haulage with a hybrid chassis drive«. Dimensions of the forwarder in the simulator environment are derived from actual dimensions of the forwarder, the cargo space of which is by 46 cm longer and by 54 cm wider as compared with the dimensions of agricultural tractor trailer. Moreover, front bars of the cargo space are by 75 cm closer to the operator's seat. We presume that a smaller cargo space and its larger distance from the forwarder cabin might have impact on the operator's work performance and increase the number of his errors in loading and unloading the logs. The fact would be manifested in the Errors, Loading and Unloading performance indicators. By contrast, a larger distance between the hydraulic crane stanchion and the tractor cabin could have a positive effect on the forwarder operator's work performance thanks to reduced blind sector in the operator's view of the cargo space.
5. Conclusions
The aim of our research was to verify assumptions concerning the use of the method of boom tip control in forwarders, which the company John Deere Forestry launched under commercial name Intelligent Boom Control (IBC). The first assumption that the IBC system increases work productivity of forwarder operators as compared with the standard hydraulic crane control has only been partly accepted. The obtained results justify this statement only with the operators without training. The work productivity increase of more than 25% occurred in the beginning of operators using the IBC system thanks to the increased number of simultaneous hydraulic crane movements (Parallel) and to a more appropriate choice of the end part track of the hydraulic crane (Control). The direct economic benefit of using the IBC system is amplified by reduced damages to the machine during the hydraulic crane operation of more than 50% (Errors). In the experienced operators, the results were not so clear because their work with the IBC system led to worse values in some performance indicators (e.g. Errors). The second assumption that the use of the IBC system shows positive effects when performed by less experienced operators has been accepted completely based on the above-presented data.
Nevertheless, our findings indicate quite clearly that the method of hydraulic crane control is not the most important factor affecting the performance indicators. The factor of experience of examined individuals with the control of hydraulic crane shows the closest and moreover linear correlation with the performance indicators. This factor exhibits the strongest linear correlation with the Logs (82%), Time (71%) and Trajectory (58%) performance indicators. With the increasing experience, the performance of examined individuals is increasing linearly in all indicators. The only exception is Loading, which even if related to the experience of examined individuals in the control of hydraulic crane, is only correlated to a limited extent, and has no linear direction on the top.
Other factors influencing the values of performance indicators were time intervals in the AM and PF shifts. Compared with the PM shift, the individuals working with the hydraulic crane in the AM hours achieved significantly higher values. Apart from the highest differences found in the performance indicators of Time and Parallel (MANOVA), significant differences were also recorded in the Control and Logs indicators (ANOVA and T-tests). The higher performance of operators in the morning hours was additionally also confirmed by significantly lower mean values (ANOVA and T-tests), found in this time interval in the performance indicators of Errors and Trajectory.
Our findings indicate that the simulator we used, with the fixed base, is not sufficiently valid for the performance indicators of Loading and Unloading within the framework of eight indicators we investigated, namely due to the absence of dynamic feedback during the hydraulic crane operation.
Acknowledgments
Our thanks go to the operators who devoted their time to the work on the forwarder simulator. This paper uses results from the solution of Project TA CR no. TH02010115 Forwarder with the hybrid chassis drive for timber transport.
6. References
Ackerman, S.A., Seifert, S., Ackerman, P.A., Seifert, T., 2016: Mechanised pine thinning harvesting simulation: Productivity and cost improvements as a result of changes in planting geometry. Croatian Journal of Forest Engineering 37(1): 1–15.
Bellem, H., Klüver, M., Schrauf, M., Schöner, H.-P., Hecht, H., Krems, J.F., 2017: Can we study autonomous driving comfort in moving-base driving simulators? A validation study. Human Factors 59(3): 442–456. https://doi.org/10.1177/0018720816682647
Boucsein, W., 2012: Electrodermal Activity. Second edition. Springer, New York, Dordrecht, Heidelberg, London, 618 p. https://doi.org/10.1007/978-1-4614-1126-0
Branzi, V., Domenichini, L., La Torre, F., 2017: Drivers’ speed behaviour in real and simulated urban roads – A validation study. Transportation Research Part F: Traffic Psychology and Behaviour 49: 1–17. https://doi.org/10.1016/j.trf.2017.06.001
Burnett, G.E., Irune, A., Mowforth, A., 2007: Driving simulator sickness and validity: How important is it to use real car cabins? Advances in Transportation Studies (spec.issue): 33–42.
Coloquhoun, W.P. (ed.), 1971: Biological rhythms and human performance. Acad. Press, London–New York, 283 p.
Czech Statistical Office, The number of employees and average gross monthly wages and salaries, by CZ-NACE sector. Available online: https://vdb.czso.cz/vdbvo2/faces/en/index.jsf?page=vystup-objekt&z=T&f=TABULKA&pvo=MZD02-A&skupId=849&katalog=30852&pvo=MZD02-A&c=v3~6__RP2018QP4 (accessed March 21, 2019).
da Silva Lopes, L., de Oliveira, D., da Silva, P.C., Chiquetto, A.L., 2010: Evaluation of operator's performance training with forwarder simulator [Avaliação do desempenho de operadores no treinamento com simulador de realidade virtual forwarder]. Ciencia Florestal 20(1): 179–189. https://doi.org/10.5902/198050981772
Dawson, M.E., Schell, A.M., Filion, D.L., 2007: »The electrodermal system«, in Handbook of psychophysiology (3rd ed.), eds. J.T. Cacioppo, L.G. Tassinary, G.G. Berntson (Cambridge University Press, New York), 159–181.
de Winter, J.C.F., de Groot, S., Mulder, M., Wieringa, P.A., Dankelman, J., Mulder, J.A., 2009: Relationships between driving simulator performance and driving test results. Ergonomics 52(2): 137–153. https://doi.org/10.1080/00140130802277521
DEERE & COMPANY, 2017: Operator's instructions 1WJ1110G004202-, 1WJ1210G002102-, 1WJ1510G003604-. Moline, DEERE & COMPANY.
Deniaud, C., Honnet, V., Jeanne, B., Mestre, D., 2015: The feeling of presence as a necessary condition of behavioral validity in driving simulators [La sensation de présence comme condition nécessaire de la validité comportementale des simulateurs de conduite]. Travail Humain 79(4): 285–306. https://doi.org/10.3917/th.784.0285
Dvořák, J., Natov, P., Natovová, L., Krilek, J., Kováč, J., 2016: Operator's physical workload in simulated logging and timber bucking by harvestor. Journal of Forest Science 62(5): 236–244. https://doi.org/10.17221/21/2016-JFS
Fiľo, P., 2014: Comparison of the ergonomic characteristics of forwarders with stationary and rotating cabins. Journal of Agricultural Science and Technology B 4(6): 476–484. https://doi.org/10.17265/1939-1250/2014.06B.007
Florence, P.S., 2003: Economics of fatigue and unrest. Economics, London, Routlege (Taylor & Francis Group), 237 p.
Folkard, S., 1990: Circadian performance rhythms: some practical and theoretical implications. Phil. Trans. R. Soc. Lond., 327 p., 543–553. https://doi.org/ 10.1098/rstb.1990.0097
Ghaffariyan, M.R., Sessions, J., Brown, M., 2012: Machine productivity and residual harvesting residues associated with a cut-to-length harvest system in southern Tasmania. Southern Forests 74(4): 229–235. https://doi.org/10.2989/20702620.2012.741770
Hallvig, D., Anund, A., Fors, C., Kecklund, G., Karlsson, J.G., Wahde, M., Åkerstedt, T., 2013: Sleepy driving on the real road and in the simulator – A comparison. Accident Analysis and Prevention 50: 44–50. https://doi.org/10.1016/j.aap.2012.09.033
Helland, A., Jenssen, G.D., Lervåg, L.-E., Westin, A.A., Moen, T., Sakshaug, K., Lydersen, S., Mørland, Jø., Slørdal, L., 2013: Comparison of driving simulator performance with real driving after alcohol intake: A randomised, single blind, placebo-controlled, cross-over trial. Accident Analysis and Prevention 53: 9–16. https://doi.org/ 10.1016/j.aap.2012.12.042
Chmelař, V., Osecký, P., 1974: Mathematical models of the active attention course. Sborník prací Filosofické fakulty brněnské university (Studia minora facultatis philosophicae universitatis brunensis), I9: 17–51.
Kivinen, V.-P., 2006: A forest-level genetic algorithm based control system for generating stand-specific log demand distributions. Canadian Journal of Forest Research 36(7): 1705–1722. https://doi.org/10.1139/x06-055
Klüver, M., Herrigel, C., Heinrich, C., Schöner, H.-P., Hecht, H., 2016: The behavioral validity of dual-task driving performance in fixed and moving base driving simulators. Transportation Research Part F: Traffic Psychology and Behaviour 37: 78–96. https://doi.org/10.1016/j.trf.2015.12.005
Kraepelin, E., 1902: Die Arbeitskurve. Leipzig, Engelmann.
Kramer, A.F., 1990: Physiological Metrics of Mental Workload: A Review of Recent Progress. Navy Personnel Research and Development Center, San Diego, California.
Lee, Y.-C., Winston, F.K., 2016: Stress induction techniques in a driving simulator and reactions from newly licensed drivers. Transportation Research Part F: Traffic Psychology and Behaviour 42: 44–55. https://doi.org/10.1016/j.trf.2016.06.019
Lindroos, O., Ringdahl, O., Hera, P.L., Hohnloser, P., Hellström, T., 2015: Estimating the position of the harvester head – A key step towards the precision forestry of the future? Croatian Journal of Forest Engineering 36(2): 147–164.
Löfgren. B., Wikander. J., 2009: Kinematic control of redundant knuckle booms. International Journal of Forest Engineering 20(1): 22–30. https://doi.org/10.1080/14942119.2009.10702572
Lopes, E.D.S., Cruziniani, E., De Araujo, A.J., Da Silva, P.C., 2008: Evaluation of harvester operator training using virtual reality simulators [Avaliação do treinamento de operadores de harvester com uso de simulador de realidade virtual]. Revista Arvore 32(2): 291–298. https://doi.org/10.1590/S0100-67622008000200012
Manner, J., Gelin, O., Mörk, A., Englund, M., 2017: Forwarder crane’s boom tip control system and beginner-level operators. Silva Fennica 51(2): article id 1717. https://doi.org/10.14214/sf.1717
Marlenga, B., Berg, R.L., Pickett, W., Brown, T., Becklinger, N., Schwebel, D.C., 2017: Using simulation to assess the ability of youth to safely operate tractors. Transportation Research Part F: Traffic Psychology and Behaviour 48: 28–37. https://doi.org/10.1016/j.trf.2017.04.021
Martins, R.J., Seixas, F., Stape, J.L., 2009: Technical and economical evaluation of a harvester, working under different spacing and planting arrangement conditions in eucalypts plantations [Avaliação técnica e econômica de um harvester trabalhando em diferentes condições de espaçamento e arranjo de plantio em povoamento de eucalipto]. Scientia Forestalis/Forest Sciences 83: 253–263.
Matas, N.A., Nettelbeck, T., Burns, N.R., 2016: Assessment of driving simulator validity and acceptability for older adult drivers. Advances in Transportation Studies 39: 69–88.
Ministry of Agriculture of the Czech Republic, 2019: Information on forests and forestry in the Czech Republic by 2018 [Zpráva o stavu lesa a lesního hospodářství České republiky v roce 2018]. Praha. Ministerstvo zemědělství.
Monk, T., 1991: Sleep, Sleepines and Performance. Pittsburg, John Wiley & Sons Ltd.
Mulder, L.J.M., Mulder, G., 1987: »Cardiovascular reactivity and mental workload«, in The Beat-by-Beat Investigation of Cardiovascular Function, eds. O. Rompelman, R.I. Kitney (Oxford University Press, Oxford), 216–253.
Naujoks, F., Purucker, C., Neukum, A., Wolter, S., Steiger, R., 2015: Controllability of partially automated driving functions – Does it matter whether drivers are allowed to take their hands off the steering wheel? Transportation Research Part F: Traffic Psychology and Behaviour 35: 185–198. https://doi.org/10.1016/j.trf.2015.10.022
Nuutinen, Y., Väätäinen, K., Heinonen, J., Asikainen, A., Röser, D., 2008: The accuracy of manually recorded time study data for harvester operation shown via simulator screen. Silva Fennica 42(1): 63–72. https://doi.org/10.14214/sf.264
Ovaskainen, H., 2005: Comparison of harvester work in forest and simulator environments. Silva Fennica 39(1): 89–101. https://doi.org/10.14214/sf.398
Ovaskainen, H., Palander, T., Tkkanen, L., Hirvonen, H., Ronkainen, P., 2011: Productivity of different working techniques in thinning and clear cutting in a harvester simulator. Baltic Forestry 17(2): 121–130.
Palander, T., Ovaskainen, H., Tikkanen, L., 2012: An adaptive work study method for identifying the human factors that influence the performance of a human-machine system. Forest Science 58(4): 377–389. https://doi.org/10.5849/forsci.11-013
Ponsse, 2018: Cut to Length method, Ponsse – A logger's best friend. Available online: http://www.ponsse.com/ponsse/business-sector/cut-to-length-method (accessed July 10, 2018).
Pöppel, E., Aschoff, J.C., Giedke, H., 1970: Tagesperiodische Veränderungen der Reaktionszeit bei Wahlreaktionen. Zeitschrift für experimentelle und angewandte Psychologie, XVII., 4: 537–552.
Preiss, M., Křivohlavý, J., 2009: Trénování paměti a poznávacích schopností. Praha, Grada Publishing, p. 28.
Proto, A.R., Macrì, G., Visser, R., Harrill, H., Russo, D., Zimbalatti, G., 2018: A case study on the productivity of forwarder extraction in small-scale Southern Italian forests. Small-scale Forestry 17(1): 71–87. https://doi.org/10.1007/s11842-017-9376-z
Reimer, B., Mehler, B., 2011: The impact of cognitive workload on physiological arousal in young adult drivers: A field study and simulation validation. Ergonomics 54(10): 932–942. https://doi.org/10.1080/00140139.2011.604431
Rohrracher, H., 2014: Die Arbeitsweise des Gehirns und Die Psychischen Vorgänge. Springer Berlin Heidelberg, 208 p.
Sánchez-García, S., Canga, E., Tolosana, E., Majada, J., 2016: Analysis of productivity and cost of forwarding bundles of eucalyptus logging residues on steep Terrain. Croatian Journal of Forest Engineering 37(2): 241–249.
Shechtman, O., Classen, S., Awadzi, K., Mann, W., 2009: Comparison of driving errors between on-the-road and simulated driving assessment: A validation study. Traffic Injury Prevention 10(4): 379–385. https://doi.org/10.1080/15389580902894989
Simonov, P.V., 1986: The Emotional Brain: Physiology, Neuroanatomy, Psychology, and Emotion. Springer Science+Business Media, New York, 14 p. https://doi.org/10.1007/978-1-4899-0591-8
Sternberg, R.J., 2011: Cognitive Psychology, Wadsworth, Belmont, United States, 469–498.
Wandtner, B., Schumacher, M., Schmidt, E.A., 2016: The role of self-regulation in the context of driver distraction: A simulator study. Traffic Injury Prevention 17(5): 472–479. https://doi.org/10.1080/15389588.2015.1102231
Wang, Y., Mehler, B., Reimer, B., Lammers, V., D'Ambrosio, L.A., Coughlin, J.F., 2010: The validity of driving simulation for assessing differences between in-vehicle informational interfaces: A comparison with field testing. Ergonomics 53(3): 404–420. https://doi.org/10.1080/00140130903464358
Wever, R.A., 1979: The Circadian System of Man. New York, Heidelberg, Berlin, Springer-Verlag, 276 p.
Yan, X., Abdel-Aty, M., Guo, D., Radwan, E., 2012: Visualization of signalized intersections in driving simulator and validity of driving behaviors in virtual environments. Advances in Transportation Studies 26: 17–28. https://doi.org/10.4399/97888548465862
Zöller, I., Betz, A., Mautes, N., Scholz, L., Abendroth, B., Bruder, R., Winner, H., 2015: Valid representation of a highly dynamic collision avoidance scenario in a driving simulator. Transportation Research Part F: Traffic Psychology and Behaviour 31: 54–66. https://doi.org/10.1016/j.trf.2015.03.004
© 2021 by the authors. Submitted for possible open access publication under the
terms and conditions of the Creative Commons Attribution (CC BY) license (http://creativecommons.org/licenses/by/4.0/).
Authors’ addresses:
Tomáš Zemánek, PhD *
e-mail: tomas.zemanek@mendelu.cz
Mendel University in Brno
Faculty of Forestry and Wood Technology
Department of Engineering
Zemědělská 3
61300, Brno
Czech Republic
Petr Fiľo, PhD
e-mail: filo@mail.muni.cz
Masaryk University
Faculty of Sports Studies
Department of Social Sciences and Sport Management
Kamenice 753/5
62500, Brno
Czech Republic
* Corresponding author
Received: May 15, 2020
Accepted: May 13, 2021
Original scientific paper