
Potential Evaluation of Forest Road Trench Failure in a Mountainous Forest, Northern Iran
doi: 10.5552/crojfe.2022.1330
volume: 43, issue:
pp: 18
- Author(s):
-
- Jalali Aghil Moradmand
- Naghdi Ramin
- Ghajar Esmael
- Article category:
- Original scientific paper
- Keywords:
- landslide, mass movement, rock, geoscience, economics
Abstract
HTML
After road construction in steep and mountainous areas, there is always a risk for trench failure. Estimation of this probability before forest road design and construction is urgent. Besides, to decrease failures costs and risks, it is necessary to classify their occurrence probabilities and identify the factors affecting them. The present study compares three statistical models of logistic regression, frequency ratio, and maximum entropy. The robust one was applied to generate trench failures susceptibility map of forest roads of two watersheds in Northern Iran. Also, all failures repairing costs were estimated, and subsequently, all existing roads were surveyed in the study area, detecting 844 failures. Among the recorded failures, 591 random cases (70%) were used in modeling, and others (30%) were used as validation data. The digital layers, including failure locations, were prepared. Three failure susceptibility maps were simulated using the outputs of the mentioned methods in the GIS environment. The resulted maps combined with repair cost prices were analyzed to statistically evaluate the repair cost unit per meter of forest road and per square meter of failure. The results showed that the logistic regression model had an Area Under Curve (AUC) of 74.6% in identifying failure-sensitive areas. The probabilistic frequency ratio and Entropy models showed 68.2 and 65.5% accuracy, respectively. Based on the logistic regression model, the distance to faults and terrain slope factors had the highest effects on forest road trenches failures. According to the result, about 43.25% of the existing road network is located in »high« and »very high« risky areas. The estimated cost of regulating and profiling trenches and ditches along the existing roads was approximately 108,772 $/km.
Potential Evaluation of Forest Road Trench Failure in a Mountainous Forest, Northern Iran
Aghil Moradmand Jalali, Ramin Naghdi, Ismael Ghajar
Abstract
After road construction in steep and mountainous areas, there is always a risk for trench failure. Estimation of this probability before forest road design and construction is urgent. Besides, to decrease failures costs and risks, it is necessary to classify their occurrence probabilities and identify the factors affecting them. The present study compares three statistical models of logistic regression, frequency ratio, and maximum entropy. The robust one was applied to generate trench failures susceptibility map of forest roads of two watersheds in Northern Iran. Also, all failures repairing costs were estimated, and subsequently, all existing roads were surveyed in the study area, detecting 844 failures. Among the recorded failures, 591 random cases (70%) were used in modeling, and others (30%) were used as validation data. The digital layers, including failure locations, were prepared. Three failure susceptibility maps were simulated using the outputs of the mentioned methods in the GIS environment. The resulted maps combined with repair cost prices were analyzed to statistically evaluate the repair cost unit per meter of forest road and per square meter of failure. The results showed that the logistic regression model had an Area Under Curve (AUC) of 74.6% in identifying failure-sensitive areas. The probabilistic frequency ratio and Entropy models showed 68.2 and 65.5% accuracy, respectively. Based on the logistic regression model, the distance to faults and terrain slope factors had the highest effects on forest road trenches failures. According to the result, about 43.25% of the existing road network is located in »high« and »very high« risky areas. The estimated cost of regulating and profiling trenches and ditches along the existing roads was approximately 108,772 $/km.
Keywords: landslide, mass movement, rock, geoscience, economics
1. Introduction
Trenches Failures (TFs) are among the most significant geological hazards worldwide that lead to substantial economic and human losses (Del Ventisette et al. 2012). Assessing areas susceptible to TFs is of great importance to reduce and manage failure-related disasters. Hence, the assessment of failure susceptibility modeling has become one of the leading global research topics over recent years (Bhandary et al. 2013). Although the costs of failure damage are proven to be of economic significance, their systematic estimation efforts are still rare. Evaluation of failure costs requires the consideration of complex causalities and high spatiotemporal variability.
Forest road investments are essential for the sustainable management of forest resources. Access to timber extraction, fire prevention, recreation, and research are among the substantial benefits that the forest roads provide. These various functions have led to a growing demand for constructing and further extending the forest roads; however, forest roads are of the most destructive aspects of forestry activities (Larsen and Parks 1997, Jaafari et al. 2014). Economic efficiency is generally the most significant criterion in forest transportation planning since forest roads are the most expensive structures in forest management (Liu and Sessions 1993, Dean 1997, Murray 1998).
Selecting unsuitable road locations in forested areas leads to destructive effects on the natural environment and the occurrence of technical and economic problems; therefore, the evaluation of forest road conditions regarding TF susceptibilities is of great importance (Görcelioğlu 2004). Due to the severe topographic conditions with stability problems that trigger TF hazards, Hyrcanian forest roads require costly road maintenance and reconstruction works. TFs can make roads unusable because the material displacement can block the roads, damage their components, and destroy roadbeds. The impacts of failures on road networks depend on several factors, including the type of failure, the roads location, and the area geomorphology (Reichenbach et al. 2002). Thus, in areas with high TF susceptibility, determining the road alignments is the most challenging task. For this reason, TFs susceptibility map must be taken into account in forest road planning, particularly in mountainous regions where road construction causes impacts on slope stability and increases road maintenance costs. However, many engineers still use traditional methods to consider the impact of failure on road planning (Hosseini et al. 2012)
Forest engineers are searching for proper methods to decrease costs, increase efficiency, and minimize the destructive impacts of roads on forests due to the increasing public awareness of environmental problems (Radfar et al. 2011). Hence, failure-susceptibility maps can be used as a basis to select appropriate road locations, determine the required engineering road construction standards, and minimize construction and maintenance for these costs related to failures. Capital investments for failure repair and mitigation, in addition to operational expenditures for first response and maintenance works, are among the mentioned costs (Alimohammadlou et al. 2013).
Numerous researches have been conducted to investigate the causes of landslides. However, detailed investigations have not been made in the context of damage caused by TFs on forest roads. Heam et al. (2008) studied the effects of landslides on the road network of the Republic of Laos and concluded that road annual maintenance costs for the period of 2004–2007 were $1000–$1500 per kilometer. Besides, they estimated $50,000 of annual reinstatement costs for the next five years (2009–2013) during a heavy wet season. Vranken et al. (2013) evaluated the landslide economic damages in the hilly regions of Belgium. They investigated the direct and indirect costs of landslide damage in residential areas, forests, pastures, and roads during 2001–2011. They concluded that the average annual costs of landslide damage in the study area were $92,665. These included the costs of maintenance and the cost of existing damages, which were estimated at $81,645 and $11,200, respectively. Klose et al. (2014) simulated the landslide costs of mountain roads in susceptible areas of Germany. They recorded more than 33 landslides that led to damage and maintenance costs related to cut slopes and embankments between 1980 and 2010. Their study revealed that the average annual cost per kilometer of potentially endangered roads is approximately $52,000. Eker and Aydın (2016) assessed the landslides in forest roads in Galika and Karduz regions of Turkey using the logistic regression method. They concluded that more than 95% of the total area was located in »very low« and »low« landslide susceptibility classes, while 3% was located in moderate landslide susceptibility classes. The rest of the area was located in »high« and »very high« landslide susceptibility classes. According to the analysis of 180.8 km of roads in the region, 1.3 km of roads were located within very high susceptibility, and 1.5 km of roads were in high susceptibility classes. Donnini et al. (2017) statistically analyzed the impacts of landslides on road networks in Italy. They examined the annual reconstruction costs caused by a landslide for roads in Sicily (Main Roads) and Marche (Side and Mountain Roads). The analysis showed that the average cost of damage in Sicily and Marche were $1958 and $16,287 per kilometer, respectively.
The present study aimed to compare the accuracy of frequency ratio (FR), maximum entropy (Maxent), and logistic regression (LR) models to estimate forest road TF susceptibility and generate more effective failure susceptibility maps in the study area. Eventually, by estimation of this susceptibility in the study area, an auxiliary basis will be provided for a proper design of road networks in the future, along with reducing the repair costs of existing forest roads. In this study, all digital layers and cost data were obtained from multiple sources, including local authorities and national administration offices. The proposed methodology allowed us to estimate the average trench repair cost per kilometer on the forest road and per unit area of TF. Other researchers and global administrations can use the estimated costs to compare and assess engineering operation costs, particularly in developing countries.
2. Methods
2.1 Study Area
The study was conducted in watersheds number 24 and 25 (Malakrood and Shenrood) in Guilan province, Northern Iran. They are located between 37°09’N and 36°55’N and 49°38’E and 49°58’E. Altitude ranges from 100 to 2100 m above sea level and covers 38,616.71 ha in total (Fig. 1). The climate is moist to mid moist, with average annual temperatures ranging from 5.5 to 23.7°C. The average annual precipitation is 1578 mm. The area receives snow as winter precipitation. There existed 99.753 km of active roads, including forest roads and village roads in the study area.
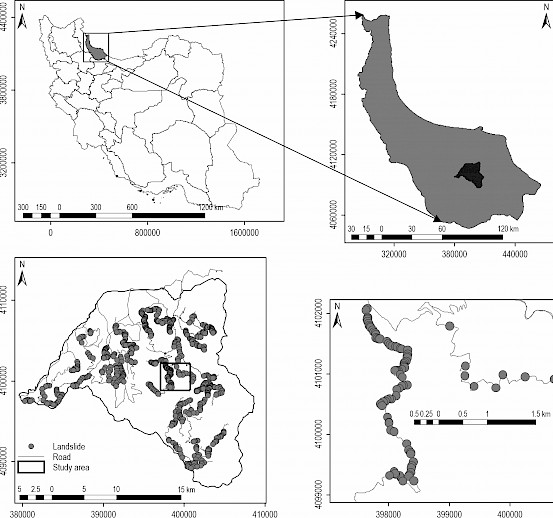
Fig. 1 TF location map with hillshaded map of the study area
2.2 Data Collection
In the first step, all road failures were detected in the study area by extensive field surveys. A total of 844 failures were mapped in the study area at 1:25,000 scale (Fig. 1). Of these, eighteen points with critical slip have been identified (mass movement). A failure-inventory layer was then generated in vector format in Geographic Information System (GIS) environment and overlaid on input variables. Based on the field observations and previous studies, eight failure effective input variables were selected for the failure-susceptibility mapping, including terrain slope, aspect, slope curvature, elevation, distance from the river, and distance from faults, lithology, and soil texture (Fig. 2). Some variables were mapped in a raster format by employing the study area digital elevation model (DEM). The distances of failures to rivers and faults were calculated using the »near« function in GIS. The river buffer map was generated in 100 m intervals, and the distance from the faults map was categorized in 200 m intervals, as shown in Fig. 2g–h. The study area lithology map was clipped from a standard 1:100,000 scale geological formations map (Fig. 2c and Table 1). The types of lithology formations under each failure were extracted using the geology database. All variables map and failures-inventory maps were converted and stored in a raster format with 10 m resolution. In this study, the terrain slope layer was categorized into six slope classes, including 0–10°, 10–20°, 20–30°, 30–40°, 40–50°, and above 50°; likewise, the aspect map plays a significant role in slope stability assessment (Chauhan et al. 2010). The aspect was later divided into nine classes: flat, N, NE, E, SE, S, SW, W, and NW, to describe the classes variances. An aspect map displayed each direction distribution in the topography using different colors for each cell of the study area (Quan and Lee 2012). Profile curvature was reclassified into three classes, namely concave, flat, and convex. The curvature values represent the morphology of the topography. The concave profiles retain the rainfall water for a more extended period; therefore, these profiles containing water are those that can motivate failure (Lee and Thalib 2005). The analysis of this study was carried out in five steps:
Þ preparation of input data layers
Þ modeling of failure susceptibility using three models, namely FR, Maxent, and LR
Þ validation and comparison of the models and selection of the best model based on receiver operating characteristic (ROC) curves (70% or 591 pixels of training data and 30% or 253 pixels of validation data)
Þ simulation of the TF risk in the entire study area in five risk classes of »very low«, »low«, »medium«, »high«, and »very high«
Þ estimating the costs of repair and regulation of excavation angles and embankment trenches per kilometer regarding the area of TFs and in reference to the national standard price list of the forest road construction (NSPL).
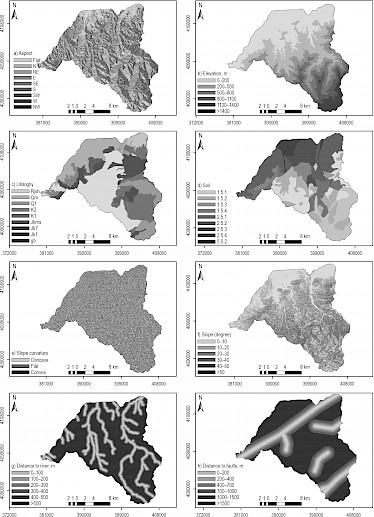
Fig. 2 Failure conditioning variables used in logistic regression, frequency ratio and entropy models distance to faults
Table 1 Types of geological formations in the study area
|
Code |
Lithology |
Geological age |
|
Q1al |
Alluvium, flood-plain, and deltaic deposits |
Quaternary |
|
K2v |
Alternation of lapilli tuff and agglomerate with intercalation of calcareous sandstone |
Cretaceous |
|
Rjssh |
Alternation of gray to greenish, fine-grained arkosic sandstone, gray to black shaly mudstone |
Triassic |
|
JK1 |
Gray, medium to thick-bedded limestone with lithic crystal tuff in base |
Jurassic |
|
Gb |
Diorite-gabbro, gabbro |
Post Jurassic |
|
JKms |
Detrital limestone and calcareous silty-sandstone yellow to light gray and brown to gray sandstone |
Jurassic- Cretaceous |
|
JKv |
Alternation of light gray dacite-andesite tuff, dark gray andesitic lava and agglomerate |
Jurassic |
|
K11 |
Dark-gray, medium to thick-bedded limestone |
Cretaceous |
|
Qm1 |
Old deposits |
Quaternary |
2.3 Data Integration and Analysis
2.3.1 Bivariate Frequency Ratio Analysis
The correlation between the failure occurrence distribution and failure causative factors is derived by the Frequency Ratio (FR) (Lee and Talib 2005, Ferentinou and Chalkias 2013, Shahabi et al. 2014). The ratio is characterized by the region where failure occurrences are found to the total study area and the ratio of failure probability occurrences to the non-occurrences for a given attribute. A mean value of 1 is produced, meaning that the areas that exceed 1 have a higher correlation to failure occurrences. The areas below this value have a lower correlation to failure occurrences (Pradhan and Lee 2009). The FR per causative factor class is defined by Eq. (1) (He and Beighley 2008):
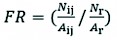 (1)
(1)
Where:
Nij area of failures in the spatial extent associated with the jth class of the ith parameter
Aij land area associated with the jth class of the ith parameter
Nr and Ar total areas of failures and the total study area, respectively.
Therefore, it is clear that indicates the failure of class density and shows the failure causative parameter density.
2.3.2 Multivariate Logistic Regression Analysis
Multivariate Logistic Regression (LR) is the most common method for failure susceptibility study (Budimir et al. 2015). LR is expressed as Eq. (2):
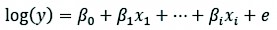 (2)
(2)
Where:
y dependent variable
β0 constant
β1 ith regression coefficient
x1 ith explanatory variable and is the error.
Probability occurrence (p) of y is calculated by the linear Eq. (3):
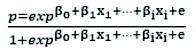 (3)
(3)
The lithology causative factor was reclassified and treated as categorical data. The LR is used to predict the absence or presence of a characteristic or outcome-based onset of predictor values. Subsequently, the coefficient of each failure causative factor was calculated. All factors (terrain slope, slope curvature, aspect, elevation, lithology, the density of geological boundaries, proximity to faults, and proximity to the river) were treated as ordinal variables in the SPSS 22.0 software (Adition 2018).
2.3.3 Maximum Entropy Model
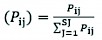
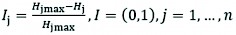
In this study, another model used for the landslide susceptibility map (LSM) was the entropy model index. The entropy represents the amount of instability, disorder, imbalance, and uncertainty of a system (Yufeng and Fengxiang 2009) and the extent to which various factors influence the development of a failure (Pourghasemi et al. 2012). Several essential factors provide additional entropy to the index system. Therefore, the entropy value can be used to calculate the objective weights of the index system. The information coefficient Wj representing the weight value for the parameter as a whole can be calculated by Eqs. (4–8) (Bednarik et al. 2010, 2012, Constantin et al. 2011).
 (4)
(4)
 (5)
(5)
 (6)
(6)
Where:
and Sj is the number of classes.
 (7)
(7)
 (8)
(8)
Where:
a and b indicate the domain and failure percentages, respectively
Pij probability density
Hj and Hjmax indicate the entropy values
Ij information coefficient
Wj represents the resultant weight value for the factor as a whole.
The final failure susceptibility map is prepared by Eq. (9):
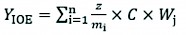 (9)
(9)
Where:
YIOE sum of all the classes
i number of particular parametric map
z number of classes within the parametric map with the most significant number of classes
mi number of classes within a particular parametric map
C value of the class after secondary classification
Wi weight of a parameter (Bednarik et al. 2010, Devkota et al. 2013). The result of this summation indicates the various levels of failure susceptibility (Constantin et al. 2011).
2.3.4 Calculating the Average Cost of Road Repair
The information, including the road grade, the height and slope degree of trenches, and the area of TFs in trenches, are recorded. Subsequently, the repair average cost was calculated per kilometer by considering the NSPL in 2019. The cost of maintaining forest roads based on forestry plans includes four items:
Þ repairing and improving road pavements
Þ structures cleaning
Þ regulation and profiling of trenches
Þ cleaning and regulating ditches.
In the present study, the cost of two items, including c and d, was calculated per kilometer as the road repair average cost.
3. Results
3.1 Relationship Between Conditioning Factors and TF Locations
The spatial relationship between each failure conditioning factor and failure locations was evaluated using the three models of FR, Maxent, and LR shown in Table 2. As shown in Table 2, some factor classes gained high values for all three models. These factors include the distance from faults (classes of 0–200 m and 200–400 m), slope gradient (20–30°), elevation (500–800 m), lithology formation (Diorite-gabbro, gabbro volcanic rocks), and soil (forest brown soil with acidic pH along with ranker soil in steep lands). The overall analysis of conditioning factors revealed that the two factors of distance from faults and slope gradient were more influential than other factors (Table 2). The result of the spatial relationship between conditioning factors and TF locations revealed that the class of 0–200 m distance to faults had the highest values of 3.49, 0.281, and –0.256 in FR, Maxent, and LR models, respectively. Additionally, the relationship between terrain slope and failure probability showed that the class of 20–30° had the highest FR, Maxent, and LR values (1.22, 0.212, and 0.189, respectively). In contrast, the class of 40–50° indicated the lowest values (0.72, 0.124, and 0.050 respectively) for FR, Maxent, and LR models.
Table 2 Frequency ratio, entropy ratio, and logistic regression coefficient values for causative factors
|
Factor |
Class |
Frequency |
Entropy |
Logistic regression |
|||
|
Percentage of domain pixels |
Percentage of failure pixels |
Frequency ratio |
Eij |
Entropy ratio |
Logistic coefficient |
||
|
Terrain slope |
0–10 |
26.31 |
16.92 |
0.64 |
0.112 |
0.139 |
0.189 |
|
10–20 |
26.64 |
30.29 |
1.14 |
0.198 |
|||
|
20–30 |
26.28 |
32.15 |
1.22 |
0.212 |
|||
|
30–40 |
14.74 |
16.07 |
1.09 |
0.189 |
|||
|
40–50 |
4.96 |
3.55 |
0.72 |
0.124 |
|||
|
>50 |
1.08 |
1.02 |
0.94 |
0.164 |
|||
|
Aspect |
Flat |
6.11 |
1.35 |
0.22 |
0.032 |
0.042 |
0.068 |
|
North |
15.94 |
14.55 |
0.91 |
0.132 |
|||
|
North East |
15.32 |
11.84 |
0.77 |
0.112 |
|||
|
East |
10.40 |
9.14 |
0.88 |
0.127 |
|||
|
South East |
7.84 |
8.29 |
1.06 |
0.153 |
|||
|
South |
6.44 |
5.08 |
0.79 |
0.114 |
|||
|
South West |
11.86 |
10.83 |
0.91 |
0.132 |
|||
|
West |
14.88 |
19.97 |
1.34 |
0.195 |
|||
|
North West |
14.31 |
18.95 |
1.09 |
0.159 |
|||
|
Elevation, m.a.s.l |
0–200 |
34.29 |
31.47 |
0.92 |
0.179 |
0.118 |
–0.121 |
|
200–500 |
25.87 |
30.46 |
1.18 |
0.230 |
|||
|
500–800 |
15.66 |
26.23 |
1.67 |
0.327 |
|||
|
800–1100 |
11.24 |
6.43 |
0.57 |
0.112 |
|||
|
1100–1400 |
7.02 |
5.41 |
0.77 |
0.151 |
|||
|
>1400 |
5.92 |
0 |
0 |
0 |
|||
|
Lithology |
Q1al |
16.61 |
1.69 |
0.10 |
0.004 |
0.279 |
0.005 |
|
K2v |
11.56 |
9.31 |
0.80 |
0.03 |
|||
|
Rjssh |
28.64 |
38.41 |
1.34 |
0.05 |
|||
|
JK1 |
15.65 |
25.38 |
1.62 |
0.061 |
|||
|
gb |
0.19 |
3.55 |
18.66 |
0.704 |
|||
|
JKms |
17.72 |
10.15 |
0.57 |
0.022 |
|||
|
JKv |
3.52 |
8.29 |
2.35 |
0.088 |
|||
|
K11 |
3.09 |
3.21 |
1.04 |
0.039 |
|||
|
Qm1 |
3 |
0 |
0 |
0 |
|||
|
Distance to faults, m |
0–200 |
5.33 |
18.61 |
3.49 |
0.281 |
0.135 |
–0.256 |
|
200–400 |
3.58 |
9.81 |
2.74 |
0.220 |
|||
|
400–700 |
5.45 |
10.15 |
1.86 |
0.150 |
|||
|
700–1000 |
5.60 |
10.83 |
1.93 |
0.155 |
|||
|
1000–1500 |
9.65 |
18.61 |
1.93 |
0.155 |
|||
|
>1500 |
70.38 |
31.98 |
0.45 |
0.036 |
|||
|
Distance to rivers, m |
0–100 |
5.32 |
7.45 |
1.40 |
0.208 |
0.0246 |
0.144 |
|
100–200 |
4.98 |
3.72 |
0.75 |
0.111 |
|||
|
200–300 |
4.91 |
3.72 |
0.76 |
0.112 |
|||
|
300–400 |
4.8 |
7.11 |
1.48 |
0.220 |
|||
|
400–500 |
4.63 |
6.43 |
1.39 |
0.206 |
|||
|
>500 |
7.35 |
71.57 |
0.95 |
0.141 |
|||
|
Curvature |
Concave |
35.39 |
38.07 |
1.08 |
0.364 |
0.004 |
0.049 |
|
Flat |
25.39 |
21.49 |
0.85 |
0.286 |
|||
|
Convex |
39.22 |
40.44 |
1.03 |
0.349 |
|||
|
Soil type |
1.51 |
14.71 |
4.57 |
0.31 |
0.037 |
0.174 |
0.133 |
|
1.5.2 |
14.65 |
10.15 |
0.69 |
0.083 |
|||
|
1.5.3 |
16.35 |
19.97 |
1.22 |
0.15 |
|||
|
2.5.1 |
5.37 |
5.92 |
1.10 |
0.13 |
|||
|
2.5.2 |
10.02 |
18.78 |
1.87 |
0.22 |
|||
|
2.5.3 |
23.8 |
17.43 |
0.73 |
0.087 |
|||
|
2.5.4 |
9.55 |
23.18 |
2.43 |
0.29 |
|||
|
5.5.2 |
4.84 |
0 |
0 |
0 |
|||
|
1.5.4 |
0.72 |
0 |
0 |
0 |
|||
3.2 Simulation
Applying TF susceptibility maps is commonly a fundamental stage in managing failure risks (Chen et al. 2018) and improving road network design. The spatial distribution of different TF susceptibility classes is illustrated in Table 3. TF probability map in studied watersheds was prepared using 70% of recorded TFs by frequency, entropy, and logistic regression methods in GIS software. It is classified as very low, low, medium, high, and very high based on natural failures (Fig. 3). Table 3 shows that the percentages of susceptibility to movement in »high« and »very high« classes were 51.38, 47.77, and 31.49% in logistic regression, frequency ratio, and maximum entropy models, respectively.
As can be seen in Fig. 3, slip sensitivity by using the logistic regression model is more accurate than by using the other two models.
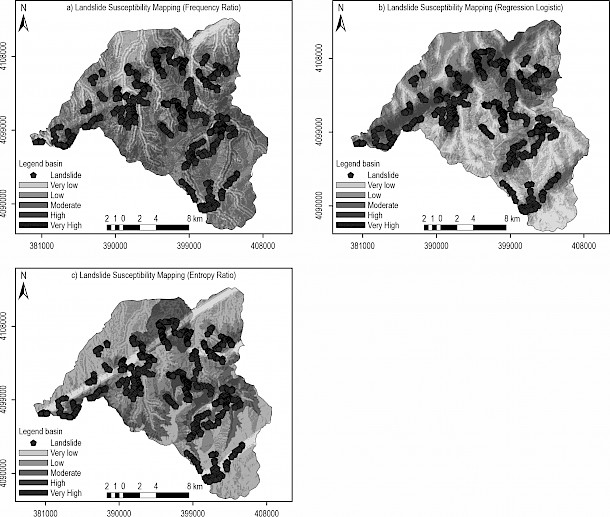
Fig. 3 Failure susceptibility maps simulated using entropy ratio models
Table 3 Comparison of percentages of failure susceptibility levels in three investigated models
|
LR |
FR |
Maxent |
Failure classes |
|
4.6 |
5.84 |
7.16 |
Very low |
|
32.28 |
16.27 |
33.35 |
Low |
|
11.74 |
30.82 |
28 |
Moderate |
|
34.85 |
33.15 |
20.01 |
High |
|
16.53 |
13.92 |
11.48 |
Very high |
3.3 Validation and Comparison of Models
Most scientists believe that the performance of all modeling methods needs to be evaluated. However, there is no explicit agreement concerning which methods are the best or must be used given regional variability. It is more challenging when the linguistic models or frequency-based methods are applied, or when famous validation statistics such as determination coefficient or root mean square error could not be calculated. As stated earlier, in the present study, the area under curve (AUC) was used to evaluate the models results (Fig. 4). The AUC value was calculated using the true positive percentage and the false positive percentage values for each class that constitutes the curve. Results confirmed that all three models had decent capacity of susceptibility prediction. Therefore, the AUC values of 68.2%, 65.5%, and 74.6%, respectively, for FR, Maxent, and LR models, showed reasonable generalization power. However, the LR model showed the best performance (74.6%) in mapping TF susceptibility in the study area, whereas the Maxent model had the smallest AUC value (65.5%). The LR proved to be the best model, capable of combining expert knowledge with field datasets in susceptibility modeling.
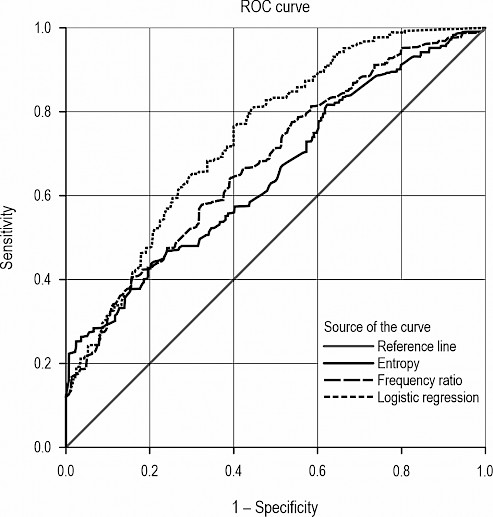
Fig. 4 Accuracy assessment and success rate curve of the applied TF susceptibility models
Overlapping the existing forest road network map on the LR simulated TF susceptibility map indicated that 43.25% of the total length and about 4.3 km2 of the total surface were the roads located on »high« and »very high risk« areas (Table 4 and Fig. 5).
Table 4 Transit rate of forest roads from failure areas in the logistic regression model
|
Failure risk |
Area, km2 |
Length, % |
|
Very low |
1.0909 |
10.93 |
|
Low |
2.3709 |
23.75 |
|
Moderate |
2.2013 |
22.05 |
|
High |
3.0097 |
30.16 |
|
Very high |
1.3066 |
13.09 |
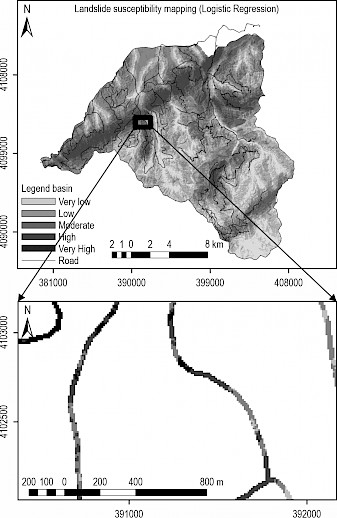
Fig. 5 Available network of forest roads in zoning of landslide risk of the logistic regression model
3.4 Estimating Repair Costs of Forest Road Trenches based on NSPL
The NSPL was used to calculate and estimate the cost of repairing forest roads related to (1) regulating and profiling the level of ditches along the road in trenches and (2) regulating the floors and dug ditches (sidewalks) after falling soils in forest road trenches. According to the destructed area of the forest road trenches and shoulders in 844 recorded points, which were calculated in the field survey, the repair costs of the above two repairing operations were estimated at about 0.039 and 0.058 dollars, respectively (Table 6). It was also estimated that the cost of regulating and profiling slopes and side ditches is 10,872 dollars per kilometer.
Table 6 Cost of repairing operations in trenches and side ditches based on the NSPL in 2019
|
Row |
Description |
Unit |
Unit price Dollars |
Amount |
Total price Dollars |
|
240301 |
Cyclic assessment of the stability of trenches and gables, drainage systems and assessment of causes of trench slippage and road failure, and completion of checklists related to equipping and dispatching safety expert, |
People-hours |
4.19 |
240 hours |
1006.73 |
|
030501 |
Adjusting and profiling the gable surface and side roads in the trenches |
Square meters |
0.039 |
26,117,860 |
1,010,044.67 |
|
020501 |
Leveling and regulating the floor of excavated foundations and canals |
Square meters |
0.058 |
36,700 |
2133.8 |
|
031401 |
Correction and sloping of gables |
Square meters |
0.045 |
36,984 |
1646.28 |
|
031205 |
Repairing and leveling detours with a grader or other mechanical equipment |
Kilometer |
40.26 |
058/13 |
525.66 |
|
020401 |
Loading materials from any type of earthworks and transporting with any type of manual device up to 20 meters |
Cubic meters |
1.075 |
5/64350 |
69,191.02 |
|
Total |
1,084,548.16 |
||||
According to the field survey of 844 failures on forest roads in the study area, 18 points had critical movements (mass drift) with a total area of more than 1000 m2 that have blocked the roads (Fig. 4). Table 7 shows the total volume and estimated cost of construction of gabion walls in 18 points with mass movement based on the NSPL in 2019.
Table 7 Estimation of gabion wall construction cost in 18 points with mass movement based on the NSPL in 2019
|
Row |
Description |
Unit |
Unit price Dollars |
Amount |
Total price Dollars |
|
060501 |
Technical hydraulic founding by mechanical devices in soft lands up to a depth of 2 meters and carrying excavated soil up to a distance of 20 meters from the center of gravity |
Square meters |
0.44 |
908 |
397.75 |
|
061301 |
Loading of materials from soil operations or compacted soils and transporting them by truck or any other mechanical device up to a distance of 100 meters from the center of gravity and unloading it |
Square meters |
0.17 |
908 |
157.49 |
|
070202 |
Preparation, construction, and installation of gabion with galvanized wire mesh (13 kg per cubic meter) and carcass stone |
Square meters |
14.02 |
2432 |
34,091.04 |
|
061306 |
Transportation of materials from earthworks or compacted soils, including soil and rocks, on unpaved roads If the transport distance is more than 75 km, for every 1 km exceeding 75 km |
Square meters-kilometers |
0.037 |
85,363 |
3203 |
|
Total |
37,849.28 |
||||
4. Discussion
Landslides are one of the most hazardous natural disasters, and the government attempts to measure the extent of damage and show its spatial distribution every year. Identifying the areas susceptible to landslide and zoning them as significant hazards in mountainous areas and forest roads is one of the main steps in planning, designing, and preventing the collapse of forest road trenches. Spatial modeling is a useful tool for a better comprehension of the causes of landslides in forest areas. The present study primarily investigated the influential factors of landslide risk and executed the landslide hazard zonation mapping for temperate forests in northern Iran to be utilized to construct and maintain forest roads, limiting the damages of disorganizations caused by road constructions in the forests. Subsequently, the costs of these damages were estimated by identifying and calculating the extent of landslides along the trenches of forest roads in northern Iran using the applicable standards.
In the current study, ROC plot assessment results (Fig. 4) show that, in the TF susceptibility maps using the FR, Maxent, and LR models, the AUCs were 0.682, 0.655, and 0.746, respectively. Therefore, the LR model exhibited the best performance in the current study, which is consistent with other studies (e.g., Can et al. 2005, Lee and Pradhan 2006, Greco et al. 2007, Nefeslioglu et al. 2008, Ozdemir and Altural 2013, Shahabi et al. 2014, Shirani and Arabameri 2015, Hong et al. 2016, Aditian et al. 2018). Better results of the logistic regression method can be due to its computation of weight-based combinations of significant factors and exclusion of insignificant factors from the consideration, which provides more reliable results. Besides, this model nonparametric nature makes it able to analyze non symmetrically distributed instability factors (Nandi and Shakoor 2009).
The logistic regression modeling indicates that independent variables, including distance from faults, slope degrees, and soil moisture, significantly influenced the failure areas. Table 2 shows that distance from the fault with negative coefficient in the logistic regression model had a significant relationship with TF occurrence. Furthermore, it had a high impact on the occurrence of a failure in two other models. According to the results, when the distance from the fault decreased, the rate of slippage of forest road trenches increased. In the study area, most of TFs was observed on the first two distances from the fault categories (0–200 and 200–400 meters). Cracks reduce the impact of the earthquake and reduce the likelihood of TFs. Demir (2019), in a study in Turkey, concluded that the factors of distance from the road and fault played a key role in the occurrence of TFs in the study area. According to the results of the logistic regression model in this study, except for the factor of distance from the fault, the other most important factor affecting the failure was terrain slope with a positive coefficient and significant relationship with TF occurrence. Results i Table 2 showed that most failures happened at the slope of 20–30 degrees. According to the results, with increasing slope to a certain extent, the field failure density increased, but it decreased after that. Mohammady et al. (2012) stated that the resistive force, such as soil friction, is usually higher than the driving forces such as gravity in low slopes. The present study showed that conditions are prepared for TF occurrence when the slope reaches 20 degrees. In such a situation, gravity prevails over the resistance force, once effective rainfall and instability of forest road trenches, having a sufficient slope for TFs. Mohammady et al. 2012 also concluded that failures generally occur on slopes of 15–30 degrees. Other researchers also introduced such slopes as failure-sensitive areas, Abasian et al. 2017 (slope floor of 0–20 degrees), Lee et al. 2006 (slopes of 36–20 degrees), Eker and Aydin 2014 (slopes of 15–30 degrees). The number of failures was less in high slopes, which can be attributed to a higher rockshare in the subsoil and thinner soil layer on this slope. Once the slope increases, the shear stress is exceeded. The gentle slope gradients are typically expected to have lower weight values since they are associated with lower shear stresses (Pourghasemi et al. 2012). One of the main reasons is that road construction changes the terrain form. Terrain profile deformation compromises the water flow continuity and reduces the slope drain ability and its stability. Another reason is the forest landscape changes or large-scale logging, which change the soil infiltration and ground evapotranspiration rates, thus indirectly affecting the water contents in soil and reducing slope stability (Vanacker et al. 2005). When the soils are saturated, the liquid water content of the sunny aspect subsoil is exceeded, while the shady aspect subsoil is not the same (Owen 1981). The soil with a high infiltration rate creates a fast flow of water into the soils down the profiles, where there is higher clay content; water flow is stagnated, causing failures (Kitutu et al. 2009).
The results of the abundance and entropy ratios models indicate the influence of Diorite-Gabbro class of geological factors on the occurrence of TFs. Remarkable TFs occurred in this formation while covering a very small area in the research area. According to Table 2, two soil classes of 2.5.4 and 2.5.2 were the most susceptible to TFs. The class 2.5.4 (forest brown soil with acidic pH along with ranker soil in steep lands) are characterized by alluvial rocks with limestone, and 2.5.2 is composed of sandstone, siltstone, and charcoal shale in sloping lands. Restrictions are seen in some shallow parts of the soil and the presence of unstable parent rocks, given that most of these subunits act as a secondary factor in shallow areas due to faults (the leading cause of failures). Shariat Jafari (1997) stated that completely altered rocks, loamy soils, alluvium, and alluvial deposits are susceptible to failure.
Regarding the altitude factor from the sea level (Table 2), with increasing altitude, the amount of failures increased to a certain extent. This amount declined due to increasing altitude, increasing rainfall and making sensitivity failures more common at high altitudes. At higher altitudes, this trend is usually in the form of snow, and the predominance of glaciers over much of the year decreases the failures. Demir et al. (2013) and Safari et al. (2015) also concluded that most failures occurred in the middle altitudes between 850–1000 m.
A majority of TFs affecting the road forest network appears to be related to faults and localized slope failures in cut slopes. As shown in this study results, unlike some other studies that consider the soil properties as the main factors in failure occurrence, the most critical factor affecting failures is the distance to faults. This is due to the proximity to existing active faults and the seismicity of the area. Overlaying the existing roads layer on the classified susceptibility map simulated from the logistic regression model clarified that 43.25% of the forest roads in the study area were located on »very high« risky areas.
In the present research, the cost of repairing side trenches and sidewalks per kilometer (10,872$) was estimated three times higher than the forest replantation document (2655$), prepared by the experts. Klose et al. (2014), by modeling the cost of failures on mountain roads in Germany, concluded that the annual costs of repairing excavation per kilometer in the road at risk of failures are above average (52,000$). Donnini et al. 2017 conducted a statistical analysis of the impact of failures on a road network in Italy. They stated that there is no standard procedure for collecting failure damage, and related cost data does not exist in Italy and many other countries. They concluded that the average cost of repairing slippery areas and road trenches damaged by failures in the Marche region was 1,958,000$ and 43,523$ per kilometer. Heam et al. 2008 predicted an average cost of road repairing due to failures at an average annual cost of 50,000$ per kilometer for 2009–2013 in a rainy season. Vranken et al. 2013 estimated the annual cost of road damage to be $ 92,665, including two types of repair costs of 81,645$ and 11,200$, respectively. Klose et al. 2015 in Germany found that failure restoration costs were complicated to obtain, and where available, their accuracy and reliability were challenging to evaluate. Heam et al. 2008 used information on the national road network in the People’s Democratic Republic (PDR) of Laos and road maintenance costs for the period 2004–2007 to estimate the annual average failure expenditure per kilometer in the range of 1000–1500$. Klose et al. (2015) estimated an average repairing cost of 52,000$ per kilometer for a highway at risk of failure in the Lower Saxon Uplands, NW Germany, in 1980–2010.
5. Conclusions
Stopping the harvesting operations in the forests of northern Iran in recent years, consequently followed by a sharp decline in revenues, has led to the lack of allocated funds for repairing forest roads. These budget constraints have made it challenging to carry out various forestry projects such as reforestation, protection, firefighting, harvesting, and other silvicultural operations. Regarding forest roads crucial role in sustainable forest management and country development, stopping the operations of forest road repairs will cause a severe problem for this national capital shortly. The gabion walls will be a low-cost operation that may affect the stability of the road trenches, pavement, drainage structures durability, and even flood control. More researches are needed in the future to test using gabion walls to stabilize the areas of forest road trenches that are susceptible to landslides.
5. References
Abasian, A., Naghdi, R., Ghajar, I., 2017: Planning a single forest road based on an artificial neural network model of landslide susceptibility (case study: Kojour watershed). Journal of Forests and wood products 70(3): 499–508.
Aditian, A., Kubota, T., Shinohara, Y., 2018: Comparison of GIS-based landslide susceptibility models using frequency ratio, logistic regression, and artificial neural network in a tertiary region of Ambon, Indonesia. Geomorphology 318: 101–111. https://doi.org/10.1016/j.geomorph.2018.06.006
Alimohammadlou, Y., Najafi A., Yalcin, A., 2013: Landslide process and impacts: A proposed classification method. Catena 104: 219–232. https://doi.org/10.1016/j.catena.2012.11.013
Akay, A.E., 2006: Minimizing total costs of forest roads with a computer-aided design model. Sadhana- Academy Proceedings in Engineering Sciences 31(5): 621–633. https://doi.org/10.1007/BF02715918
Bednarik, M., Magulova´, B., Matys, M., Marschalko, M., 2010: Landslide susceptibility assessment of the Kralˇovany–Liptovsky´ Mikula´sˇ railway case study. Physics Chemistry Earth Parts A/B/C 35(3): 162–171. https://doi.org/10.1016/j.pce.2009.12.002
Bednarik, M., Yilmaz I., Marschalko, M., 2012: Landslide hazard and risk assessment: a case study from the Hlohovec–Sered landslide area in south-west Slovakia. Natural Hazards 64(1): 547–575. https://doi.org/10.1007/s11069-012-0257-7
Bhandary, N.P., Dahal, R.K., Timilsina, M., Yatabe, R., 2013: Rainfall event based landslide susceptibility zonation mapping. Natural Hazards 69(1): 365–388. https://doi.org/10.1007/s11069-013-0715-x
Budimir, M.E.A., Atkinson, P.M., Lewis, H.G., 2015: A systematic review of landslide probability mapping using logistic regression. Landslides 12(3): 419–436. https://doi.org/10.1007/s10346-014-0550-5
Can, T.H.A., Nefeslioglu, C., Gokceoglu, H., Sonmez, Y., Duman., 2005: Susceptibility Assessment of Shallow Earth Flows Triggered by Heavy Rainfall at three Catchments by Logistic Regression Analysis. Journal Geomorphology 72(1–4): 250–271. https://doi.org/10.1016/j.geomorph.2005.05.011
Chauhan, S., Sharma, M., Arora, M.K., 2010: Landslide susceptibility zonation of the Chamoli region, Garhwal Himalayas, using logistic regression model. Landslides 7(4): 411–423. https://doi.org/10.1007/s10346-010-0202-3
Chen, W., Peng, J., Hong, H., Shahabi, H., Pradhan, B., Liu, J., Zhu, A.-X., Pei, X., Duan, Z., 2018: Landslide susceptibility modelling using GIS-based machine learning techniques for Chongren County, Jiangxi Province, China. Science of Total Environment. 626: 1121–1135. https://doi.org/10.1016/j.scitotenv.2018.01.124
Constantin, M., Bednarik M., Jurchescu, M.C., Vlaicu, M., 2011: Landslide susceptibility assessment using the bivariate statistical analysis and the index of entropy in the Sibiciu Basin (Romania). Environmental Earth Sciences 63(2): 397–406. https://doi.org/10.1007/s12665-010-0724-y
Dean, D., 1997: Finding optimal routes for networks of harvest site access roads using GIS-based techniques. Canadian Journal of Forest Research 27(1): 11–22. https://doi.org/10.1139/x96-144
Del Ventisette, C., Garfagnoli, F., Ciampalini, A., Battistini, A., Gigli, G., Moretti, S., Casagli, N., 2012: An integrated approach to the study of catastrophic debris-flows: geological hazard and human influence. Natural Hazards and Earth System Sciences 12(9): 2907–2922. https://doi.org/10.5194/nhess-12-2907-2012
Demir, G., 2019: GIS-based landslide susceptibility mapping for a part of the North Anatolian Fault Zone between Reşadiye and Koyulhisar (Turkey). Catena 183: 104211. https://doi.org/10.1016/j.catena.2019.104211
Demir, G., Aytekin, M., Akgün, A., Ikizler, S.B., Tatar, O., 2013: A comparison of landslide susceptibility mapping of the eastern part of the North Anatolian Fault Zone (Turkey) by likelihood-frequency ratio and analytic hierarchy process methods. Natural hazards 65(3): 1481–1506. https://doi.org/10.1007/s11069-012-0418-8
Department of Natural Resources and Watershed Management of Guilan Province. The manual of forestry plans of 24 and 25 (Malekroud and Shenroud) watersheds; 2016, 205 p.
Devkota, K.C., Regmi, A.D., Pourghasemi, H.R., Yoshida, K., Pradhan, B., Ryu, I.C., Dhital, M.R., Althuwaynee, O.F., 2013: Landslide susceptibility mapping using certainty factor, index of entropy and logistic regression models in GIS and their comparison at Mugling–Narayanghat road section in Nepal Himalaya. Natural Hazards 65(1): 135–165. https://doi.org/10.1007/s11069-012-0347-6
Donnini, M., Napolitano, E., Salvati, P., Ardizzone, F., Bucci, F., Fiorucci, F., Santangelo, M., Cardinali, M., Guzzetti, F., 2017: Impact of event landslides on road networks: a statistical analysis of two Italian case studies. Landslides 14(4): 1521–1535. https://doi.org/10.1007/s10346-017-0829-4
Eker, R., Aydın, A., 2016: Landslide Susceptibility Assessment of Forest Roads. European Journal of Forest Engineering 2(2): 54–60.
Eker, R., Aydın, A., 2014; Assessment of forest road conditions in terms of landslide susceptibility: a case study in Yığılca Forest Directorate (Turkey). Turkish Journal of Agriculture and Forestry 38(2): 281–290. https://doi.org/10.3906/kim-1204-72
Ferentinou, M., Chalkias, C., 2013: Mapping mass movement susceptibility across Greece with GIS, ANN and statistical methods. Landslide Science and Practice. Springer, Berlin, Heidelberg, 321–327 p. https://doi.org/10.1007/978-3-642-31325-7_42
Girvetz, E., Shilling, F., 2003: Decision support for road system analysis and modification on the Tahoe National Forest. Environmental Management 32(2): 218–233. https://doi.org/10.1007/s00267-003-2970-1
Görcelioğlu, E., 2004: Forest Road Erosion Relations. Istanbul University, Faculty of Forestry Publication, (4460/476), 184 p.
Grace, J.M., 2000: Forest road side slopes and soil conservation techniques. Journal of Soil and Water Conservation 55(1): 96–101.
Greco, R., Sorriso-Valvo, M., Catalano, E., 2007: Logistic regression analysis in the evaluation of mass movements susceptibility: The Aspromonte case study, Calabria, Italy. Journal Engineering Geology 89(1–2): 47–66. https://doi.org/10.1016/j.enggeo.2006.09.006
Gümüş, S., Acar, H.H., Toksoy, D., 2008: Functional forest road network planning by consideration of environmental impact assessment for wood harvesting. Environmental Monitoring Assessment 142(1): 109–116. https://doi.org/10.1007/s10661-007-9912-y
Hasmadi, M.I., Kamaruzaman, J., Azizon, J.M., 2008: Forest road assessment in Ulu Muda Forest Reserve, Kedah, Malaysia. Modern Applied Science 2(4): 100–108.
He, Y., Beighley, R.E., 2008: GIS-based regional landslide susceptibility mapping: a case study in southern California. Earth Surface Processes Landforms 33(3): 380–393. https://doi.org/10.1002/esp.1562
Hearn, G.J., Hunt, T., Aubert, J., Howell, J.H., 2008: Landslide impacts on the road network of Lao PDR and the feasibility of implementing a slope management programme. International Conference on Management of Landslide Hazard in the Asia-Pacific Region. Sendai, Japan.
Hong. H., Naghibi, S. A. Pourghasemi. H.R., 2016: GIS-based landslide spatial modeling in Ganzhou City, China. Arab Geomorphology Science Journal 9(2): 112. 10.1007/s12517-015-2094-y
Hosseini, S.A., Mazrae, M.R., Lotfalian, M., Parshakhoo, A., 2012: Designing an optimal road network by consideration of environmental impacts in GIS. Journal Environmental Engineering and Landscape Management 20(1): 58–66. https://doi.org/10.3846/16486897.2012.662748
Jaafari, A., Najafi, A., Pourghasemi, H.R., Rezaeian, J., Sattarian, A., 2014: GIS-based frequency ratio and index of entropy models for landslide susceptibility assessment in the Caspian forest, northern Iran. International Journal of Environmental Science and Technology 11(4): 909–926. https://doi.org/10.1007/s13762-013-0464-0
Jones, J.A., Swanson, F.J., Wemple, B.C., Snyder, K.U., 2000: Effects of roads on hydrology, geomorphology, and disturbance patches in stream networks. Conservation Biology 14(1): 76–85. https://doi.org/10.1046/j.1523-1739.2000.99083.x
Kitutu, M.G., Muwanga, A., Poesen, J., Deckers, J.A., 2009: Influence of soil properties on landslide occurrences in Bududa district, Eastern Uganda. African Journal of Agricultural Research 4(7): 611–620. https://doi.org/10.5897/AJAR.9000430
Klose, M., Highland, L., Damm, B., Terhorst, B., 2014: Estimation of direct landslide costs in industrialized countries: challenges, concepts, and case study. Landslide Science for a Safer Geoenvironment (2): 661–667. https://doi.org/10.1007/978-3-319-05050-8_103
Klose, M., Damm, B., Terhorstet, B., 2015: Landslide cost modeling for transportation infrastructures: a methodological approach. Landslides 12(2): 321–334. https://doi.org/10.1007/s10346-014-0481-1
Larsen, M.C., Parks, J.E., 1997: How wide is a road? The association of roads and mass-wasting in a forested mountain environment. Earth Surface Processes and Landforms 22(9): 835–848. https://doi.org/10.1002/(SICI)1096-9837(199709)22:9<835::AID-ESP782>3.0.CO;2-C
Lee, S., Talib, J.A., 2005: Probabilistic landslide susceptibility and factor effect analysis. Environmental Geology 47(7): 982–990. https://doi.org/10.1007/s00254-005-1228-z
Lee, S., Ryu, J.H., Lee, M.J., Won, J.S., 2006: The Application of artificial neural networks to landslide susceptibility mapping at Janghung, Korea. Mathematical Geology 38(2): 199–220. https://doi.org/10.1007/s11004-005-9012-x
Lee, S., Pradhan, B., 2006: Probabilistic Landslide risk mapping at Penang Island, Malaysia. Earth System Science Journal 115(6): 661–672. https://doi.org/10.1007/s12040-006-0004-0
Liu, K., Sessions, J., 1993: Preliminary planning of road systems using digital terrain models. Journal of Forest Engineering 4(2): 27–32. https://doi.org/10.1080/08435243.1993.10702646
Mohammady, M., Pourghasemi, H.R., Pradhan, B., 2012: Landslide susceptibility mapping at Golestan Province Iran: a comparison between frequency ratio, Dempster–Shafer, and weights-of evidence models. Journal Asian Earth Science 61: 221–236. https://doi.org/10.1016/j.jseaes.2012.10.005
Murray, A., 1998: Route planning for harvest site access. Canadian Journal of Forest Research 28(7): 1084–1087. https://doi.org/10.1139/x98-122
Nandi, A., Shakoor, A., 2009: A GIS-based landslide susceptibility evaluation using bivariate and multivariate statistical analyses. Engineering Geology 110(1–2): 11–20. https://doi.org/10.1016/j.enggeo.2009.10.001
Nefeslioglu, H.A., Gokceoglu, C., Sonmez, H., 2008: An assessment on the use of logistic regression and artificial neural networks with different sampling strategies for the preparation of landslide susceptibility maps. Journal Engineering Geology 97(3–4): 171–191.
Ozdemir, A., Altural, T., 2013: A comparative study of frequency ratio, weights of evidence and logistic regression methods for landslide susceptibility mapping: Sultan Mountains, SW Turkey. Journal of Asian Earth Sciences 64: 180–197. https://doi.org/10.1016/j.jseaes.2012.12.014
Owen, R.C., 1981: Soil strength and microclimate in the distribution of shallow landslides. Journal Hydrology (NEW Zealand) 20(1): 17–26.
Plan and Budget Organization of Iran. Basic unit price list of roads, railways, and airport runways, 2019, 147 p.
Pradhan, B., Lee, S., 2009: Delineation of landslide hazard areas on Penang Island, Malaysia, by using frequency ratio, logistic regression, and artificial neural network models. Environmental Erath Science 60(5): 1037–1054. https://doi.org/10.1007/s12665-009-0245-8
Pourghasemi, H.R., Mohammady, M., Pradhan, B., 2012: Landslide susceptibility mapping using index of entropy and conditional probability models in GIS: Safarood Basin, Iran. Catena 97: 71–84. https://doi.org/10.1016/j.catena.2012.05.005
Quan, H.C., Lee, B.G., 2012: GIS-based landslide susceptibility mapping using analytic hierarchy process and artificial neural network in Jeju (Korea). KSCE Journal of Civil Engineering 16(7): 1258–1266. https://doi.org/10.1007/s12205-012-1242-0
Reichenbach, P., Ardizzone, F., Cardinali, M., Galli, M., Guzetti, F., Salvati, P., 2002: Landslide events and their impact on the transportation network in the Umbria region, central Italy. Proceedings of the 4th EGS Plinius Conference held at Mallorca, Spain.
Radfar, I., Zolfani, S.H., Rezaciniya, N., Shadifar, M., 2011: Using AHPCOPRAS- G method for forest road locating. In: Second IEEE International Conference on Emergency Management and Management Sciences (ICEMMS), Beijing, 547–550 p.
Safari, A., Riati, M., Ahmadi, M., Shirzad, L., 2015: Landslide Hazard Zonation Using Frequency Ratio and Fuzzy System. Journal of Geography and Environmental Hazards 8(30): 15–30.
Shahabi, H., Khezri, S., Ahmad, B.B., Hashim, M., 2014: Landslide susceptibility mapping at central Zab basin, Iran: a comparison between analytical hierarchy process, frequency ratio and logistic regression models. Catena 115: 55–70. https://doi.org/10.1016/j.catena.2013.11.014
Shariat Jafari, M., 1997: Landslide (principal and basic of natural slopes stable). Sazeh publication, 218 p.
Shirani, K., Arabameri, A.R., 2015: Landslide Hazard Zonation Using Logistic Regression Method (Case Study: Dez-e-Oulia Basin). Journal of Science and Technology of Agriculture and Natural Resources 19(72): 321–335.
Vranken, L., Van Turnhout, P., Van Den Eeckhaut, M., Vandekerckhove, L., Poesen, J., 2013: Economic valuation of landslide damage in hilly regions: A case study from Flanders, Belgium. Science of the Total Environment 447: 323–336. https://doi.org/10.1016/j.scitotenv.2013.01.025
Yufeng, S., Fengxiang, J., 2009: Landslide stability analysis based on generalized information entropy. International Conference Environmental Science and Information Application Technology 2: 83–85. https://doi.org/10.1109/ESIAT.2009.258
Vanacker, V., Molina, A., Govers, G., Poesen, J., Dercon, G., Deckers, S., 2005: River channel response to short-term human-induced change in landscape connectivity in Andean ecosystems. Geomorphology 72(1–4): 340–353. https://doi.org/10.1016/j.geomorph.2005.05.013
© 2021 by the authors. Submitted for possible open access publication under the
terms and conditions of the Creative Commons Attribution (CC BY) license (http://creativecommons.org/licenses/by/4.0/).
Authors’ addresses:
Aghil Moradmand Jalali, PhD
e-mail: amj6210@gmail.com
Prof. Ramin Naghdi, PhD
e-mail: r.naghdi@guilan.ac.ir
Prof. Ismael Ghajar, PhD *
e-mail: i.ghajar@guilan.ac.ir
University of Guilan
Faculty of Natural Resources
Department of Forestry
Entezam Square,
ZIP code, Someh Sara, Gulian
IRAN
* Corresponding author
Received: December 21, 2020
Accepted: February 20, 2021
Original scientific paper