
Determination of Optimal Distribution and Transportation Network (Wood Transportation in Iran)
doi: 10.5552/crojfe.2022.1779
volume: 43, issue:
pp: 11
- Author(s):
-
- Lotfalian Majid
- Peyrov Saba
- Adeli Kamran
- Pentek Tibor
- Article category:
- Original scientific paper
- Keywords:
- distribution network, linear programming, simplex algorithm, transportation problem, truck capacity, forest based industry
Abstract
HTML
Today, transportation network optimization has become one of the significant aspects of supply chain planning, and even a slight rise in productivity can significantly reduce costs of distribution of wood in the transportation network. In the forest based industry, given that transportation is the main cost of raw wood supply, using transportation planning, distribution should be done in a way so as to minimize the overall wood displacement. Such planning must meet the needs of all demand centers and the distribution supplier points must be used to their full capacity. Accordingly, the present study strived to find an optimal solution for transportation and distribution of raw wood from the main supplier points to small and large centers of wood and paper industries in Iran. This optimization simultaneously focuses on several products and is at the macroeconomic level of the country wood market. To achieve this goal, linear programming – Transportation Simplex Algorithm was used. The results show a significant fall in transportation costs and a more organized wood distribution network than the current situation. This cost reduction can be attributed to decisions about the optimal distribution of wood types, determining transport routes, and opting for the right type of truck supplier based on load tonnage and distance. This plummet in transportation costs plunges the cost of wood and wood products, which will surge competition in the business and will be of interest to manufacturers, distributors, customers and stakeholders in general.
Determination of Optimal Distribution and Transportation Network (Wood Transportation in Iran)
Majid Lotfalian, Saba Peyrov, Kamran Adeli, Tibor Pentek
Abstract
Today, transportation network optimization has become one of the significant aspects of supply chain planning, and even a slight rise in productivity can significantly reduce costs of distribution of wood in the transportation network. In the forest based industry, given that transportation is the main cost of raw wood supply, using transportation planning, distribution should be done in a way so as to minimize the overall wood displacement. Such planning must meet the needs of all demand centers and the distribution supplier points must be used to their full capacity. Accordingly, the present study strived to find an optimal solution for transportation and distribution of raw wood from the main supplier points to small and large centers of wood and paper industries in Iran. This optimization simultaneously focuses on several products and is at the macroeconomic level of the country wood market. To achieve this goal, linear programming – Transportation Simplex Algorithm was used. The results show a significant fall in transportation costs and a more organized wood distribution network than the current situation. This cost reduction can be attributed to decisions about the optimal distribution of wood types, determining transport routes, and opting for the right type of truck supplier based on load tonnage and distance. This plummet in transportation costs plunges the cost of wood and wood products, which will surge competition in the business and will be of interest to manufacturers, distributors, customers and stakeholders in general.
Keywords: distribution network, linear programming, simplex algorithm, transportation problem, truck capacity, forest based industry
1. Introduction
In the forest industry, transportation costs represent major costs and, as one of the most important factors, they constitute more than 45% of the total operating costs in some countries (Acuna 2017). In this situation, to economically justify a transportation network, there is a need for economic planning and optimization, so that today its optimization has become one of the important aspects in supply chain planning (Acuna 2017), to limit the carbon footprint and the machine fuel use (Mederski et al. 2021), taking into account that even a small rise in productivity can decline costs significantly (Malladi et al. 2018). Advances in technology and communications are developing systems supplier based on operation research (OR) algorithms that support transportation decisions. OR models can remarkably ameliorate decisions, as shown in practice. There are many opportunities to implement OR solutions so that companies can organize their transportation operations and allocate resources effectively. In addition, the acquisition of technical knowledge and the development of skills for the implementation of operation research techniques will enable the forest industry to provide innovative solutions in the supply chain sector (Malladi et al. 2018). Unlike technical and economic analysis, transportation optimization models are capable of designing the optimal supply chain according to the possible sets of supply chain, production locations, supply locations, production scales and transportation modes (De Jong et al. 2017, Yue and You 2014). In transport optimization models, the basis of programs is mathematics and all unknowns are represented by decision variables (Holo et al. 2016). The decision model is a set of several steps determining the allocation of supply points to delivery points and the amount of wood for delivery (Moad et al. 2016). The relationships of these variables are expressed by equations called constraints, and an objective function is either maximized or minimized (Holo et al. 2016). Linear programming is one of the most popular programming methods among OR mathematical models (Pedregal 2004). It tries to make optimal decisions in most industries and financial and service organizations and is needed in a wide range of applied programs such as routing, scheduling, and various optimization issues (Cai et al. 2018). Linear programming refers to a planning process that optimizes labor resources, materials, machinery, and capital allocated to minimize the cost or maximize profits (Pedregal 2004). The advantages of linear programming include logical solution algorithms, efficient algorithms supplier based on linear algebra, and simultaneously providing useful economic information on the traction of each variable with respect to the optimal solution (Devlin and Talbot 2014). Simplex algorithm is a mathematical method and includes a table of decision variables that is used to solve linear programming problems (Lotfalian 2011). This algorithm together with its outputs is playing an increasingly important role in transportation decision-making processes (Te Brömmelstroet et al. 2017) and points to one of the most important and successful applications of quantitative analysis to solve business problems in the realm of spatial distribution of goods. Given that transportation is the main factor in the cost of timber supply, the challenge here is to allocate, in conjunction with transportation planning, in a way that minimizes the overall timber displacement (Moad et al. 2016), complying with all the inputs and providing that the transportation place is used at its full capacity (Rönnqvist 2003). The horizon of transportation optimization planning in the forest industry is, at both tactical and operational levels (Malladi et al. 2018), often focused on the tactical level with medium-term planning (Rix et al. 2015). In terms of access, the methods of transportation in this industry are often road (Malladi et al. 2018) or a combination of road and rail (Balaman et al. 2018).
Research shows that a variety of optimization methods have been used to optimize transportation in the forest industry, including Decision Support System (DSS) and network analysis techniques (Parsakhoo et al. 2017); algorithms such as Ant Colony Optimization (ACO) (Lin et al. 2016, Lin et al. 2014, Chung and Contreras 2011); Column Generation optimization (Rix et al. 2015, Rix et al. 2011, Rey et al. 2009); and linear programming approach – transportation simplex algorithm (Devlin and Talbot 2014), Linear mixed-integer programming models (MILP) (Moad 2016, Balaman et al. 2018, Aydinel et al. 2008, Van Dyken 2010); a mixed integer non-linear programming model (Shabani and Sowlati 2013); composition of the source of programming codes and formulas (Nasiri and Lotfalian 2012) Fuzzy ε-constraint method (Balaman et al. 2018); linear programming model (Acuna 2017, Boukherroub et al. 2017, Flisberg et al. 2015, Frisk et al. 2010, Forsberg et al. 2005); optimization – simulation (OS) approach (Marques et al. 2014, Beaudoin et al. 2013, Asikainen 2001); and annealing heuristic algorithm (Han and Murphy 2012). Han et al. (2018) optimized the logistics of residue forest transportation to the road network at a study site in Colorado, USA, and reduced the cost of logistics by up to 11% compared to the conventional system. By optimizing transportation operations planning at a large biomass supply company in British Columbia, Canada, Malladi et al. 2018 could reduce total costs by 12% and significantly reduce fuel consumption (Acuna 2017). In their study, Lin et al. (2016) presented a multi-level ant colony optimization (MLACO) approach to solve the problems of limited forest transport planning, and the results showed higher quality and shorter transportation time using the method. Zamora-Cristales et al. (2015) developed the economic optimization of forest biomass processing and transportation in the northwestern United States of America using mixed integer programming. In their study, the proposed method reported decision-making of various potential saving operations from 3 to 34%. Han and Murphy (2012) optimized the truck loading planning problem for transporting four types of wood biomass in western Oregon, which reduced the total cost of transportation by 18% and reduced the total travel time by 15% compared to the actual schedule. In a large program in southern Sweden with eight forestry companies, Frisk et al. (2010) studied the cost of transportation allocation as an important part of the timber supply chain in forestry and stated that better planning in each company can save up to 14% overall. The study of Gagliardi et al. (2020) on two models of forwarder showed that productivity and average log volume were strongly positively correlated.
Most studies have so far focused on one wood product, and optimization has been less studied as a multi-product. Also, most of the transports in the forest industry are done by road and truck. The present study sought to find the optimal solution for the transportation and distribution of wood from the supplier points to small and large centers of wood and paper industries in the macroeconomic level of the Iranian wood market in the intercity transportation network. To achieve this goal, the linear programming transportation simplex algorithm was used. Furthermore, in this research, the possibility of optimal use of different types of trucks was investigated according to the cost-distance-truck between the supplier point and customer point, as well as the average capacity and maximum capacity (from a legal point of view) of these trucks. Obviously, the aim is to minimize the transportation cost of sending wood after determining the points of supplier and customer, as well as determining the decision variables (transportation routes). We assumed that using Transportation Simplex Algorithm should reduce the distance and costs of wood transportation. The purpose of this study was also to provide an optimal pattern of distribution and transportation of usable wood throughout the country.
2. Materials and Methods
2.1 Case Study
This research was developed on a large scale for Iran for 7 groups of raw wood, including lumber types, cants, industrial wooden sheets, logs, beams, wood fuels and charcoal. As the number of large and small wood demand centers in this country is very high, in this study a total of 89 main centers of wood demand, covering all Iran and receiving wood from 72 sources, were scrutinized. The current transportation of wood in Iran has the following characteristics: The share of transportation in the cost price of goods is higher than the global average (6% for the world and 12% for Iran), almost all raw wood in Iran is transported by road, while up to 12% of other goods are transported by rail (Anon. 2017). About 4 million tons of wood is transported annually in the intercity transport network.
The data required for the research was determined as follows:
Þ determining wood supply centers supplier-based on the volume of transactions and their role in the market and determining the shipping capacity of these centers in the period in question (one year) (Table 2)
Þ determining the demand centers and the volume of raw wood they needed in the desired time period
Þ determining the connection routes of the roads among all supply centers and demand centers and determining the distance in km
Þ determining the truck loading equipment in each route, grouping these trucks according to tonnage (minimum economic capacity and maximum allowable capacity), as well as determining the loading cost of these vehicles as ton-km shipping cost
Þ identifying influential variables and existing constraints (Eq. 1–5)
Þ solving the model using Linear Programming (LP) – Transportation Simplex Algorithm in GAMS Software version 24.1.3
2.2 Research Model
In this research, a transportation simplex algorithm was developed to determine the optimal distribution of wood types using GAMS Software (Fig 1). Using this algorithm, the optimal distribution routes of these woods were determined supplier-based on the amount of customer demand and the distance between the supplier and customer points. Given the trucks available in each of the supplier points, as well as the capacity and cost of ton-kilometers of these vehicles at different distances, the optimal use of these trucks was also determined. The symbols used in the Transportation Problem model are as shown in Table 1.
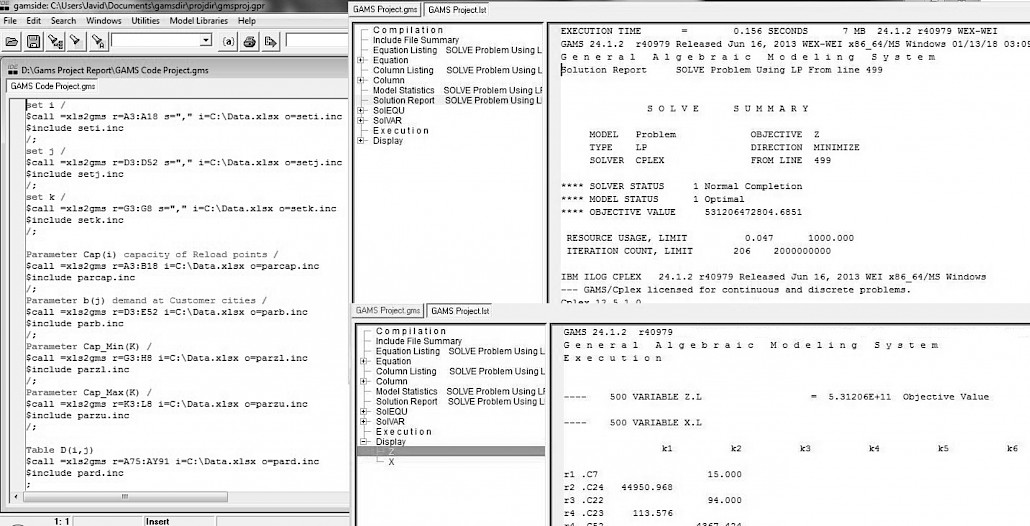
Fig. 1 Model input and output in GAMS Software
Table 1. Notations used in the Transportation Problem model
|
Sets Definition i Set of Supplier points /R1-n/ n All Supplier points j Index of Customer points/D1-m/ m All Customer points p Set of product /p1-6/ k Set of vehicles/k1-6/ Parameter Definition Table Cap(i,p) Capacity of Supplier points Table D(j,p) Demand at customer points Cap_Max(k) Maximum capacity of vehicle k Cap_Min(k) Minimum capacity of vehicle k Table d(i,j) Distance from Supplier i to customer j (km) Table C(i,j,p,k) Transportation cost of one unit of product p from supplier location i to the customer j by vehicle k VARIABLE Z Objective Value Total transportation costs in thousands of Euro X(i,j,p,k) Amount of product p to ship from Supplier i to customer j by vehicle k EQUATIONS Objective Z = E = SUM((i,j,p,k),C(k,i,j)*d(i,j)*X(i,j,p,k)) Constraint1(i) SUM((j,k), X(i,j,p,k) = L= Cap(i) Constraint2(j) SUM((i,k), X(i,j,p,k) = G = D(j) Constraint3(k) SUM((i,j), X(i,j,p,k) = L= Cap_Max(K) Constraint4(k) SUM((i,j), X(i,j,p,k)) = G = Cap_Min(K) Transportation Problem Option Lp = Cplexd SOLVE Transportation Problem using LP minZ DISPLAY Z.l,X.l |
2.2.1 Objective Function
The objective function of the model (MinZ) is to minimize the sum of transportation costs as shown in Eq. (1).
 (1)
(1)
Where:
Z is the sum of transportation costs
C(i,j,p,k) is transportation cost of one unit of product p from Supplier location i to customer j by truck k
d(i,j) is distance from Supplier i to customer j, km
X(i,j,p,k) is amount of product p to transport from Supplier i to customer j by truck k
2.2.2 Constraints
Constraints related to the supply and demand of wood are shown in Eq. (2) and (3).
 (2)
(2)
 (3)
(3)
The demand constraint (Constraint set (2)) indicates that the quantity of product p that is carried by truck k from supplier point i to customer point j must be less than or equal to the capacity of supplier point i of product p. The supply constraint (Constraint set (3)) indicates that the quantity of product p that is carried by the truck k from supplier point i to customer point j must be greater than or equal to the amount of demand of customer point (customer) j of its product p.
Truck capacity constraints are shown in statements (4) and (5).
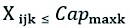 (4)
(4)
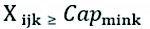 (5)
(5)
The constraint (4) indicates that the amount of wood carried by truck k from supplier point i to customer point j must be less than or equal to the maximum capacity of truck k. Constraint (5) indicates that the amount of wood transported by truck k from supplier point i to customer point j must be greater than or equal to the minimum capacity of truck k, because if this minimum capacity is not met, the cost of transporting tons per kilometer will increase.
2.2.3 Model Implementation
Optimization of wood distribution and transportation was done in the form of road transportation. It is noteworthy that the number of loads and distance traveled were calculated in the two modes - using the maximum loading capacity and the average loading capacity, and that the cost of ton-kilometer road transport in these two modes is equal and only the number of loads and distance traveled has changed. The same pattern was present in wood transportation before optimization.
3. Results
In this section, the results obtained are shown in the mathematical model presented in chapter 2 using data obtained from companies. The model was implemented for a one-year planning horizon in which the optimal distribution and transportation of wood in two modes of using the maximum loading capacity and the average loading capacity has been calculated.
Models are evaluated by determining the total cost of transportation. This cost is supplier based on optimal product distribution, selection of suitable truck, truck routing and use of optimal truck capacity.
Table 2 Total shipping capacity of each type of wood in Iran (Anon. 2016)
|
Product group |
Supplier Capacity, ton |
Tonnage used by the supplier points, ton |
Total capacity of the supplier points, ton |
|
Logs |
1,055,002 |
458,661 |
1,513,663 |
|
Lumber types |
864,438 |
277,858 |
1,142,296 |
|
Industrial wooden sheets |
581,268 |
277,993 |
859,261 |
|
Cants |
175,897 |
95,270 |
271,167 |
|
Wood fuels |
61,267 |
60,444 |
121,712 |
|
Charcoals |
52,504 |
21,757 |
74,261 |
|
Beams |
43,178 |
8091 |
51,269 |
|
Total |
2,833,554 |
1,200,074 |
4,033,628 |
Fig. 2 is a sample in product group distribution map. It shows the supplier and customer points for beams.
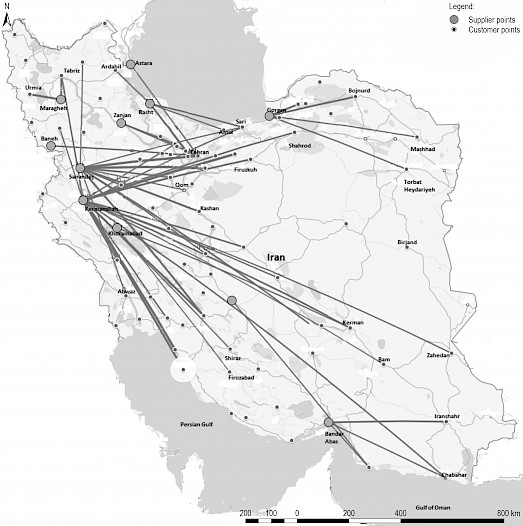
Fig. 2 Optimal Beams distribution map in Iran
3.1 Transportation of Wood After Optimization with Maximum Loading Capacity
Table 3 shows the results of road transport optimization of various types of raw wood after optimization if the maximum loading capacity is used. The third column shows the number of times in the conditions of using the simplex model and the percentage of its reduction compared to the real conditions. Under these conditions, the total number of loads decreases by 29.04%. The fourth column shows the distance traveled by the truck in the conditions of using the simplex model and the percentage of reduction of the distance compared to the real conditions, which is reduced by 43.42% in total. The fifth column shows the cost of transportation using the simplex model and the percentage of cost reduction compared to the actual situation. In this case, the total cost is 21.53% less than the real situation.
Table 3 Results of road transport optimization of raw wood after optimization – maximum loading capacity
|
Wood type |
Tonnage, ton |
Number of loads (percentage of reduction) |
Distance travelled, km (percentage of reduction) |
Cost, 000s Euro (percentage of reduction) |
|
Logs |
1,055,006 |
54,684 (33.28%) |
30,625,008 (41.01%) |
15,693.63 (8.76%) |
|
Lumber types |
863,006 |
36,478 (16.80%) |
24,758,076 (35.93%) |
14,190.67 (31.66%) |
|
Industrial wooden sheets |
581,273 |
27,232 (24.47%) |
9,794,202 (50.90%) |
6184.14 (31.44%) |
|
Cants |
175,900 |
8236 (12.90%) |
5,307,510 (21.18%) |
3027.99 (5.46%) |
|
Wood fuels |
60,870 |
3009 (51.04%) |
2,216,449 (62.35%) |
1080.20 (19.98%) |
|
Charcoals |
52,508 |
3446 (61.72%) |
1,575,612 (79.16%) |
815.74 (38.58%) |
|
Beams |
42,884 |
1860 (49.72%) |
1,076,568 (56.65%) |
599.74 (10.69%) |
|
Total |
2,831,447 |
134,945 (29.04%) |
75,353,425 (43.42%) |
41,592.10 (22.31%) |
Optimized accumulated distance traveled using the simplex model for different types of wood are shown in Fig. 3.
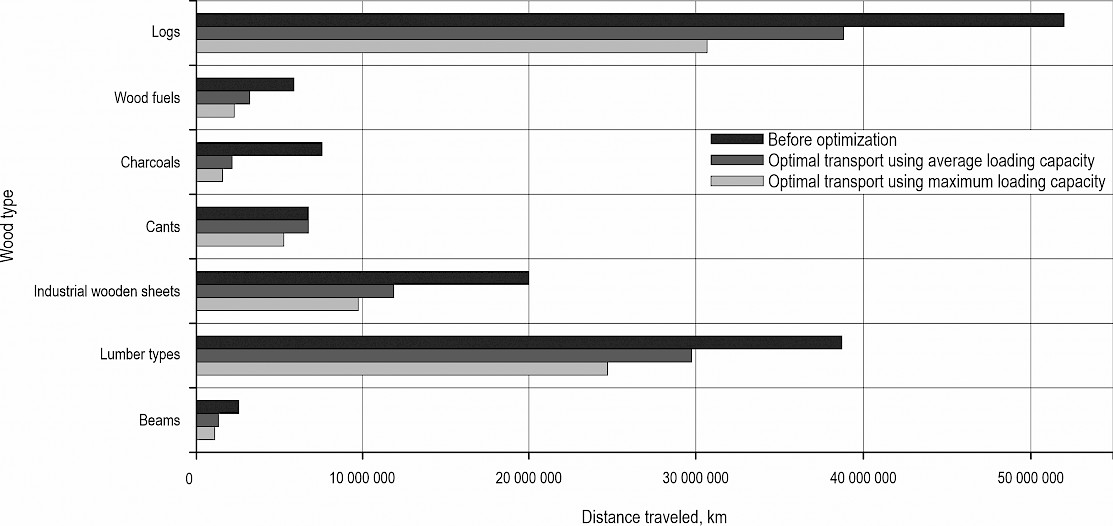
Fig. 3 Comparison of distance traveled before and after optimization
3.2 Transportation of Wood After Optimization with Average Loading Capacity
Table 4 shows the results of road transportation optimization of raw wood after optimization if the average loading capacity is used. The third column shows the number of times in the conditions of using the simplex model and the percentage of its reduction compared to the real conditions. Under these conditions, the total number of loads decreases by 10.12%. The fourth column shows the distance traveled by the truck in the conditions of using the simplex model and the percentage of reduction of the distance compared to the real conditions, which is reduced by 29.54%. The fifth column shows the cost of transportation using the simplex model and the percentage of cost reduction compared to the actual situation. In this case, the total cost is 21.53% less than the real situation.
Table 4 Results of road transport optimization of raw wood after optimization - average loading capacity
|
Wood type |
Tonnage, ton |
Number of loads (percentage of reduction) |
Distance travelled, km (percentage of reduction) |
Cost, 000s Euro (percentage of reduction) |
|
Logs |
1,055,006 |
71,067 (13.29%) |
38,858,683 (25.15%) |
15,852.15 (7.84%) |
|
Lumber types |
863,006 |
44,359 (–1.18%) |
29,746,898 (23.02%) |
14,334.01 (30.97%) |
|
Industrial wooden sheets |
581,273 |
33,690 (6.56%) |
11,934,927 (43%) |
6246.60 (30.75%) |
|
Cants |
175,900 |
10,293 (–8.85%) |
6,664,395 (1.03%) |
3058.57 (4.50%) |
|
Wood fuels |
60,870 |
4418 (28.12%) |
3,157,369 (46.37%) |
1091.11 (19.17%) |
|
Charcoals |
52,508 |
4763 (47.10%) |
2,128,032 (71.86%) |
823.98 (37.96%) |
|
Beams |
42,884 |
2327 (37.09%) |
1,349,349 (45.67%) |
605.80 (9.78%) |
|
Total |
2,831,447 |
170,917 (10.12%) |
93,839,653 (29.54%) |
42,012.22 (21.53%) |
3.3 Loading Displacement Tonnage Before and After Optimization
Loading displacement tonnage before and after optimization is shown in Table 5.
Table 5 Loading displacement tonnage before and after optimization
|
Wood type |
Beam, ton |
Lumber type, ton |
Industrial wooden sheets, ton |
Cants, ton |
Charcoal, ton |
Wood fuel, ton |
Log, ton |
|||||||
|
Loading type |
Before |
After |
Before |
After |
Before |
After |
Before |
After |
Before |
After |
Before |
After |
Before |
After |
|
K1 |
4 |
0 |
2 |
0 |
2 |
1 |
22 |
21 |
1 |
0 |
1 |
1 |
0 |
0 |
|
K2 |
8 |
4 |
3150 |
3157 |
10,200 |
10,200 |
8270 |
8301 |
3560 |
3576 |
405 |
403 |
12,000 |
11,001 |
|
K3 |
878 |
884 |
1610 |
1625 |
1271 |
1275 |
19 |
17 |
7040 |
7249 |
990 |
989 |
7000 |
6947 |
|
K4 |
21,650 |
21,637 |
27,637 |
27,623 |
76,800 |
76,801 |
7000 |
7011 |
8507 |
8529 |
5824 |
5822 |
321,026 |
322,064 |
|
K5 |
20,360 |
20,359 |
96,729 |
96,723 |
35,500 |
35,494 |
7090 |
7019 |
21,000 |
24,319 |
53,212 |
53,216 |
315,000 |
315,007 |
|
K6 |
42,867 |
42,884 |
735,310 |
735,311 |
457,500 |
457,503 |
153,500 |
153,533 |
12,400 |
8835 |
450 |
451 |
400,000 |
400,007 |
The pre- and post-optimization costs using the simplex model for all transport methods are described in Table 6. The second column shows the table of transportation costs in real conditions, the third and fourth columns show transportation costs using the average loading capacity in terms of using the simplex model and the percentage of reduction of transportation costs compared to real conditions, which shows that it generally decreases by 21.53%. Columns 5 and 6 show the transport costs using the maximum load capacity in terms of using the simplex model and the percentage of reduction of transport costs compared to the actual conditions, which is reduced by 22.31%.
Table 6 Comparison of transportation costs before and after optimization
|
Wood type |
Transportation cost before Optimization, 000s Euros |
Optimal transport using average loading capacity |
Optimal transport using maximum loading capacity |
||
|
Cost, 000s Euros |
Percentage of reduction |
Cost, 000s Euros |
Percentage of reduction |
||
|
Lumber types |
20,765.31 |
14,334.01 |
30.97% |
14,190.67 |
31.66% |
|
Logs |
17,201.31 |
15,852.15 |
7.84% |
15,693.63 |
8.76% |
|
Industrial wooden sheets |
9020.38 |
6246.60 |
30.75% |
6184.14 |
31.44% |
|
Cants |
3202.73 |
3058.57 |
4.50% |
3027.99 |
5.46% |
|
Wood fuels |
1349.93 |
1091.11 |
19.17% |
1080.2 |
19.98% |
|
Charcoals |
1328.11 |
823.98 |
37.96% |
815.74 |
38.58% |
|
Beams |
671.50 |
605.80 |
9.78% |
599.74 |
10.69% |
|
Total |
53,539.28 |
42,012.22 |
21.53% |
41,592.1 |
22.31% |
4. Discussion
Optimization can be done based on human experience, but this approach often leads to costly cases and low performance errors. On the other hand, optimization can be done using modern mathematical tools that can achieve very successful results depending on the computational power of the model used (Kons et al. 2020). In our opinion the optimization results of this research show that, by using the simplex optimization model presented in this research, an average reduction of 21.53% to 22.3% in the total cost can be achieved. This reduction in total cost can be attributed to decisions related to the optimal distribution of wood, elimination of intermediate points and direct delivery of timber from suppliers to customers, determination of transportation routes and proper selection of truck type supplier based on cargo tonnage, as shown in the study of Gagliardi et al. (2020) on forwarder load capacity. Improper distribution of wood in real conditions has increased both the length of the transportation route and transportation costs. Also, in real conditions, due to improper selection of the truck, its minimum capacity is not met, while the minimum tonnage required for the truck is paid, which will increase the overall transportation cost. GAMS software output showed that, in the selection of truck, in addition to cargo tonnage, the transport distance factor can also contribute to the management of transportation costs, so that the selection of large trucks for long distances and small trucks for shorter distances is effective in reducing transportation costs (Malladi et al. 2018). They also suggest that using larger trucks for longer transportation and smaller trucks for shorter distances can save costs, and that direct biomass delivery from suppliers to customers can save costs. In the research model, in the conditions of using the maximum allowable capacity of the truck, there is a 29.04% reduction in the number of trips and a 43.42% reduction along the transportation route; therefore, it is in line with our goals, which is to provide an optimal pattern of distribution and transportation. However, in the conditions of using the average capacity of the truck, there is a 10.12% decrease in the number of trips and a 29.54% decrease along the transportation route compared to the real conditions. Kogler and Rauch examined the permits granted to increase the tonnage of truck transport as a potential means of reducing the number of trips of timber trucks, with coordinated working time. The results showed a 6% reduction in the number of truck trips if the tonnage changed from the low to the middle, and if the tonnage changed from the bottom up, the number of truck trips could be reduced by up to 10% (Kogler and Rauch 2020). Due to the fact that, in the mathematical formula of the research simplex model, the two parameters of distance and cargo weight are completely and directly related to the amount of freight, truck freight rates are slightly different in these two research models, but ultimately the total shipping costs Transportation is less in terms of using the maximum capacity of the truck. The maximum allowable capacity of the truck is for the driver because most truck drivers are looking for heavier loads over longer distances to make more profit. Under these conditions, transportation efficiency has increased, which has a positive effect in terms of cost, CO2 emissions, carbon footprint, manpower needs and road traffic (Eriksson et al. 2014, Mederski et al. 2021, Ranta and Rinne 2006). Conversely, the conventional transportation system is in the interest of transportation companies due to their higher productivity (Han et al. 2018). It is noteworthy that, due to the fact that a minimum loading capacity has been specified for each type of truck, in case of loading with less tonnage, the full cost of the minimum load (base price) will be paid and this will cause loss to the customer. Insurance, maintenance, fuel, tire, driver salaries and benefits are some of the factors that, in addition to affecting the cost per ton-kilometer, have led to a minimum load. However, in addition to the two main parameters of distance and weight of cargo, there are other items that, although not visible, contribute to the final profit, such as fuel consumption, oil consumption, tires, insurance, driver salaries, repairs, maintenance, car depreciation and price reduction due to the increased life of the truck. If the timber transportation system is properly analyzed, optimization can reduce supply costs and help supply these raw materials at a more competitive price (Laitila et al. 2016).
5. Conclusions
This research focused on the optimal distribution of wood on a very large scale. Optimizing road transport routes and determining the most appropriate type of truck on these routes as the output of GAMZ software, reduces transportation costs. Reducing transportation costs will in turn dwindle the cost of wood and wood products. To achieve this goal, linear programming – transportation simplex model was studied and this model was applied in Iran for a period of one year. The results showed a significant reduction in the cost of distribution of wood in the country's transportation network. During the use of this model, it was found that, in addition to the optimal distribution and determination of appropriate wood transportation routes, the optimal use of the capacity of each type of truck, according to the tonnage of wood demand can also be effective in reducing transportation costs. In addition, this optimization can reduce the negative environmental effects by reducing fuel use in addition to achieving economic goals. A variety of models and algorithms are presented annually around the world to optimize distribution and transportation in the forest industry. Many of these models, despite their success, remain at the research level due to the complexity and inflexibility of the initial requirements so they are not used by companies. The advantages of this model are simplicity, flexibility of the model to change the time period and simultaneous use of other transportation methods such as rail and water, as well as the application of this model in small to very large spatial levels.
To use this model in other areas of supplier and customer distribution points, shipping capacity and demand of each customer, types, number and capacity of trucks available in each source in the desired time period and connection distance between all supply and demand centers are required.
Acknowledgment
The authors thank the Ministry of Roads & Urban Development, Iran Road Maintenance & Transportation Organization, Office of Information Technology who helped us do this research. This research did not receive any specific grant from funding agencies in the public, commercial, or not-for-profit sectors.
6. References
Acuna, M., 2017: Timber and Biomass Transport Optimization: A Review of Planning Issues, Solution Techniques and Decision Support Tools. Croatian Journal of Forest Engineering 38(2): 279–290.
Anon., 2017: Ministry of roads and urban development, Deputy minister of transportation, Review of policies, priorities and programs of the ministry of roads and urban development in the field of logistics, The third specialized logistics working group. 34 p.
Anon., 2016, Ministry of roads and urban development, Deputy minister of transportation, Report sheets.
Asikainen, A., 2001: Simulation of logging and barge transport of wood from forests on islands. International Journal of Forest Engineering 12(2): 43–50. https://doi.org/10.1080/14942119.2001.10702445
Aydinel, M., Sowlati, T., Cerda, X., Cope, E., Gerschman, M., 2008: Optimization of production allocation and transportation of customer orders for a leading forest products company. Mathematical and Computer Modelling 48(7–8): 1158–1169. https://doi.org/10.1016/j.mcm.2007.12.025
Balaman, S.Y., Matopoulos, A., Wright, D.G., Scott, J., 2018: Integrated optimization of sustainable supply chains and transportation networks for multi technology bio-supplier based production: A decision support system supplier based on fuzzy ε-constraint method. Journal of Cleaner Production 172: 2594–2617. https://doi.org/10.1016/j.jclepro.2017.11.150
Beaudoin, D., LeBel, L., Soussi, M.A., 2013: Discrete event simulation to improve log yard operations. CIRRELT Working Paper. Quebec, Canada, Available from: https://www.cirrelt.ca/Doc
Boukherroub, T., LeBel, L., Lemieux, S., 2017: An integrated wood pellet supply chain development: Selecting among feedstock sources and a range of operating scales. Applied energy 198: 385–400. https://doi.org/10.1016/j.apenergy.2016.12.013
Cai, R., Ren, A., Soundarajan, S., Wang, Y., 2018: A low-computation-complexity, energy-efficient, and high-performance linear program solver supplier based on primal dual interior point method using memristor crossbars. Nano Communication Networks 18: 62–71. https://doi.org/10.1109/SOCC.2016.7905500
Chung, W., Contreras, M., 2011: Forest transportation planning under multiple goals using ant colony optimization. Ant Colony Optimization Methods And Applications 221–236. https://doi.org/10.5772/13805
De Jong, S., Hoefnagels, R., Wetterlund, E., Pettersson, K., Faaij, A., Junginger, M., 2017: Cost optimization of biofuel production–The impact of scale, integration, transport and supply chain configurations. Applied energy 195: 1055–1070. https://doi.org/10.1016/j.apenergy.2017.03.109
Devlin, G., Talbot, B., 2014: Deriving cooperative biomass resource transport supply strategies in meeting co-firing energy regulations: A case for peat and wood fibre in Ireland. Applied Energy 113: 1700–1709. https://doi.org/10.1016/j.apenergy.2013.09.019
Eriksson, A., Eliasson, L., Jirjis, R., 2014: Simulation-supplier based evaluation of supply chains for stump fuel. International Journal of Forest Engineering 25(1): 23–36. http://dx.doi.org/10.1080/14942119.2014.892293
Flisberg, P., Frisk, M., Rönnqvist, M., Guajardo, M., 2015: Potential savings and cost allocations for forest fuel transportation in Sweden: A country-wide study. Energy 85: 353–365. https://doi.org/10.1016/j.energy.2015.03.105
Forsberg, M., Frisk, M., Rönnqvisty, M., 2005: FlowOpt–a decision support tool for strategic and tactical transportation planning in forestry. International Journal of Forest Engineering 16(2): 101–114. https://doi.org/10.1080/14942119.2005.10702519
Frisk, M., Göthe-Lundgren, M., Jörnsten, K., Rönnqvist, M., 2010: Cost allocation in collaborative forest transportation. European Journal of Operational Research 205(2): 448–458. https://doi.org/10.1016/j.ejor.2010.01.015
Gagliardi, K., Ackerman, S., Ackerman, P., 2020: Multi-Product Forwarder-Based Timber Extraction: Time Consumption and Productivity Analysis of Two Forwarder Models Over Multiple Products and Extraction Distances. Croatian Journal of Forest Engineering 41(2): 231–242. https://doi.org/https://doi.org/10.5552/crojfe.2020.736
Han, H., Chung, W., Wells, L., Anderson, N., 2018: Optimizing Biomass Feedstock Logistics for Forest Residue Processing and Transportation on a Tree-Shaped Road Network. Forests 9(3): 1–19. http://dx.doi.org/10.3390/f9030121
Han, S.K., Murphy, G.E., 2012: Solving a woody biomass truck scheduling problem for a transport company in Western Oregon, USA. Biomass and bioenergy 44: 47–55. https://doi.org/10.1016/j.biombioe.2012.04.015
Holo Ba, B., Prins, C., Prodhon, C., 2016: Models for optimization and performance evaluation of biomass supply chains: An Operations Research perspective. Renewable Energy 87: 977–989. https://doi.org/10.1016/j.renene.2015.07.045
Kogler, C., Rauch, P., 2020: Contingency Plans for the Wood Supply Chain Supplier based on Bottleneck and Queuing Time Analyses of a Discrete Event Simulation. Forests 11(4): 1–23. https://doi.org/10.3390/f11040396
Kons, K., La Hera, P., Bergström, D., 2020: Comparison of Alternative Pulpwood Inventory Strategies and Machine Systems at a Log-Yard Using Simulations. Forests 11(4): 1–18. https://doi.org/10.3390/f11040373
Laitila, J., Asikainen, A., Ranta, T., 2016: Cost analysis of transporting forest chips and forest industry by-products with large truck-trailers in Finland. Biomass and Bioenergy 90: 252–261. https://doi.org/10.1016/j.biombioe.2016.04.011
Lin, P., Contreras, M.A., Dai, R., Zhang, J.A., 2016: A multilevel ACO approach for solving forest transportation planning problems with environmental constraints. Swarm and Evolutionary Computation 28: 78–87. https://doi.org/10.1016/j.swevo.2016.01.003
Lin, P., Zhang, J., Contreras, M.A., 2014: Applying pareto ant colony optimization to solve bi-objective forest transportation planning problems. In: Proceedings of the 2014 IEEE 15th International Conference on Information Reuse and Integration, 795–802. https://doi.org/10.1109/IRI.2014.7051970
Lotfalian, M., 2011: Wood Transportation, Aiizh Press. Tehran, Iran, 460 p.
Malladi, K.T., Quirion-Blais, O., Sowlati, T., 2018: Development of a decision support tool for optimizing the short-term logistics of forest-supplier based biomass. Applied Energy 216: 662–677. https://doi.org/10.1016/j.apenergy.2018.02.027
Marques, A.F., de Sousa, J.P., Rönnqvist, M., Jafe, R., 2014: Combining optimization and simulation tools for short-term planning of forest operations. Scandinavian Journal of Forest Research 29(sup1): 166–177. https://doi.org/10.1080/02827581.2013.856937
Mederski, P.S., Borz, S.A., Đuka, A., Lazdiņš, A., 2021: Challenges in Forestry and Forest Engineering – Case Studies from Four Countries in East Europe. Croatian Journal of Forest Engineering 42(1): 117–134. https://doi.org/10.5552/crojfe.2021.838
Moad, K., François, J., Bourrières, J.P., Lebel, L., Vuillermoz, M., 2016: A bi-level decision model for timber transport planning. 6th International Conference on Information Systems, Logistics and Supply Chain ILS Conference. June 1–4, Bordeaux, France.
Nasiri, M., Lotfalian, M., 2012: Programming and forest road planning. Journal of Ecology and Environmental Sciences 3(2): 68–73.
Parsakhoo, A., Mostafa, M., Shataee, S., Lotfalian, M., 2017: Decision support system to find a skid trail network for extracting marked trees. Journal of Forest Science 63(2): 62–69. https://doi.org/10.17221/36/2016-JFS
Pedregal, P., 2004: Introduction to Optimization. Springer, New York Inc.
Ranta, T., Rinne, S., 2006: The profitability of transporting uncomminuted raw materials in Finland. Biomass Bioenergy 30(3): 231–237. https://doi.org/10.1016/j.biombioe.2005.11.012
Rey, P.A., Muñoz, J.A., Weintraub, A.A., 2009: A column generation model for truck routing in the Chilean forest industry. Information Systems and Operational Research 47(39: 215–221. https://doi.org/10.3138/infor.47.3.215
Rix, G., Rousseau, L.M., Pesant, G., 2011: Solving a multi-period log-truck scheduling problem with column generation. 34th Council on Forest Engineering Annual Meeting. Quebec, QC, Canada.
Rix, G., Rousseau, L.M., Pesant, G.A., 2015: A column generation algorithm for tactical timber transportation planning. Journal of the Operational Research Society 66(2): 278–287. https://www.jstor.org/stable/24505292
Rönnqvist, M., 2003: Optimization in forestry. Mathematical programming 97(1–2): 267–284. https://doi.org/10.1007/s10107-003-0444-0
Shabani, N., Sowlati, T., 2013: A mixed integer non-linear programming model for tactical value chain optimization of a wood biomass power plant. Applied Energy 104: 353–361. https://doi.org/10.1016/j.apenergy.2012.11.013
Te Brömmelstroet, M., Nicolaisen, M.S., Büttner, B., Ferreira, A., 2017: Experiences with transportation models: An international survey of planning practices. Transport Policy 58: 10–18. https://doi.org/10.1016/j.tranpol.2017.04.007
Van Dyken, S., Bakken, B.H., Skjelbred, I., 2010: Linear mixed-integer models for biomass supply chains with transport, storage and processing. Energy 35(3): 1338–1350. http://dx.doi.org/10.1016/j.energy.2009.11.017
Yue, D., You, F., Snyder, S.W., 2014: Biomass-to-bioenergy and biofuel supply chain optimization: overview, key issues and challenges. Computers & Chemical Engineering 66: 36–56. http://dx.doi.org/10.1016/j.compchemeng.2013.11.016
Zamora-Cristales, R., Sessions, J., Boston, K., Murphy, G., 2015: Economic optimization of forest biomass processing and transport in the Pacific Northwest USA. Forest Science 61(2): 220–234. http://dx.doi.org/10.5849/forsci.13-158
© 2022 by the authors. Submitted for possible open access publication under the
terms and conditions of the Creative Commons Attribution (CC BY) license (http://creativecommons.org/licenses/by/4.0/).
Authors’ addresses:
Prof. Majid Lotfalian, PhD *
e-mail: mlotfalian sanru.ac.ir
Saba Peyrov, PhD
e-mail: s.peyrov@stu.sanru.ac.ir
Sari University of Agricultural Sciences and Natural Resources
Department of Forestry
Faculty of Natural Resources
737 PO Box, Badeleh, Sari
IRAN
Assist. Prof. Kamran Adeli, PhD
e-mail: adeli.k@lu.ac.ir
Lorestan University
College of Natural Resources
Department of Forestry
PC: 6815144316, Khoramabad, Lorestan
IRAN
Prof. Tibor Pentek, PhD
e-mail: tpentek@sumfak.unizg.hr
University of Zagreb
Faculty of Forestry and wood technology
Svetošimunska cesta 23
10000 Zagreb
CROATIA
* Corresponding author
Received: August 09, 2021
Accepted: October 16, 2021
Original scientific paper