
Micro-Data Efficiency Evaluation of Forest Companies: The Case of Central Europe
doi: 10.5552/crojfe.2022.1541
volume: 43, issue:
pp: 17
- Author(s):
-
- Staňková Michaela
- Hampel David
- Janová Jitka
- Article category:
- Original scientific paper
- Keywords:
- forest management, forest policy, data envelopment analysis, micro-data, company size, malmquist index
Abstract
HTML
The forestry sector is facing critical challenges due to climate change. Decision-making support based on efficiency evaluation using non-parametric methods could provide important information for both forest managers and policymakers. However, such advanced technical analysis is scarce in forestry science. When applied, its application has been primarily based on aggregated, macro-level data, and efficiency was analysed for the forestry sector as a whole. There is a lack of studies from the company-level perspective, which are needed to provide sound decision support.
In this paper, we focus on the micro-data level and offer the data envelopment analysis model settings and interpretations for an efficiency evaluation based on the financial data of individual forestry companies. The aim is to provide an original analysis of the company-level driving forces of forestry sector efficiency. The results for central European countries show that efficiency is driven by company size and country of operation. The study also confirms that, generally, German companies are the »efficiency leaders« in the region, while Czech companies may serve as an efficiency reference for east-central European forestry companies.
Micro-Data Efficiency Evaluation of Forest Companies: The Case of Central Europe
Michaela Staňková, David Hampel, Jitka Janová
Abstract
The forestry sector is facing critical challenges due to climate change. Decision-making support based on efficiency evaluation using non-parametric methods could provide important information for both forest managers and policymakers. However, such advanced technical analysis is scarce in forestry science. When applied, its application has been primarily based on aggregated, macro-level data, and efficiency was analysed for the forestry sector as a whole. There is a lack of studies from the company-level perspective, which are needed to provide sound decision support.
In this paper, we focus on the micro-data level and offer the data envelopment analysis model settings and interpretations for an efficiency evaluation based on the financial data of individual forestry companies. The aim is to provide an original analysis of the company-level driving forces of forestry sector efficiency. The results for central European countries show that efficiency is driven by company size and country of operation. The study also confirms that, generally, German companies are the »efficiency leaders« in the region, while Czech companies may serve as an efficiency reference for east-central European forestry companies.
Keywords: forest management, forest policy, data envelopment analysis, micro-data, company size, malmquist index
1. Introduction
The forestry sector, which is facing severe changes due to climate change, is in need of robust decision support. Efficiency evaluation could play an important role here, as efficiency improvement is essential to increase the competitiveness of companies and may offer a sound basis for setting appropriate national forestry policies. Efficiency can be viewed from several perspectives. Estimations most often concern production (technical) efficiency, which represents a state when it is not possible to produce one more unit with the given resources without limiting the production of another product. Hollingsworth (2003) considers two methods to be dominant in the field of efficiency evaluation: the non-parametric data envelopment analysis (DEA) method and the parametric stochastic frontier analysis (SFA) method.
At present, many studies focusing on productivity assessment in the forestry sector can be found. For example, Hlásný et al. (2017) evaluated the climate effects on the productivity of three temperate tree species in the Czech Republic and Slovak Republic. Routa et al. (2020) focused on the productivity of mechanized tending when compared to manual tending and Bilici et al. (2019) focused on the productivity of logging damaged by a storm. The impact of bark beetles on tree mortality and the impact of the changing climate is also a current topic; see, for example, Matthews et al. (2018), Kolář et al. (2017) and Mezei et al. (2017).
There has been a notable increase in the use of Multiple Criteria Decision-Making techniques (including the DEA method) over the last few decades, see Diaz-Balteiro and Romero (2008). However, there are limited studies evaluating the efficiency of the transformation process in the forestry sector. Li et al. (2017) evaluated China's forestry resource efficiency using the DEA method. They used the radial CCR and BCC models to calculate the efficiency score. The change in efficiency during the period from 2005 to 2013 was then expressed using the Malmquist Index. The Malmquist Index was also used by Yang et al. (2016) to evaluate the development of efficiency in Chinese forestry. Chen et al. (2017) focused on the analysis of productive efficiency in China's forestry industry via the parametric SFA method. Chen et al. (2017) preferred the SFA method over the DEA method mainly due to its ability to distinguish noise from inefficiency. To evaluate the development of efficiency from 1998 to 2014, they used a panel analysis based on the Battese and Coelli model (1995).
In their article, Gutiérrez and Lozano (2020) provide a list of studies that deal with the efficiency of the forestry sector. They state that as of 2017, there were only 9 non-Chinese studies that applied DEA models in the forestry sector. For example, in Europe, the studies by Šporčić and Landekić (2014) and Viitala and Hänninen (1998) may be mentioned. In central Europe, more advanced approaches, such as DEA or SFA, have been used in isolated case studies in a country context (Młynarski and Kaliszewski 2018, Kovalčík 2018, 2020). Recently, DEA has been used as a tool for efficiency evaluation in forestry in the above-mentioned study of Gutiérrez and Lozano (2020), in which the relative efficiency of the forestry sector of EU countries was assessed via DEA. Here, a discussion on input and output selection was provided together with the identification of reference countries that may serve as benchmarks for other countries due to their high efficiency.
However, the aforementioned studies were based primarily on aggregated macro-data and dealt with the efficiency of the whole national forestry sector. Currently, there is a lack of comprehensive studies dealing directly with the efficiencies derived from the financial data of individual companies, particularly in central Europe. In this paper, we focus on the micro-level and provide an efficiency analysis for forest management based on individual forestry company financial data. The aims of the paper are to:
Þ suggest appropriate DEA model settings for the micro-data-based efficiency evaluation of forest companies
Þ provide original analysis of the company-level-based drivers of forest sector efficiency for central European countries
Þ analyse companies’ efficiency with respect to company size
Þ test the hypothesis that Germany is the »efficiency leader« in the region from the micro-level perspective and evaluate whether the Czech Republic may serve as a reference for east-central European countries (as suggested in Gutiérrez and Lozano (2020)) using macro-data.
2. Materials and Methods
There are two approaches for efficiency evaluation (parametric and non-parametric), and each of them has strengths and weaknesses. To achieve robust results, both approaches will be used (as in Staňková 2020, Silva et al. 2016 and Oh and Shin 2015). Any link between the selected methods will be evaluated using the Spearman correlation coefficient. Both approaches are described in the following sections. The aim is to provide comparisons between the competing approaches and to discuss and select the more appropriate method for forestry companies’ efficiency analysis. As will be seen, in our case, the final choice was to focus on the DEA CCR model.
2.1 Stochastic Frontier Analysis (SFA)
The Cobb-Douglas function form is chosen within the SFA models. According to Li et al. (2016), this functional form is widely used due to its flexibility and abil x ity to model variable returns to scale. To estimate the linearized version of the Cobb-Douglas functional form, the problem of the negativity of some variables had to be solved. As in Staňková and Hampel (2019), the values are increased by a positive constant for this purpose.
With the SFA method, it was found impossible to make estimates individually for each year using the selected data. Although the composed error term had the required positive skew, the estimated models could not be considered realistic because the difference between the maximum and minimum estimated efficiencies was approximately one percentage point. Some authors apply panel data models in these cases. However, since our dataset is not balanced, it is not possible to use Battese and Coelli’s (1995) or Greene’s (2005) models, so the pooled SFA model is used. Regarding the findings in Staňková and Hampel (2021), two approaches to estimating efficiency are used. The first approach focuses on computation through the inefficiency conditional mean, as in Battese and Coelli (1988). The second uses the procedure of Jondrow et al. (1982) and makes the calculation directly through the efficiency mean. The selected SFA model is estimated assuming a half-normal distribution of inefficiency. Technical details on SFA estimation can be found in Kumbhakar et al. (2015).
2.2 Data Envelopment Analysis (DEA)
Unlike SFA models, DEA models are based on original data, and models are constructed individually for a particular year. Similar to Li et al. (2017), we will use the radial CCR and BCC models to calculate efficiency. The efficiency score EH of company H in the CCR model is defined as the weighted sum of outputs divided by the weighted sum of inputs:
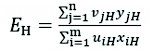 (1)
(1)
Where:
Þ the values of inputs xikare arranged in a matrix X = {xik, i=1, 2, …, m, j=1, 2, …, p}
Þ the values of the outputs vjk are then arranged in a matrix Y = {yik, i=1, 2, …, n, j=1, 2, …, p}.
The DEA model maximizes the efficiency score under the assumption that efficiency scores for all other companies are lower than or equal to the maximum value of one:
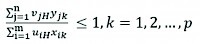 (2)
(2)
while the values of the weights of the inputs and outputs must be positive:
The DEA model set up in this way is not linear in the objective function but can be converted to a linear model with common Charnes-Cooper modifications; see Cooper et al. (2007). The CCR model works on the basis of constant returns to scale, but the BCC model allows variable returns to scale. In such a case, it is necessary to enrich the CCR model (in the objective function and constraint conditions) with the variable µH, which represents the magnitude of the deviation from constant returns to scale.
Within both selected DEA models, it is then necessary to make a decision regarding the orientation of the model. Both models are constructed assuming an output orientation, as in Gutiérrez and Lozano (2020). This orientation seems to be more relevant given the combination of input and output variables. For example, in the current situation, companies and governments are well aware that they cannot mindlessly convert agricultural land into construction. Therefore, the selected DEA models will motivate inefficient companies to address the output side (increase turnover) and not to reduce all inputs.
2.3 Further Analysis Through DEA Models
The CCR and BCC models are so-called radial in nature. Inefficient companies are therefore looking for an efficient solution in the proportional adjustment of inputs/outputs. In practice, however, we encounter cases where it is more appropriate to reduce one input or increase one output in a larger amount to achieve efficiency. These disproportionate changes in the variables used can be defined in DEA models using so-called slacks. If slack occurs on the output side, it is a deficiency in the output that the company should increase in that amount. If a slack is identified on the input side, it is a surplus in the given quantity, and the company should reduce the input. The slack values are therefore individual for each company and time period.
In the case of DEA models, it is typical that more fully efficient (i.e. 100% efficient) companies will appear. To be able to classify even within this group of companies, DEA models are calculated in the variant of super-efficiency models. In this case, companies can obtain an efficiency score higher than 1 (i.e., 100%) and can be referred to as super-efficient. A detailed description of these DEA models can be found in Cooper et al. (2007).
As DEA models are estimated in the variant of constant and variable returns to scale, it is possible to analyse scale efficiency. Scale efficiency can be expressed as the ratio of company efficiency within the model assuming constant returns to scale and variable returns to scale (in other words, the ratio between CCR efficiency and BCC efficiency). If a company has a scale efficiency value of one (in other words 100% scale efficiency), it cannot become more productive by changing its scale of operation. In other cases, a monitored company still has the opportunity to change the level of its operations and move to a technically optimal productive scale area.
To consider the change in efficiency over time within the DEA method, the Malmquist Index (MI) is also calculated. This index can be divided into two components: a change in technical efficiency (the so-called catch-up effect) and a change in the production possibility frontier (frontier shift). Values greater than 1 indicate an improvement in the specific area (efficiency, frontier or whole MI); values less than 1 indicate a deterioration.
Due to the problems identified with data availability, the MI was not calculated in the variant of the so-called circular MI but is calculated only as the total change in 2016 when compared to 2009. The MI can be constructed on the basis of financial data for only 717 companies, and it therefore offers only a very rough picture of the change over the period. Specifically, there are 167 Czech companies, 334 Hungarian companies, 214 Slovak companies and only 2 German companies. The MI is calculated with the same settings as the DEA models used to evaluate the efficiency described above (i.e., the output orientation in the variant of constant and variable returns to scale). The technical details of all these procedures can be found in Thanassoulis (2013).
The results of technical efficiency from both approaches will be examined according to the size of the company and according to country. When dividing companies into groups according to size and country, in some cases (typically for countries with a smaller representation, such as Germany), smaller groups will be created.
2.4 Data
The models are based on financial data (annual accounting values) available in the Orbis database. This database provides comprehensive company reports, financial indicators and ownership information; see Bureau van Dijk (2020). The Orbis database combines data from regulatory and other sources (with information from over 170 different providers, and hundreds of their own sources). The advantage of the Orbis database is the ability to work with primary data. Thanks to the Orbis database, it possible to obtain certain financial indicators (relating, for example, to the balance sheet) and other information such as the number of employees and parent and subsidiary companies.
Information on companies in the forestry sector (NACE Code A2 – Forestry and logging) is monitored in the period from 2009 to 2016. The evaluation of efficiency is focused on central European countries, in which the natural conditions are comparable and which mostly share similar historical forest management experiences. These are Austria, the Czech Republic, Germany, Hungary, Poland and the Slovak Republic.
However, for some countries, the accounting data for individual companies were missing. Czech and Slovak companies are known for having high availability of financial data. Companies from Hungary were also widely represented in the dataset. Unfortunately, Austrian and Polish companies did not provide much financial data. With regard to the availability of data, an unbalanced dataset is chosen for the efficiency estimation. However, 525 companies are present in all periods and are representative of the Czech Republic, Germany, Hungary and Slovak Republic. The resulting numbers of companies from individual countries are shown in Table 1. As companies from Austria and Poland are represented to a very small extent (in some periods, there is only one representative), see Table 1, the efficiency evaluation will be performed without them.
Table 1 The number of companies per country each year
|
Year/ country |
Austria |
Czech Republic |
Germany |
Hungary |
Poland |
Slovak Republic |
Total |
|
2009 |
1 |
324 |
23 |
610 |
55 |
303 |
1316 |
|
2010 |
5 |
353 |
30 |
398 |
11 |
314 |
1111 |
|
2011 |
5 |
353 |
48 |
471 |
10 |
330 |
1217 |
|
2012 |
8 |
351 |
74 |
902 |
15 |
335 |
1685 |
|
2013 |
9 |
352 |
105 |
801 |
14 |
342 |
1623 |
|
2014 |
8 |
340 |
85 |
817 |
13 |
431 |
1694 |
|
2015 |
8 |
345 |
73 |
833 |
16 |
507 |
1782 |
|
2016 |
6 |
270 |
69 |
793 |
1 |
567 |
1706 |
For the evaluation of efficiency, variables associated with the transformation process are typically used. In the case of analyses based on SFA models, the selection of variables is strictly linked to a given function – typically a production function. For example, in Staňková and Hampel (2019), data on the costs of employees, capital and value added are used to evaluate efficiency through the SFA method. Similar financial variables can be found in studies using the DEA method. For example, in Staňková and Hampel (2018), the efficiency assessment is based on data on capital, costs of employees, material costs, total assets, value added and turnover. However, within the forestry sector, there is a problem regarding the availability of some of these typically used financial variables. For the companies representing Austria, Germany and Poland, it is not possible to obtain data, for example, on costs of employees or added value.
With regard to the overall availability of data, three variables representing inputs are selected that represent the forestry business: number of employees, total assets, and capital. The total funds (total capital) of the company are conceived here in their material form (buildings, patents, material, inventory, cash, etc.), which is represented by the total assets of the company. However, thanks to the previous findings of Staňková and Hampel (2018), a separate variable of accounting capital (in the sense of shareholder capital) was added, which can better capture the company's financing strategy, and also has an impact on the company's efficiency. And although the value of capital (shareholder capital) is partially included in total assets (average correlation is around 0.65), the combination of these two variables makes it possible to distinguish conservatively based companies that prefer financing from their own resources over bank loans, etc., from companies with aggressive financing strategies.
To estimate efficiency through SFA models, the above-mentioned Cobb-Douglas production function is chosen based on these three factors. Turnover (operating revenue) is selected as the output variable. Although the DEA method, unlike the SFA, allows the use of more output variables, the use of other typical variables, such as profit/loss, would significantly limit the dataset, and therefore, the same variables (on both the input and output sides) will be used in both methods. Table 2 contains an overview of the chosen variables and the reference studies that have used the selected variables.
Table 2 Overview of variables used
|
Variable |
Type |
Unit |
Reference |
|
Total assets |
Input |
Thousands of EUR |
Hosseinzadeh et al. (2016), Wijesiri et al. (2015), Charoenrat and Harvie (2014), Lee et al. (2018) |
|
Capital |
Input |
Thousands of EUR |
Hu and Liu (2015), Manello et al. (2016), Madaleno et al. (2016), Chen et al. (2017), Huang et al. (2017) |
|
Number of employees |
Input |
Persons |
Wijesiri et al. (2015), Fei and Li (2018), Manello et al. (2016) Madaleno et al. (2016), Charoenrat and Harvie (2014), Lee et al. (2018) Huang et al. (2017) |
|
Turnover |
Output |
Thousands of EUR |
Fei and Li (2018), Gaebert and Staňková (2020), Staňková and Hampel (2018) |
Table 3 gives some summary statistics for the variables considered. On average, German companies are the largest in terms of total assets, turnover and number of employees. By contrast, Hungary has the lowest values (on average) for all variables. As the dataset also includes a few companies in financial distress or even liquidation, the minima of the capital, total assets and turnover have even fallen into negative book values. Negative values in financial statements are a common problem when working with micro-financial data; see, for example, Staňková and Hampel (2019). The maximum values of individual variables were measured at the largest companies in the each country.
Table 3 Summary statistics of variables used (2009–2016) by country. Total assets, capital and turnover slacks are in thousands of EUR, number of employees in persons
|
Variable |
Country |
Mean |
Min |
Max |
Standard deviation |
|
Capital |
CZ |
2065 |
–310 |
494,696 |
24,574 |
|
Number of employees |
39 |
3 |
3500 |
247 |
|
|
Total assets |
11,031 |
0 |
3,254,832 |
154,987 |
|
|
Turnover |
4083 |
–16 |
525,999 |
27,057 |
|
|
Capital |
DE |
670 |
0 |
59,613 |
4382 |
|
Number of employees |
54 |
1 |
1767 |
230 |
|
|
Total assets |
22,805 |
1 |
1,848,497 |
167,798 |
|
|
Turnover |
18,151 |
0 |
1,215,302 |
120,076 |
|
|
Capital |
HU |
151 |
0 |
11,500 |
904 |
|
Number of employees |
15 |
1 |
1091 |
78 |
|
|
Total assets |
641 |
–42 |
40,571 |
3245 |
|
|
Turnover |
584 |
–250 |
36,035 |
2871 |
|
|
Capital |
SK |
1021 |
–229 |
225,846 |
10,790 |
|
Number of employees |
19 |
1 |
7500 |
254 |
|
|
Total assets |
3089 |
–40 |
1,484,726 |
48,560 |
|
|
Turnover |
2399 |
–101 |
1,410,740 |
43,329 |
3. Results
3.1 Model Choice
According to the SFA method, the efficiency of companies in the selected sector is at a high level (see Fig. 1). In contrast, according to the DEA method, most companies are highly inefficient. Such large differences in absolute efficiency values are common (see, for example, Silva et al. 2016). SFA models tend to overestimate efficiency due to the previously described positive constant addition process. If, instead of considering the absolute values of efficiency, we focus on the rank of companies derived according to their efficiency, then both selected approaches provide similar information. Table 4 shows the values of the Spearman rank correlation coefficient, which demonstrates that there is a strong correlation between the SFA models (the results are given generally for the SFA method, as the results of the JLMS and BC estimates do not change in terms of correlation) and both DEA models.
According to the values of the correlation coefficients, there is a strong link between the BCC model and the SFA model, which can explain the assumptions of individual models. The parameters estimated in the SFA models indicate increasing returns to scale. However, the CCR model considers only constant returns to scale. The second representative of the DEA method, the BCC model, works with constant returns to scale but also increasing and decreasing returns to scale, which brings its results closer to the estimated SFA models.
The results of the CCR and BCC models are very similar in terms of the derived ranks. Given that the differences in correlation coefficients between the SFA and DEA models are not dramatically different, in the following section, attention will be given primarily to the CCR DEA model. The CCR model represents so-called overall efficiency. Overall efficiency can only be achieved if the company is not only efficient but also performs the optimal number of operations due to its size. However, even if the efficiency results according to the CCR model are primarily presented, the results of the BCC model will be reflected in the scale efficiency values.
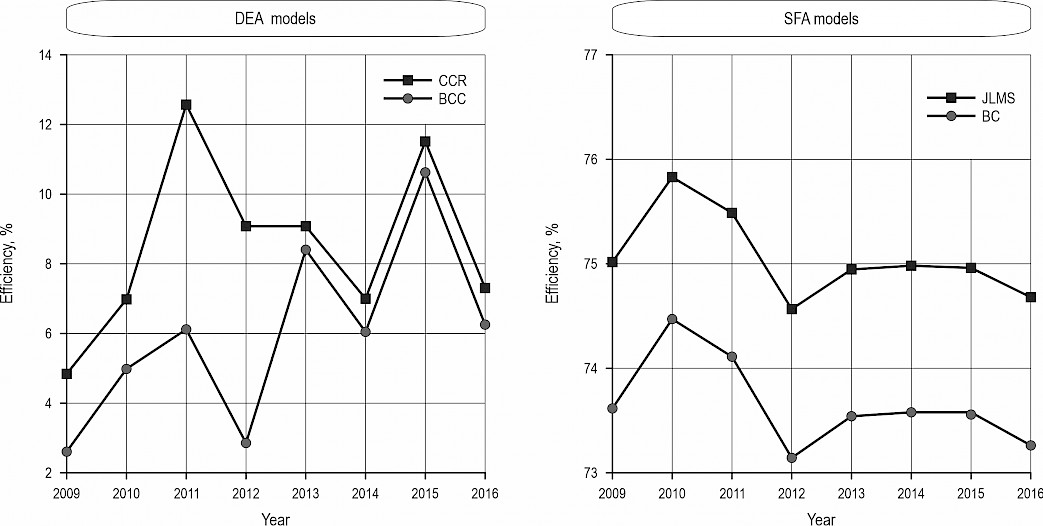
Fig. 1 The median efficiencies from 2009 to 2016 individually for CCR model (square) and BCC model (dot) in the upper figure and JLMS estimate (square) and BC estimate (dot) in the lower figure
Table 4 Spearman rank correlation coefficient between SFA and DEA models (individually for CCR and BCC models) from 2009 to 2016
|
Year |
SFA&CCR |
SFA&BCC |
Year |
SFA&CCR |
SFA&BCC |
|
2009 |
0.6836 |
0.7065 |
2013 |
0.6980 |
0.7263 |
|
2010 |
0.6999 |
0.7655 |
2014 |
0.7363 |
0.7392 |
|
2011 |
0.7430 |
0.7689 |
2015 |
0.8303 |
0.8650 |
|
2012 |
0.6267 |
0.6375 |
2016 |
0.6243 |
0.6702 |
3.2 Efficiency Assessment Results
Within the DEA models, it is possible to trace companies that perform the best in the sector (i.e. super-efficient units). The absolute frequencies of these top companies according to their efficiency, with regard to their geographical affiliation (country), are given in Table 5. Slovak companies in particular exceeded the efficiency limit (i.e., had efficiency greater than 1). We can name, for example, the Slovak company FORESTRA, S.R.O., which was among the super-efficient units every year. Germany took second place in the DEA models. Among the German companies, we can name especially DEROSSI INVEST GMBH, which also appeared among the top companies every year. Companies of various sizes were found among the super-efficient units. In general, limited liability companies dominated.
Table 5 The number of super-efficient units in individual countries for the entire monitored period
|
Country |
Number of super-efficient DMUs |
|
CZ |
4 |
|
DE |
12 |
|
HU |
4 |
|
SK |
25 |
A detailed analysis of super-efficient and efficient companies shows that the efficiency frontier (production frontier) is formed by a small but relatively stable group of companies (e.g., DEROSSI INVEST GMBH). Through their activities, these companies are able to shape and push the efficiency frontier to significantly advance beyond their competitors, which leads to such a low value for median efficiency.
Since the resulting efficiency values are not normally distributed, Fig. 2 plots the medians of efficiency for individual countries in individual years. As DEA models are estimated individually for each year, it is not appropriate to directly compare the trend in efficiency. However, Fig. 2 shows that German companies (square) are in the best position in terms of ranking. The results of the median efficiency for the Czech Republic (dot) and Slovak Republic (diamond) are very similar. Hungary (triangle) ranks last, lagging significantly behind Slovak Republic in terms of the median efficiency.
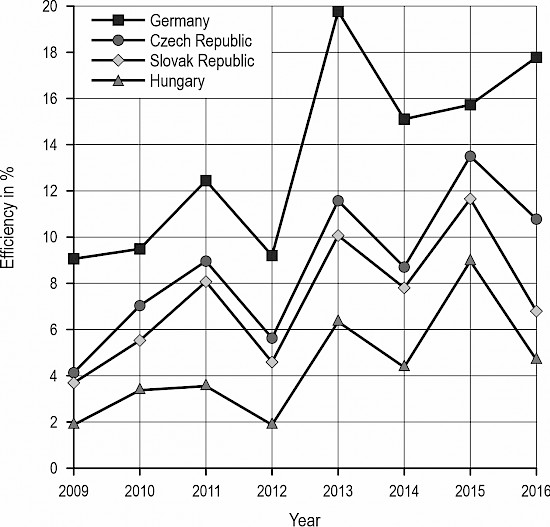
Fig. 2 Medians of CCR efficiency from 2009 to 2016 individually for the Czech Republic (dot), Germany (square), Hungary (triangle) and the Slovak Republic (diamond)
If we do not consider country of operation but examine efficiency in terms of company size, see Fig. 3, then medium-sized companies (triangle) take first place. In 2014, very large companies (square) achieved significantly higher median efficiency than other companies. However, the category of very large companies contained significantly fewer companies than other groups. The number of very large companies ranged from 4 to 10 companies each year. Two very large German companies (THUERINGENFORST – ANSTALT OEFFENTLICHEN RECHTS and DEROSSI INVEST GMBH) had very high efficiency values throughout the period under review, but the other companies had relatively low efficiency values. In 2014, the number of very large companies dropped to just four, two of which were the above-mentioned German companies. This caused a dramatic increase in median efficiency. Due to a lack of data, Fig. 3 does not include the median efficiency for very large companies in 2014. In general, the medians of very large, medium and small companies are very close.
Generally, it can be assumed that very large companies benefit greatly from economies of scale. Small companies in the forestry sector (often contracted by large companies), on the other hand, focus on individual and specific tasks. Medium-sized (and large) companies operate between these two situations, which allows them to operate at the level of constant returns to scale, such that they achieve the highest median efficiency within the CCR model.
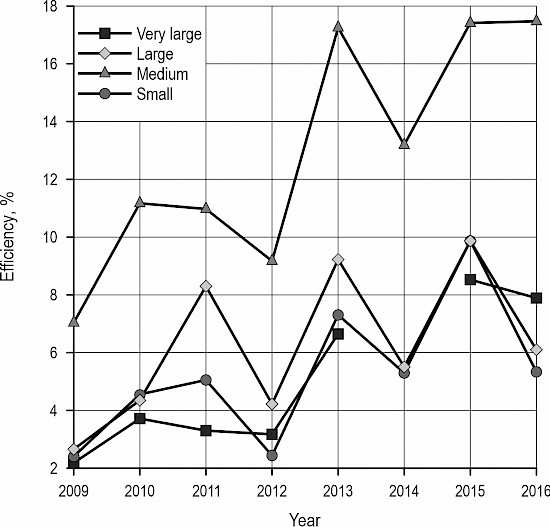
Fig. 3 Medians of CCR efficiency from 2009 to 2016 individually for very large (square), large (diamond), medium (triangle) and small (dot) companies
With regard to the previous findings, Fig. 4 records the results of companies efficiency primarily according to the size of the company and then according to the country. The name of the country is entered in the picture only as an abbreviation, i.e., CZ for the Czech Republic, DE for Germany, HU for Hungary and SK for the Slovak Republic. Within each country, the results of all eight reference periods are recorded. The efficiency of individual companies are drawn by dots, and the medians in a given category are drawn by square. As in some cases companies achieved the same efficiency score, the individual points may overlap. In some categories, for example, for very large Slovak companies, there are only a few representatives with similar efficiency results; therefore, the plotted median overlaps the calculated efficiencies. For the sake of greater clarity and uniformity, Fig. 4 shows the results of super-efficient units replaced by only 100% efficiency.
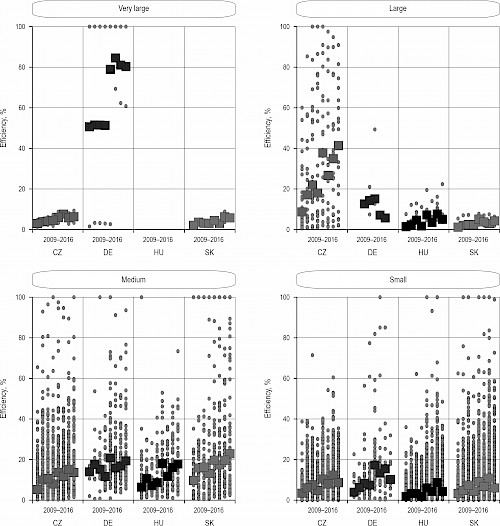
Fig. 4 Companies’ efficiency results (dot) from 2009 to 2016, categorized by company size and country, including median values (square)
Fig. 4 shows that Hungary had no very large companies represented throughout the period under review. Furthermore, the figure shows that fully efficient companies appear in Germany within this category every year. In the category of large companies, Czech companies generally have high efficiency (and median efficiency). It is also possible to observe that there are many more companies from the Czech Republic than from other countries in this category. In the category of medium-sized companies, the median values for individual countries in specific years are not very different. In the last of the monitored categories, i.e., small companies, Slovak companies in particular achieve full efficiency. However, in terms of median values, German companies are the best.
3.3 Scale Efficiency Assessment Results
In addition to production (technical) efficiency, efficiency related to the size of operations can be monitored. The results of scale efficiency are presented in Fig. 5 primarily by company size and subsequently by country. Fig. 5 is thus assembled in the same structure as Fig. 4 with the difference that instead of indicating efficiency, it shows the results of scale efficiency.
When analysing the scale efficiency only by company size, it is possible to form two groups. The first group consists of very large and large companies that have achieved relatively low median scale efficiency. The second group consists of small and medium-sized companies, which, in contrast, have reached relatively high values of median scale efficiency. When evaluating the results of scale efficiency by company size and the results of production efficiency in Fig. 3, it can be stated that larger companies tend to be more efficient, but the size of their operations is not optimal. Although smaller companies lag behind their larger competitors, the size of their operations is more proportionate to the size of the company. The detailed results presented in Fig. 5 show that within very large companies the median values of German companies differ significantly. Moreover, large German (but also Czech) companies have a high median efficiency in terms of scale. Thus, it can be generally stated that it is mainly Slovak (or Hungarian) companies that significantly reduce the scale efficiency of the whole group of very large and large companies.
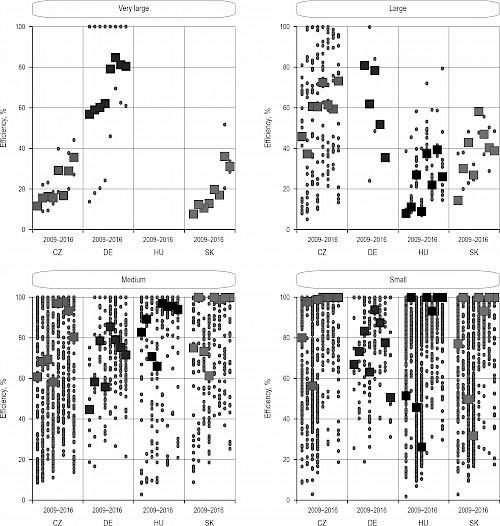
Fig. 5 Companies scale efficiency results (dot) from 2009 to 2016, categorized by company size and country, including median values (square)
3.4 Slacks Analysis Results
Efficient companies have slacks equal to zero, but inefficient companies have some non-negative slacks. Although it is difficult to present such individual values of slacks in general, given the scope of the analyses, only the resulting median value for the observed period is given. The medians of the relative frequencies of identified slacks for individual countries are presented in Table 6. These median values represent the typical frequency of a given slack. For example, in the case of Hungary, the median slacks for the labour factor are 38%, and those for capital are 46%, which means that 38% of Hungarian companies typically have a surplus of employees, and 46% of them have a surplus of capital. Some companies may have a surplus in both of these factors.
Table 6 Median relative frequencies of identified slacks for individual countries
|
Country |
Turnover |
Labour |
Capital |
Assets |
|
Czech Republic |
1.00 |
0.59 |
0.30 |
0.04 |
|
Germany |
0.98 |
0.33 |
0.39 |
0.11 |
|
Hungary |
1.00 |
0.38 |
0.46 |
0.01 |
|
Slovak Republic |
0.99 |
0.25 |
0.37 |
0.04 |
The DEA models identified output as the main problem. Given that over the entire period under review, the median number is close to 1 (100%), almost every inefficient company has a slack to some extent. A slack in turnover shows that companies should produce more. If inefficient companies produced more, they would approach or directly reach the efficiency frontier. In contrast, slacks were least common in the case of assets. In general, there was a very frequent surplus on the capital side. Only in the case of the Czech Republic is the median surplus of labour higher than the surplus of capital. This differentiation of the Czech Republic is mainly due to the results from 2015.
Although the Czech Republic has the highest median in the case of the frequency of surplus in labour (see Table 6), if we focus on the median absolute value of the slack, see Table 7, we find that it has a lower value than, for example, Germany. According to Table 7, which contains the median value of slack for individual countries for the entire period under review, a typical (median) company in the Czech Republic has a surplus of approximately three employees, while in Germany, the value is seven employees. Furthermore, it is worth noting that although slacks in turnover (and assets) are expressed in thousands of EUR, in Germany, the turnover gaps are several times higher than those in other countries. However, it is necessary to realize that Germany as a whole has roundwood production values that are approximately three times higher than those of the Czech Republic and even 10 times higher than those of Hungary. In addition, as mentioned above, Germany has a significantly lower share of small companies than other countries. It is therefore logical that larger companies that manage larger areas also have a greater shortage of turnover.
Table 7 Median values of slacks for individual countries. Assets, capital and turnover slacks are in thousands of EUR, and labour slacks are expressed in number of employees
|
Country |
Turnover |
Labour |
Capital |
Assets |
|
Czech Republic |
2971.27 |
–3.32 |
–187.21 |
–2503.44 |
|
Germany |
8334.09 |
–7.30 |
–25.88 |
–7244.25 |
|
Hungary |
1520.70 |
–2.33 |
–3.95 |
–725.56 |
|
Slovak Republic |
1535.92 |
–4.29 |
–7.61 |
–616.54 |
Germany also has a higher absolute value of median slack in the case of assets. Given that the median frequency of this surplus was 11%, with a median of over 7 million, it is a significant amount to reduce. A paradox can be found in the case of capital. The lowest median in Table 6 was found for the Czech Republic and the highest for Hungary, but the highest absolute value was for the Czech Republic and the lowest for Hungary. However, as in the case of efficiency itself, in the case of slacks, the values for individual countries are significantly influenced by the composition of companies in each country. For this reason, the analysis of surpluses and shortcomings with respect to company size offers more beneficial results.
The medians of the relative frequencies of slacks with respect to the companies’ size are shown in Table 8. Very large companies differ the most in terms of slacks. Although, as in the case of other companies, they most commonly present problems regarding the lack of turnover, in the case of very large companies, there is a surplus of labour and assets with roughly the same frequency. It was also found that very large and large companies have more than twice as many problems on the capital side, as on the labour side. Conversely, medium-sized and small companies have more balanced frequencies of labour and capital surpluses.
Table 8 Median of relative frequencies of identified slacks by company size
|
Size |
Turnover |
Labour |
Capital |
Assets |
|
Very large |
0.80 |
0.33 |
0.73 |
0.37 |
|
Large |
1.00 |
0.19 |
0.62 |
0.07 |
|
Medium |
0.99 |
0.48 |
0.33 |
0.09 |
|
Small |
1.00 |
0.37 |
0.39 |
0.01 |
If we focus on the absolute values of these slacks, then based on the median values in Table 9, it can be stated that as company size increases, the absolute value of a given surplus/shortfall also increases. For example, small companies, which typically have only a few employees, have a median surplus of approximately five employees. On the other hand, very large companies, which have thousands of employees, have surpluses of several hundred employees.
Table 9 Median values of slacks for individual countries. Assets, capital and turnover slacks are in thousands of EUR, and labour slack is expressed in number of employees
|
Size |
Turnover |
Labour |
Capital |
Assets |
|
Very large |
4,933,082.94 |
–796.49 |
–248,932.98 |
–1,385,554.30 |
|
Large |
204,326.78 |
–31.88 |
–2,656.95 |
–16,898.22 |
|
Medium |
7620.01 |
–10.98 |
–278.02 |
–2053.96 |
|
Small |
1533.57 |
–2.00 |
–4.87 |
–280.16 |
3.5 Malmquist Index (MI) Results
Finally, the change in technical efficiency and the production possibility frontier shift from 2009 to 2016 were calculated using the MI. Table 10 contains the results of the total MI, including its two components for individual countries. A significant shift in the overall situation is recorded within German companies, as the MI is significantly higher than one. There is no major change in Hungary and the Slovak Republic, as the MI values are close to one. The largest decrease is evident in the case of the Czech Republic, but even so, it is only 0.94. However, a more interesting finding is given by decomposition of the total MI value into its two components – change in technical efficiency and change in the production frontier, see Table 10.
Table 10 Medians of change in technical efficiency (TE), change in production possibility frontier (frontier) and total MI for individual countries
|
Country |
MI |
TE |
Frontier |
|
Czech Republic |
0.94 |
1.45 |
0.66 |
|
Germany |
1.44 |
0.88 |
1.76 |
|
Hungary |
1.01 |
1.56 |
0.65 |
|
Slovak Republic |
0.97 |
1.75 |
0.58 |
According to the decomposition of the MI, German companies are strongly pushing the frontier of production possibilities because the median of frontier change for German companies is greater than one. This is the only median greater than one in the case of frontier change in Table 10. As already observed in Table 5, German companies were abundantly represented among the super-efficient units, and many other German companies reached 100% efficiency scores in certain years. Although the MI (and its decomposition) was not calculated for each annual change, based on all these findings, it can be assumed that German companies have formed the shape of the frontier and pushed it up year-by-year.
Slovak, Czech and Hungarian companies typically have not pushed the frontier forward because their medians of frontier shift in Table 10 are less than one. However, based on the median values of the change in technical efficiency, a significant change in the efficiency of these companies can be seen. Except in Germany, the medians of technical efficiency are greater than one in Table 10, and thus, median efficiency has increased in these countries.
The decomposition of the MI was also examined by company size. The results in the form of medians categorized by company size are recorded in Table 11, where not only the overall results of MI but also its subcomponents (changes in efficiency and frontier) are presented. According to the MI values, most small and medium-sized companies did not experience major change during the observed period, as the medians of the total MI are close to one. As in the case of analyses at the country level, according to the size of the company, the information resulting from the decomposition of the MI is highly beneficial.
Table 11 Medians of change in technical efficiency (TE), change in production possibility frontier (frontier) and total MI by company size
|
Company |
MI |
TE |
Frontier |
|
Very large |
0.79 |
0.68 |
1.04 |
|
Large |
0.74 |
1.23 |
0.50 |
|
Medium sized |
0.93 |
1.29 |
0.89 |
|
Small |
1.04 |
1.76 |
0.60 |
Very large companies are found to push the frontier of production possibilities because the median of frontier change is greater than one for this type of company. All companies except the very large companies have a median frontier shift of less than one but conversely have a median technical efficiency greater than one. In other words, these companies typically do not push the production possibility frontier, but during the period under review, they approach the production frontier and thus improve their individual efficiency.
4. Discussion
The results of the CCR model show that most of the forestry companies were inefficient. The absolute median values of the efficiencies are consistently low for all countries, oscillating from 2% to 20% throughout the period. In terms of the median efficiency of producing roundwood, Germany took the first place. German companies appeared to be efficiency leaders, and Czech companies may be considered a reference for forestry company efficiency evaluations in the Slovak Republic and Hungary. This result supports the finding of Gutiérrez and Lozano (2020), who applied DEA for macro-data evaluation.
Concerning the efficiency by company size, there was no significant difference between the median efficiency of large, very large and small forest companies, yet medium-sized companies did slightly better throughout the period. However, the results of the decomposition of the Malmquist Index showed that it was very large companies and German companies that pushed the production possibility frontier from 2009 to 2016.
Scale efficiency appeared to be directly connected with forestry company size – small and medium companies usually appeared to be scale efficient or nearly scale efficient, while the median scale efficiency values of large and very large companies oscillated between 10% and 50%. However, analysis of the input and output values indicated that small and medium companies were vulnerable to quick losses in scale efficiency when turnover dropped annually. This is probably mostly due to the lower flexibility of small companies to change their inputs, particularly the number of employees who have only a few people covering the whole range of professions and are often not easily substitutable.
There are fewer very large and large companies than small companies, but their market share is significant. As a rule, companies in this category are state-owned enterprises. These companies systematically achieve lower median scale efficiency values than small and medium-sized companies. The slacks analysis revealed that output is the main problem, and on the input side, a considerable decrease in the number of employees is suggested. However, very large and large state-owned companies play an important role as employment providers, which may explain the common tendency to retain a high number of employees. Concerning turnover, which is the only output in our model, we suggest that although inefficient with respect to operating turnover, large and very large companies play an important role in providing non-production functions of forests, mainly recreational and health-improvement functions, in addition to producing pure roundwood production output. In future research, efficiency analysis accounting for non-production forest functions would be highly beneficial.
The influence of company size was reflected not only in the above-mentioned values of scale efficiency but also in the analyses of slacks. Very large (and large) companies that manage large areas have shortcomings in output values of an order of magnitude higher than their smaller competitors. This is similar to the situation of inputs, where very large companies have many times higher values, especially surpluses in assets and capital. The evaluation based on company size proved to be very beneficial even in the case of changes over time, i.e., in the analysis of the Malmquist Index. Although it is necessary to take this result with some caution due to the reduced number of observations, it shows that very large companies are the driving forces regarding production possibilities.
All the countries considered in the study are EU member states, however the EU does not have a common forestry policy, which is still mainly a national matter. Each national forestry policy pursues individually the objective of promoting the circular economy and bioeconomics. Therefore, inefficient companies may take the benchmark for efficient practices from another country, yet still may be limited by national forestry policy in following the international trend. Therefore, the adaptation of inefficient companies to the best EU practices should be supported by harmonizing national forestry policies and legal aspects across the EU. Generally, at a company level, technological improvements may be recommended, following the most efficient companies. Simultaneously, ongoing education and re-training of the work force to keep up-to-date know-how within a forestry company will be needed. The less efficient small and medium-sized enterprises might cooperate more across their value chains to achieve greater efficiency. Moreover, concerning EU Climate Policy, it is essential to focus on increasingly sophisticated, higher-value added products, e.g., by demonstrating their carbon storage potential. Under current conditions, it is important for managers to keep up with current trends – technological, ecological, economical and legal in a bioeconomy-based European forestry.
5. Conclusions
This paper applies the DEA approach to forestry companies and studies the efficiency and scale efficiency of forest companies in central Europe to provide micro-level financial data, DEA model settings and interpretations for the forestry sector. We applied DEA CCR analysis with the variables of turnover, labour, capital and assets to financial data from forest companies in the Czech Republic, Germany, Hungary and the Slovak Republic. The study covered the years 2009–2016 and companies of different sizes, from small and medium-sized to large and very large.
In the comparison of companies by country of origin, the Germany companies were, using medians, the most efficient, followed by Czech, Slovak and Hungarian companies. Based on this initial analysis, German companies appear to be efficiency leaders, and Czech companies may be considered a reference for forest company efficiency evaluations in the Slovak Republic and Hungary.
The proposed DEA model not only computes the efficiency scores but also suggests improvement targets for inefficient companies. The outputs of companies of all sizes and countries entail slacks and therefore can be increased. Output was identified as the main problem for almost every company; i.e., companies should produce more to approach the efficiency frontier. Another opportunity was found in decreasing inputs: for large and very large companies, the major opportunity was to decrease capital, while for medium and small companies, comparable opportunities were identified in decreasing capital and the number of employees. However, particularly for large and very large companies, we must consider their role in society as providing not only roundwood but also important non-production functions. These functions should be considered in future model elaborations to better understand the drivers of large and very large forest companies’ efficiency. Moreover, the forestry sector and particularly large and very large state-owned forest companies are important employers in central Europe, often tending to stabilize the employment rate; therefore, their limited flexibility in the number of employees should be taken into account when considering efficiency improvement strategies.
Although this analysis suggests that medium-sized and small companies are generally more efficient than larger companies, the use of the Malmquist Index indicates that very large companies are the driving forces in the production possibilities of forestry companies. Further analysis incorporating non-production output and subsidies would be beneficial to more deeply understand the role of company size in terms of efficiency.
The thorough discussion of DEA model settings using data for individual forestry companies may serve as an entry point for the future elaboration of the drivers of efficiency at the company level. Such research would yield important knowledge for consideration in the formulation of national forestry policies or, possibly, common European forestry policies and help foster the forestry-based bioeconomy in the EU.
Acknowledgments
This research was funded by the Czech Science Foundation grant GA18-08078S.
6. References
Battese, G.E., Coelli, T., 1988: Prediction of firm-level technical efficiencies with a generalized frontier production function and panel data. Journal of Econometrics 38(3): 387–399. https://doi.org/10.1016/0304-4076(88)90053-X
Battese, G.E., Coelli, T., 1995: A model for technical inefficiency effects in a stochastic frontier production function for panel data. Empirical Economics 20(2): 325–332. https://doi.org/10.1007/BF01205442
Bilici, E., Andiç, G.V., Akay, A.E., Sessions, J., 2019: Productivity of a portable winch system used in salvage logging of storm-damaged timber. Croatian Journal Of Forest Engineering 40(2): 311–318. https://doi.org/10.5552/crojfe.2019.590
Bureau van Dijk, 2020: Orbis. Available online: https://www.bvdinfo.com/en-gb/our-products/data/international/orbis#secondaryMenuAnchor3 (accessed 2020).
Cooper, W.W., Seiford, M.L., Tone, K., 2007: Data envelopment analysis: a comprehensive text with models, applications, references and DEA-solver software, 2nd ed. New York, Springer, 530 p. https://doi.org/10.1007/978-0-387-45283-8
Diaz-Balteiro, L., Romero, C., 2008: Making forestry decisions with multiple criteria: A review and an assessment. Forest Ecology and Management 255(8–9): 3222–3241. https://doi.org/10.1016/j.foreco.2008.01.038
Fei, Z., Li, Z.L., 2018: The analysis for the scale and efficiency of china's major automotive enterprises based on DEA model. Journal of Mathematics Research 10(2): 129–139. https://doi.org/10.5539/jmr.v10n2p129
Gaebert, T., Staňková, M., 2020: Efficiency development in the German pharmaceutical market. Acta Universitatis Agriculturae et Silviculturae Mendelianae Brunensis 68(5): 877–884. https://doi.org/10.11118/actaun202068050877
Greene, W.H., 2005: Reconsidering heterogeneity in panel data estimators of the stochastic frontier model. Journal of Econometrics 126(2): 269–303. https://doi.org/10.1016/j.jeconom.2004.05.003
Gutiérrez, E., Lozano, S., 2020: Cross-country comparison of the efficiency of the European forest sector and second stage DEA approach. Annals of Operations Research, 26 p. https://doi.org/10.1007/s10479-020-03756-9
Hlásny, T., Trombik, J., Bošeľa, M., Merganič, J., Marušák, R., Šebeň, V., Štěpánek, P., Kubišta, J., Trnka, M., 2017: Climatic drivers of forest productivity in Central Europe. Agricultural and Forest Meteorology 234–235: 258–273. https://doi.org/10.1016/j.agrformet.2016.12.024
Hollingsworth, B., 2003: Non-parametric and parametric applications measuring efficiency in health care. Health Care Management Science 6(4): 203–218. https://doi.org/10.1023/A:1026255523228
Hosseinzadeh, A., Smyth, R., Valadkhani, A., Le, V., 2016: Analyzing the efficiency performance of major Australian mining companies using bootstrap data envelopment analysis. Economic Modelling 57: 26–35. https://doi.org/10.1016/j.econmod.2016.04.008
Hu, X., Liu, Ch., 2015: Managing undesirable outputs in the Australian construction industry using Data Envelopment Analysis models. Journal of Cleaner Production 101: 148–157. https://doi.org/10.1016/j.jclepro.2015.03.077
Huang, T., Chiang, D., Lin, C., 2017: A new approach to estimating a profit frontier using the censored stochastic frontier model. The North American Journal of Economics and Finance 39: 68–77. https://doi.org/10.1016/j.najef.2016.12.001
Charoenrat, T., Harvie, C., 2014: The efficiency of SMEs in Thai manufacturing: a stochastic frontier analysis. Economic Modelling 43: 372–393. https://doi.org/10.1016/j.econmod.2014.08.009
Chen, J., Wu, Y., Song, M., Zhu, Z., 2017: Stochastic frontier analysis of productive efficiency in China's Forestry Industry. Journal of Forest Economics 28: 87–95. https://doi.org/10.1016/j.jfe.2017.05.005
Jondrow, J., Lovell, C.A.K., Materov, I.S., Schmidt, P., 1982: On the estimation of technical inefficiency in the stochastic frontier production function model. Journal of Econometrics 19(2–3): 233–238. https://doi.org/10.1016/0304-4076(82)90004-5
Kolář, T., Čermák, P., Trnka, M., Žid, T., Rybníček, M., 2017: Temporal changes in the climate sensitivity of Norway spruce and European beech along an elevation gradient in Central Europe. Agricultural and Forest Meteorology 239: 24–33. https://doi.org/10.1016/j.agrformet.2017.02.028
Kovalčík, M., 2018: Efficiency of the Slovak forestry in comparison to other European countries: An application of Data Envelopment Analysis. Central European Forestry Journal 64(1): 46–54. https://doi.org/10.1515/forj-2017-0026
Kovalčík, M., 2020: Profitability and efficiency of forest contractors in Slovakia – comparison of mountain and lowland regions. Forests 11(4): 370. https://doi.org/10.3390/f11040370
Kumbhakar, S.C., Wang, H., Horncastle, A.P., 2015: A Practitioner's Guide to Stochastic Frontier Analysis Using Stata, 1st ed. Cambridge University Press, 374 p.
Lee, K., Park, Y., Lee, D., 2018: Measuring efficiency and ICT ecosystem impact: Hardware vs. software industry. Telecommunications Policy 42(2): 107–115. https://doi.org/10.1016/j.telpol.2017.08.007
Li, L., Hao, T., Chi, T., 2017: Evaluation on China's forestry resources efficiency based on big data. Journal of Cleaner Production 142(2): 513–523. https://doi.org/10.1016/j.jclepro.2016.02.078
Li, H., Kopsakangas-Savolainen, M., Xiao, X., Tian, Z., Yang, X., Wang, J., 2016: Cost efficiency of electric grid utilities in China: A comparison of estimates from SFA-MLE, SFABayes and StoNED-CNLS. Energy Economics 55: 272–283. https://doi.org/10.1016/j.eneco.2016.02.011
Madaleno, M., Moutinho, V., Robaina, M., 2016: Economic and environmental assessment: EU cross-country efficiency ranking analysis. Energy Procedia 106: 134–154. https://doi.org/10.1016/j.egypro.2016.12.111
Manello, A., Calabrese, G., Frigero, P., 2016: Technical efficiency and productivity growth along the automotive value chain: evidence from Italy. Industrial and Corporate Change 25(2): 245–259. https://doi.org/10.1093/icc/dtv021
Matthews, B., Netherer, S., Katzensteiner, K., Pennerstorfer, J., Blackwell, E., Henschke, P., Rosner, S., Jansson, P.-E., Schume, H., Schopf, A., 2018: Transpiration deficits increase host susceptibility to bark beetle attack: Experimental observations and practical outcomes for Ips typographus hazard assessment. Agricultural and Forest Meteorology 263: 69–89. https://doi.org/10.1016/j.agrformet.2018.08.004
Mezei, P., Jakuš, R., Pennerstofer, J., Havašová, M., Škvarenina, J., Ferenčík, J., Slivinský, J., Bičárová, S., Bilčík, D., Blaženec, M., Netherer, S., 2017: Storms, temperature maxima and the Eurasian spruce bark beetle Ips typographus – An infernal trio in Norway spruce forests of the Central European High Tatra Mountains. Agricultural and Forest Meteorology 242: 85–95. https://doi.org/10.1016/j.agrformet.2017.04.004
Młynarski, W., Kaliszewski, A., 2018: Efficiency evaluation in forest management – a literature review. Forest Research Papers 79(3): 289–298. https://doi.org/10.2478/frp-2018-0029
Oh, S.-Ch., Shin, J., 2015: The impact of mismeasurement in performance benchmarking: A Monte Carlo comparison of SFA and DEA with different multi-period budgeting strategies. European Journal of Operational Research 240(2): 518–527. https://doi.org/10.1016/j.ejor.2014.07.026
Routa, J., Nuutinen, Y., Asikainen, A., 2020: Productivity in mechanizing early tending in spruce seedling stands. Croatian Journal of Forest Engineering 41(1): 1–11. https://doi.org/10.5552/crojfe.2020.619
Silva, T.Ch., Tabak, B.M., Cajueiro, D.O., Dias, M.V.B., 2016: A comparison of DEA and SFA using micro and macro-level perspectives: Efficiency of Chinese local banks. Physica A: Statistical Mechanics and its Applications 469: 216–223. https://doi.org/10.1016/j.physa.2016.11.041
Staňková, M., 2020: Efficiency comparison and efficiency development of the metallurgical industry in the EU: Parametric and non-parametric approaches. Acta Universitatis Agriculturae et Silviculturae Mendelianae Brunensis 68(4): 765–774. https://doi.org/10.11118/actaun202068040765
Staňková, M., Hampel, D., 2018: Efficiency comparison in the development of building projects sector. In: Mathematical Methods in Economics 2018, Conference Proceedings. MatfyzPress: 503–508.
Staňková, M., Hampel, D., 2019: Efficiency of the building project sector in the Czech Republic – Stochastic Frontier Analysis approach. In: International Conference of Numerical Analysis and Applied Mathematics (ICNAAM 2018). Melville, American Institute of Physics (AIP), 2116(1): 400007.
Staňková, M., Hampel, D., 2021: On the influence of model setting on Stochastic Frontier Analysis. Mathematical Methods in the Applied Sciences 44(1): 274–283. https://doi.org/10.1002/mma.6730
Šporčić, M., Landekić, M., 2014: Nonparametric model for business performance evaluation in forestry. In: J. Awrejcewicz (Ed.), Computational and numerical simulations. London: IntechOpen. https://doi.org/10.5772/57042
Thanassoulis, E., 2013: Introduction to the theory and application of Data Envelopment Analysis: A foundation text with integrated software, 1st ed. New York, Springer, 281 p. https://doi.org/10.1007/978-1-4615-1407-7
Viitala, E.-J., Hänninen, H., 1998: Measuring the efficiency of public forestry organizations. Forest Science 44(2): 298–307. https://doi.org/10.1093/forestscience/44.2.298
Wijesiri, M., Vigano, L., Meoli, M., 2015: Efficiency of microfinance institutions in Sri Lanka: a two-stage double bootstrap DEA approach. Economic Modelling 47: 74–83. https://doi.org/10.1016/j.econmod.2015.02.016
Yang, H., Yuan, T., Zhang, X., Li, S., 2016: A decade trend of total factor productivity of key state-owned forestry enterprises in China. Forests 7(5): 97. https://doi.org/10.3390/f7050097
© 2022 by the authors. Submitted for possible open access publication under the
terms and conditions of the Creative Commons Attribution (CC BY) license (http://creativecommons.org/licenses/by/4.0/).
Authors’ addresses:
Michaela Staňková, PhD
e-mail: michaela.stankova@mendelu.cz
Assoc. prof. David Hampel, PhD
e-mail: david.hampel.uso@mendelu.cz
Assoc. prof. Jitka Janová, PhD *
e-mail: jitka.janova@mendelu.cz
Mendel University in Brno
Faculty of Business and Economics
Department of Statistics and Operation Analysis
Zemědělská 1
613 00, Brno
CZECH REPUBLIC
* Corresponding author
Received: February 22, 2021
Accepted: October 20, 2021
Original scientific paper