
SEILAPLAN, a QGIS Plugin for Cable Road Layout Design
doi: 10.5552/crojfe.2022.1824
volume: 43, issue:
pp: 16
- Author(s):
-
- Bont Leo
- Moll Patricia Edith
- Ramstein Laura
- Frutig Fritz
- Heinimann Hans Rudolf
- Schweier Janine
- Article category:
- Original scientific paper
- Keywords:
- cable road design, cable yarder, forest harvesting, forest management, standing skyline
Abstract
HTML
Cable-based technologies have been the backbone of forest management and harvesting on steep slopes for decades. The design of a cable road is a complex task. It essentially comprises the identification of the start and end points of a cable road, as well as the intermediate supports. With the aim of simplifying this design process, we developed a semi-automated cable road design tool (QGIS plugin SEILAPLAN) that is easy and intuitive to use. SEILAPLAN is based on mechanical assumptions for the structural analysis that are »close-to-reality«, contains an algorithm that checks all possible intermediate support combinations and automatically identifies the optimal solution, and integrates tools and geodata within a GIS application. We present its main components and present an example of application. The integration into a GIS program, the implemented cable mechanics, and the associated information for the construction of a cable road were highly appreciated by the users.
SEILAPLAN, a QGIS Plugin for Cable Road Layout Design
Leo Gallus Bont, Patricia Edith Moll, Laura Ramstein, Fritz Frutig, Hans Rudolf Heinimann, Janine Schweier
Abstract
Cable-based technologies have been the backbone of forest management and harvesting on steep slopes for decades. The design of a cable road is a complex task. It essentially comprises the identification of the start and end points of a cable road, as well as the intermediate supports. With the aim of simplifying this design process, we developed a semi-automated cable road design tool (QGIS plugin SEILAPLAN) that is easy and intuitive to use. SEILAPLAN is based on mechanical assumptions for the structural analysis that are »close-to-reality«, contains an algorithm that checks all possible intermediate support combinations and automatically identifies the optimal solution, and integrates tools and geodata within a GIS application. We present its main components and present an example of application. The integration into a GIS program, the implemented cable mechanics, and the associated information for the construction of a cable road were highly appreciated by the users.
Keywords: cable road design, cable yarder, forest harvesting, forest management, standing skyline
1. Introduction
Cable-based logging technology has a long tradition in Central Europe, in the Pacific Northwest of the United States and Canada, and in Japan (Visser and Harrill 2017). European cable yarder technology became popular in the 1960s, and the first tower yarders appeared in in 1963 with the development of the so-called »Gösser Tower Yarder« from Mayr-Melnhof (Heinimann et al. 2001).
Logging by cable yarder is of particular importance in steep terrain. For example, about half of Switzerland’s forests are only accessible by cable- and air-borne systems, and about a quarter of the forest area is managed by cable yarders, with sledge winch systems and tower yarders being used to a similar extent (Brändli et al. 2020). In addition to use in steep terrain, cable yarders are sometimes used in flat terrain, for example for soil protection reasons (Erber and Spinelli 2020, Schweier and Ludowicy 2020, Schweier et al. 2020).
Regardless of the type of cable yarder and the purpose of its use, the detailed layout design of a cable road is a demanding and time-consuming task. It essentially involves the identification of the start and end points of the cable road, as well as the intermediate supports.
A cable road is an engineering structure that has to follow the requirements of structural engineering design. The structural design has to make sure that structural safety requirements are met, which means tensile forces of the cables, bending stresses of the intermediate support, and tensile forces on anchors must all be within safety limits. Additionally, the serviceability criterion defines requirements to achieve the desired use of a system. Ground clearance of the load, smooth passage of the carriage over intermediate supports, and minimum lateral deflection to minimize damage to residual trees are typical serviceability aspects that need to be considered.
The search for a solution is a complex combinatorial problem. In practice, it is often iterative and several attempts may be necessary to reach an acceptable solution, especially in the case of long cable roads. For example, the design and staking out of a cable road of 1500 m length requires about 20 hours, according to the HeProMo productivity models (Holm et al. 2020). In particular, the mechanical analysis of a cable structure is a challenge. The analysis of the tensile forces acting on the cables, and the analysis of the load path (with a loaded carriage) of the skyline requires a set of coupled non-linear equations, for which there is no closed-form solution. In most cases, the analysis is done with linearized equations, known as Pestal’s equations (1961), for which there are closed-form solutions but which results in an overestimation of the skyline deflections (Bont and Heinimann 2012). This ultimately leads to more expensive cable roads, with more or even taller supports than necessary.
In recent years, the amount and diversity of high-quality geospatial data has increased significantly. For example, since 2013 a digital elevation model (DEM) with a resolution of 2 m has been available for the whole of Switzerland (swissALTI3D from Swisstopo), and this dataset has been freely available since March 2021. This is of great benefit for the planning of cable roads, as it is relatively easy to read out a length profile between two given points from the DEM. In addition to extracting a terrain length profile from the geodata, indications about support or anchor trees can be obtained if appropriate remote sensing data is available.
It is therefore imperative for a state-of-the-art tool for cable road design to:
1. be based on mechanical assumptions for the structural analysis that are »close-to-reality« (mechanical)
2. contain an algorithm that checks all possible intermediate support combinations and automatically identifies the optimal solution (optimization)
3. integrate tools and geodata within a GIS program with the aim of simplifying the design process (GIS integration)
4. be easy and intuitive to use (user-friendly).
There are other tools for the design of cable roads, but they do not meet all of the above-mentioned requirements. The LoggerPC software (Sessions 1992) was developped by the Oregon State University and was one of the first tools for this purpose. Based on LoggerPC, Skyline XL (Rheinberger 2021) was later developed by the USDA Forest Service. Both tools can be used to analyze cable roads whose support positions and heights must be defined manually. Skyline XL was implemented in EXCEL and provides the expected skyline tensile forces and the load-path curve. It has a simple structure and all data are briefly described. In addition, Skyline XL has a plugin for Esri® ArcGIS, which makes it possible to directly import the terrain profile if a license for ArcGIS is available. A disadvantage of Skyline XL as well as LoggerPC is that the assumptions of the structural model and the safety factors are not documented. Other software that include GIS capabilities are CHPS (Cable Harvest Planning Solution) and Softree. CHPS (CHPS 2016) is based on LoggerPC & SkylineXL and is fully integrated into ArcMap as add-in program/toolbar (Harrill 2016). Softree (Softree 2020) is tailored for analyzing terrain and calculating payloads. It can only tackle single span configurations and its mechanical assumptions are not published.
Within the NEWFOR EU-research project, some tools have been developed based on different principles (Berger et al. 2014). The resulting Java-based tool NEWFOR Cableway and the R-package NEWFORCC from the Slovenian Forest Institute are based on the above-mentioned approximation formula introduced by Pestal (1961). NEWFORCC can be used to calculate the optimal support positions, the height of the unloaded and loaded skyline, and the support saddle forces. In addition, with the use of NEWFOR Cableway, the working area that can be reached by cable yarders can be visualized, as well as the risk zones for forestry personnel. The tool also alerts users of situations in which the minimum ground clearance is not respected and of unfavorable skyline deflection angles and unfavorable anchoring. The tool SimulCable (Magaud 2011) is based on the Pestal assumptions. It can be used with manual or automatic optimization of the intermediate supports. In addition, the forces acting on the skyline and the skyline lengths are generated as output. In CableHelp (Dupire et al. 2014), a tool from IRSTEA Grenoble in France, the algorithm is based on that proposed by Irvine (1981) and was adapted for cable yarders according to Dupire et al. (2016). An existing layout can be calculated or a new one can be optimized considering structural safety (e.g. forces) and serviceability (e.g. sag). The tool, written in Python, outputs the optimal position of intermediate supports, the load-path curve, and the evolution of forces by load position, but it is not integrated into a GIS program. This means that the results must first be exported before they can be used with other geodata in a GIS program.
The purpose of the present research was to develop a semi-automated cable road design tool, which includes the above-stated four requirements for a state-of-the-art software (mechanical, optimization, GIS integration, user-friendly). The tool was set up as an open-source project to ensure complete transparency of the calculation principles and to include the opportunity for further independent development and adaptation of the tool to specific needs. Following the principle of open-source, we designed the tool as plugin for the open-source GIS software QGIS (www.qgis.org). The name of the plugin SEILAPLAN originates from the German »Seillinien Layout Planer«, which means cable road layout designer.
The paper is organized as follows. First, we provide an overview of the workflow of the plugin. We then discuss technical information and offer insight into the software development process and certain aspects of the implementation. Next, we characterize the workflow for using the plugin, including the required input data and the features implemented. We present an example application of the plugin in the application section. We close the paper with discussion and conclusions. Information on installation and software availability can be found in the appendix.
2. General Overview of Plugin
2.1 Conceptual Framework
Fig. 1 illustrates the workflow and the main system components. After installation, SEILAPLAN can be executed by clicking on the SEILAPLAN icon in the QGIS toolbar. The user is then guided through the design process in two main windows, the start and the adjustment window. In the start window, the course of the cable road (including start and endpoints) is defined, the length profile is loaded, and the properties of the cable yarder and the requirements for the cable road design are set. In addition, the parameters for the optimization can be specified. Once all relevant properties have been defined, either the optimization routine can be started, which automatically proposes a solution, or the user can proceed directly to manual processing in the adjustment window. The adjustment window has been designed as a workplace for detailed design. There, the height and position of the supports must be defined. Concurrently, it is displayed if the cable road meets all serviceability and structural safety criteria. Also, the user has the possibility to adjust the input parameters. The solution values can then be exported or saved for further processing.
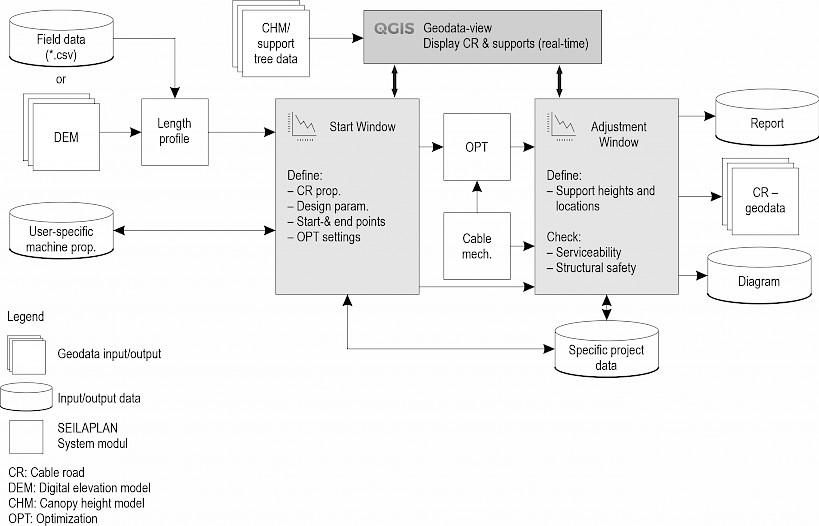
Fig. 1 Conceptual framework of QGIS plugin SEILAPLAN
2.2 Technical Implementation
Having the open-source aim in mind, SEILAPLAN has been developed as a plugin for the widely used open-source application QGIS (www.qgis.org). Plugins generally expand the functionality of the base application and can be created by anyone. Users can search for and add plugins from a free, central repository managed by the QGIS creators or add a new repository themselves.
The SEILAPLAN plugin was developed on a Linux operating system but is fully functional under Windows and MacOS. To run the plugin, no additional software is required. As is standard for QGIS plugins, the plugin was implemented using Python 3 (Oliphant 2007) and the graphical user interface (GUI) was designed with the framework Qt (www.qt.io). The SEILAPLAN code base is freely available and published on the web. The code is hosted on Github (https://github.com) and can be accessed via https://github.com/piMoll/SEILAPLAN. The code base follows the default template provided by the PluginBuilder, a useful QGIS plugin that creates a shell for developers to create their own plugin.
The optimization algorithm was originally developed in Matlab (Higham and Higham 2016) and translated into Python code to be executable in the QGIS environment. The typical matrix structure of Matlab was replicated using the well-known Python library NumPy (Oliphant 2006, Harris et al. 2020) (https://numpy.org), and more complex scientific aspects like sparse matrices and curve fitting were implemented using the library SciPy (Virtanen et al. 2020) (https://www.scipy.org). Looking at the individual folders and script files inside the plugin, one can see that the core optimization algorithm and computation of the exact cable road represent only a small part of the whole code base. These files are organized in the directory tool, together with scripts dealing with geodata handling and file exporting.
When developing SEILAPLAN, great emphasis was put on programming an understandable and interactive GUI. The GUI provides the user with useful information, gives feedback, and shows plots and key figures of the calculated results. This is why most of the plugin files handle the design and functionality of the GUI and are situated in the plugin subdirectory gui.
Terrain information, as well as the computed cable road and support positions, is plotted using the Python library Matplotlib (https://matplotlib.org). The library can be used to plot native NumPy arrays and can be integrated into a Qt-Dialog window or exported as a PNG-image file.
Since the plugin internally operates mostly on NumPy arrays, input raster data has to be converted into an array structure as well. Python bindings for the Geospatial Data Abstraction Library GDAL (https://gdal.org) were used to load the elevation raster data into memory and transform it into a two-dimensional NumPy array.
For any other geodata handling the QGIS, the internal Python API PyQGIS (https://qgis.org/pyqgis/master) was utilized. PyQGIS is not only capable of creating, editing and transforming geodata, it can furthermore be used to manipulate the QGIS application itself. Thanks to this API, SEILAPLAN is capable of setting the project coordinate reference system, drawing points and lines onto the canvas, and adding geodata as new layers into the QGIS.
Internationalization of the GUI is implemented using Qt-Translation capabilities (https://doc.qt.io/qt-5/internationalization.html). Translators can work with the utility QtLinguist (https://doc.qt.io/qt-5/qtlinguist-index.html) to manage and translate phrases. Translation files are saved to the plugin directory and are loaded when the plugin starts.
On Windows and MacOS, all of the presented Python libraries are included in the Python installation that is bundled with QGIS. On Linux, QGIS does not ship with its own Python version but uses the system Python version. Depending on the Linux distribution, a library could be missing. In this case, the plugin will inform the user at startup.
3. Theoretical Background
3.1 Cable Mechanics
Structural design projects have to be designed according to certain criteria, in particular:
1. structural safety
2. serviceability
3. operational safety, e.g. Eurocode 1 (Eurocode 2008).
SEILAPLAN was designed for Central European cable yarder technology. Therefore, the analysis method was adapted to standing skylines (fixed skylines anchored on both ends), which have elastic cable properties. Since multi-span configurations are possible, it must also be taken into account that the skyline can be fed over the support saddles (the terms »cable shoe« and »jack« can also be used for support saddles, but we use »saddle« in this paper) as the carriage moves from one span to the next. All of these factors will result in different skyline tensile forces, depending on the position of the carriage. Under these conditions, catenary equations must be applied for an accurate analysis of the skyline behavior (load-path curve, tensile forces). However, due to the non-linearity of these equations, it is not possible to obtain an analytical solution. The solution has to be calculated numerically in a sophisticated way. Several possible solutions for the catenary equations have been presented in the literature, such as in Zweifel (1959), Zweifel (1960), Carson et al. (1971), Irvine (1981), Dupire et al. (2016) and Knobloch and Bont (2021). The calculations in SEILAPLAN are based on Zweifel’s method (Zweifel 1960) because they consider the relevant effects mentioned above. There is one exception: the friction between the skyline and the saddle is not considered in Zweifel’s approach. Dupire et al. (2016) have shown that slightly more accurate results can be obtained if friction is considered; if friction is neglected the results are slightly too conservative (slightly larger deflection and force output compared with reality), which results in greater safety. A validation of the implemented Zweifel algorithm is presented in Bont et al. (2022).
Notably, SEILAPLAN does not consider the aspect of predicting dynamic force peak values, which are mainly caused by inhaul or lateral skidding, as shown by Mologni et al. (2019). This aspect is very demanding to integrate and there are only a few approaches that take it into consideration, such as (Carson 1973). Furthermore, there is a high share of uncertainty associated to predicting dynamic forces (Mancuso et al. 2018). As these dynamic force peaks are difficult to calculate and can occur under a wide range of operational conditions, a safety factor is introduced to »absorb« such force peaks so that the minimum breaking strength of the skyline is not exceeded. Our design approach follows the »permissible stress design« philosophy, although »limit state design« has become the prevailing design approach (EN 1990).
The implemented approach using Zweifel’s method also does not consider the effect when loads are in contact with the ground (partial suspension), but however, the tool is of great relevance for partial suspension logging practice. It indicates where each case occurs (suspended or sliding), so that particularly critical situations with high dynamic forces can be identified and avoided; for example situations where loads come into contact with the ground (partial suspension), suddenly become completely suspended after a terrain edge and then start to swing. Spinelli et al. (2021) concluded that high-dynamic loads in a well-managed standing skyline operation are less frequent and extreme than expected.
In addition to the calculation of the skyline sag and the occurring skyline tensile forces, it is also of great practical relevance to output the resulting support saddle forces and the resulting minimum required dimensions of the support tree. This is used to dimension the corresponding components, such as the support saddle shoe. Those computations are done according to Pestal (1961). Pestal (1961) used Euler´s critical load case II, assumed an E-Modulus of timber (80,000 kg cm-2) and took a safety factor of 5 to calculate minimum central diameter of a support tree. To derive the minimum required DBH of a support tree, we assumed that the diameter of a tree decreases by 1 cm for each 1 m of height according to Pestal (1961).
3.2 Optimization
For multi-span cable configurations, an additional problem has to be solved besides the cable mechanics, i.e. the position of the intermediate supports in a given terrain profile. Solutions were found in the past by intuition, practical experience, and trial and error. Pestal (1961) described some rules of thumb that are still useful today.
The development of automatic methods to locate intermediate supports began with the research of Sessions (1992). His algorithm first placed intermediate supports at all protruding points in the terrain profile. The search for the definitive solution was then conducted using a heuristic algorithm that eliminated the second of three consecutive intermediate supports if the ground clearance was greater than the minimum required (Chung and Sessions 2003). This process continued until the number of supports was less than the user-defined maximum.
Leitner et al. (1994) presented a solution to determine both the best position of intermediate supports above a terrain profile and their optimal height. The problem was represented as a graph. A solution was found by using the Pestal (1961) formula, but this led to conservative and, therefore, inefficient results. Bont and Heinimann (2012) combined Leitner’s approach with Zweifel’s cable mechanics (Zweifel 1959, Zweifel 1960) and obtained efficient and feasible results. In SEILAPLAN, the algorithm proposed by Bont and Heinimann (2012) is implemented. It determines the position of the intermediate supports and their heights such that the number of supports and their heights are minimized. A check is completed to see whether:
Þ a minimum ground clearance is maintained
Þ the permissible skyline tensile forces are not exceeded
Þ a minimum gradient in the skyline is maintained in the case of a gravitational operation as visualized in Fig. 2.
The parameters for the optimization can be specified in the tab »Optional #1« in the start window Fig. 3. The optimization can be computationally intensive depending on the choice of parameters, with the support distance interval (»minimum distance between potential support positions« δl) and the support height interval (»Grading range« δh) having the largest influence. Thus, recommended values are δl ≈ 10 m and δh ≈ 1 m according to Bont and Heinimann (2012).
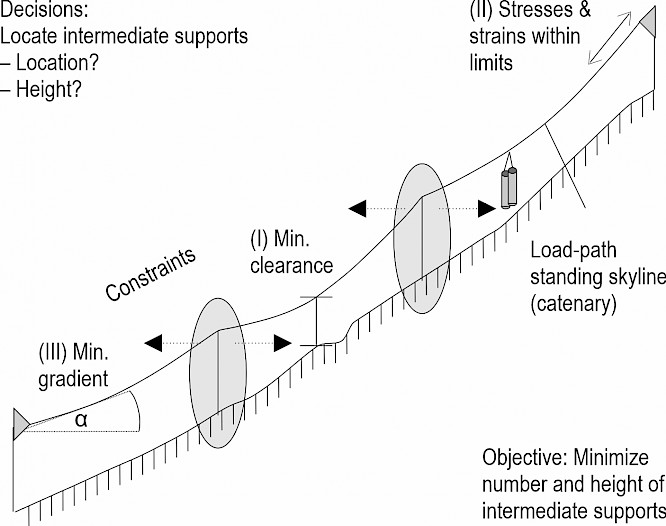
Fig. 2 Optimization problem of the cable road layout: the algorithm determines the position of intermediate supports and their heights such that the number of supports and their heights are minimized. A check is completed to see whether (I) a minimum ground clearance is maintained, (II) the permissible skyline tensile forces are not exceeded, and (III) a minimum gradient in the skyline is maintained in the case of a gravitational operation
4. Required Data Inputs
4.1 Topographical Information
Topographical information can be imported into SEILAPLAN as a digital elevation model (DEM) or as a terrain profile from field surveys.
The DEM must be available as a raster layer. Usually, it can be read into QGIS as a *.tiff, *.txt or *.asc file. WMS services of DEMs are not supported. The raster must be in a projected coordinate system; geographic coordinates (in degrees) are not supported. To obtain sufficiently accurate results, DEMs must have a resolution of at least 10 m, but 2 m is recommended (Bont and Heinimann 2012).
The field data must be available in CSV file format. Two different file types are allowed:
Þ Export file from Vertex Laser Geo: The CSV output file must not be customized. The data is saved in the WGS 84 coordinate system and automatically transformed into the current reference system of the QGIS project when imported into the SEILAPLAN tool. If this is a geographic reference system (e.g. WGS 84), the Swiss reference system LV95 is used instead.
Þ CSV file: The CSV file must contain the three columns X (east coordinate), Y (north coordinate) and Z (elevation), in this exact order. The coordinates of the recorded terrain points must be correctly sorted along the terrain line. The side from which the terrain points are listed is not relevant at this point. The file must not contain any text other than the header (first line of the file). Since this file does not contain any information about the reference system, the reference system of the QGIS project is assumed. If this is a geographic reference system (e.g. WGS 84), the Swiss reference system LV95 (EPSG 2056) is used instead.
4.2 Cable Road and Design Parameters Specification
In the start window (see section 5.1), specific cable road or design parameters can be set. In this way, the local conditions in the optimization and calculation of the cable road can be taken into account. Three predefined parameter sets can be selected in the tool. However, one or more user-defined parameter sets can also be defined and permanently saved.
The technical design parameters of the cable yarder system that must be specified are listed in Table 1. Further, one can specify whether a two-rope or a multiple-cable system is being used. In the case of a two-rope system, gravity is used and therefore the cable road is checked for a continuous gradient. Furthermore, a minimum ground clearance can be defined. There are situations in which the span must only be partially passable by a carriage, mainly at the beginning or at the end of a cable road. For such situations, segments of the cable road can be specified, on which the minimum ground clearance does not have to be respected.
Table 1 Design parameter specifications of the cable road
|
Parameter |
Unit |
|
Load weight (including carriage) |
kN |
|
Self-weight of skyline |
kN m-1 |
|
Diameter of skyline |
mm |
|
Minimum breaking strength of skyline |
kN |
|
Self-weight of mainline |
kN m-1 |
|
Self-weight of haulback line |
kN m-1 |
|
Pre-stress tensile force of unloaded skyline (Mounting tension force) |
kN |
|
E-modulus of skyline |
kN mm-1 |
|
Fill factor of skyline |
[ ] |
5. User Interface
An important goal was to design a plugin that is highly user-friendly and therefore easy to use for everyone involved in cable road design. For this purpose, potential users were involved in the development process at an early stage. In addition to the aspects described and implemented in the following chapters, great emphasis was put on documentation. Therefore, the main windows contain numerous information buttons that explain the individual input parameters.
5.1 Start Window
The start window appears after SEILAPLAN has been started in QGIS. Here, the source of the terrain data has to be specified (see section 4.1) and the characteristics of the machine and cable road have to be defined (see section 4.2). By drawing in the geodata window in QGIS, the position and type (support / head / tail spar, tower yarder or anchor) of the start and end points can be defined (Fig. 3).
Before the calculation runs, an automatic error check of the input parameters is performed. Four different variants of spans are possible: support to support, tower yarder to support, tower yarder to anchor, and anchor to anchor. Their feasibility will be checked automatically. In case of invalid input, the error is intercepted and the user is informed. For example, if the two-rope system is selected for downhill yarding, the following error message appears: »Error: No two-rope system possible if the level of the start point (for winch/machine) is lower than the end point.«
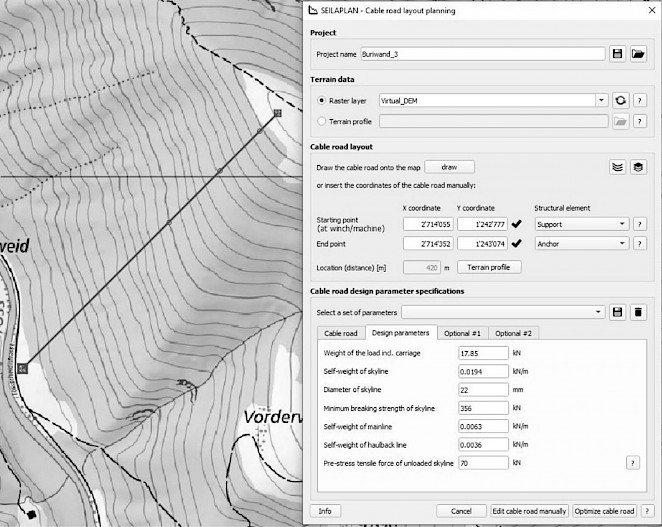
Fig. 3 Start window (right) with geodata-view in QGIS (left). The path of the cable road can be specified by drawing a line in the geodata-view in QGIS
5.2 Adjustment Window
The adjustment window of the cable road is used to fine-tune the optimization result and adapt it to real operating conditions (Fig. 4). A cable road can also be edited manually and calculated without the »optimization« routine. The main element of the window is the diagram with the terrain profile in the upper part of the window. In the lower part, design or machine parameters can be adjusted, supports can be set, deleted or edited, and the characteristic values of the structural design (serviceability and structural safety) of the current solution can be checked. The diagram shows the current cable road. It is updated immediately when height and location of supports or design parameters are changed.
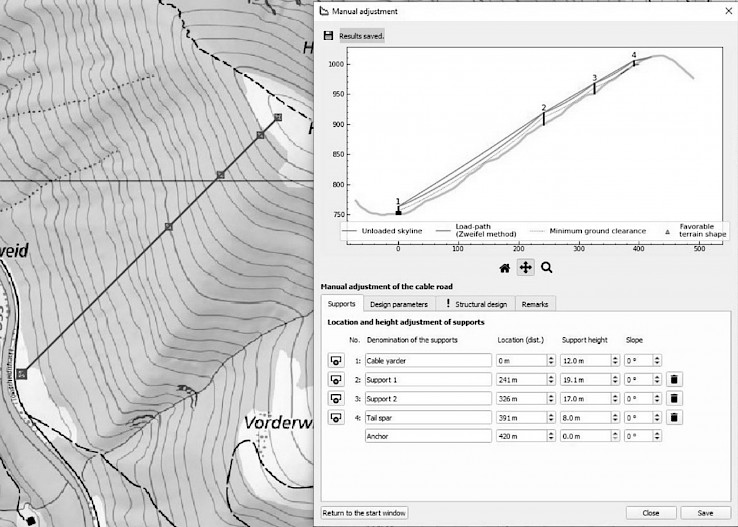
Fig. 4 Left: Topographic map displayed in QGIS. The drawn line corresponds to the course of the cable road and the squares represent intermediate supports; Right: Corresponding adjustment window of SEILAPLAN for manual positioning of intermediate supports
The tab »Structural design« shows whether the threshold values for structural design are respected or not (see Fig. 5 for a screenshot of the tab and Table 2 for a detailed description). The defined threshold values, which are partly based on the predefined design and cable road parameter set, the calculated values of the optimized solution, and the new values after a manual adjustment are listed. If the threshold values are exceeded, the corresponding boxes are highlighted (in red on the screen /dark grey in Fig. 5). With a click on the corresponding row, the location of the exceeded value is displayed in the terrain profile diagram (Fig. 5 top).
Table 2 Serviceability and structural safety properties that are checked in SEILAPLAN
|
Structural design criteria |
Unit |
Description |
|
Minimum ground clearance |
m |
Determines whether a minimum ground clearance (load path to ground) is fulfilled or not. |
|
Maximum tensile force (skyline) |
kN |
The threshold value for the maximum cable tensile force is defined as the minimum breaking force of the skyline cable divided by the safety factor. The skyline tensile force with the load and carriage in the middle of the span field is relevant. |
|
Maximum resultant support saddle force |
kN |
There is no threshold value for the resulting saddle force. The maximum possible value depends on dimensions of support trees. A minimum value of DBH of support trees is provided in the report. |
|
Maximum rope deflection angle of loaded skyline |
30/60° |
Larger rope deflection angles reduce the breaking force of the skyline and result in higher saddle forces (Pestal, 1961). The two threshold values, 30° for drivable and 60° for non-drivable supports, are empirical values from practice. |
|
Maximum rope deflection angle of unloaded skyline |
1/3° |
According to Pestal (1961), for rope deflection angles below 1° there is a risk that the skyline will lift off the saddle (values highlighted in red). For rope deflection angles between 1° and 3°, the skyline must be held in place by means of a hold-down lug (values highlighted in orange). |
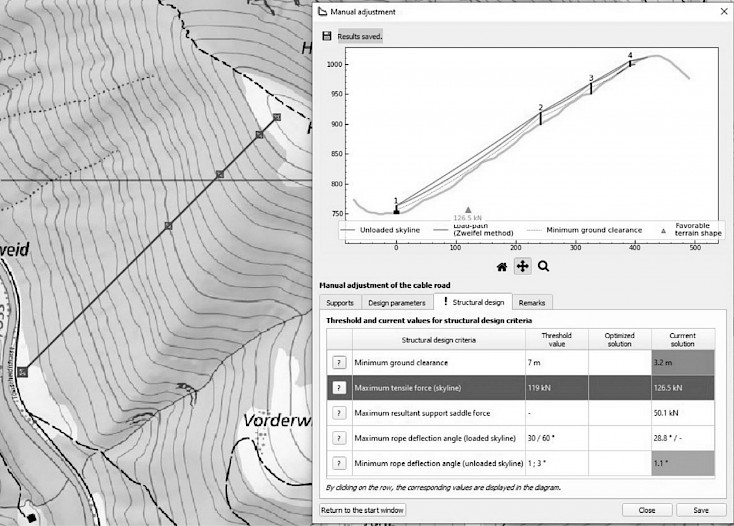
Fig. 5 Adjustment window with the tab »Structural design« displaying threshold and current values for structural design (serviceability and structural safety) criteria. With a click on a particular row (»Maximum tensile force« highlighted in dark grey), the corresponding values are displayed in the length profile diagram
5.3 Interface to QGIS
One of the goals of the interface, or rather of the integration into QGIS, is to integrate existing geodata into the planning process as easily as possible. In the context of cable road planning, 1) digital elevation models and 2) canopy height models, orthophotos or single tree detections are of particular relevance. The latter datasets help to identify possible anchor or support trees already during the planning process in the office and thus simplify the workflow in the field.
The integration is done through the following steps:
Þ The user displays the canopy height model, orthophoto and/or single tree layer in QGIS
Þ The user places the intermediate supports in the adjustment window. During the fine adjustment of the intermediate support positions in the adjustment window of SEILAPLAN, the user can see the positions of the supports (squares) in the QGIS geodata view at the same time. The display is dynamic, which means the user can move the intermediate support in the adjustment window and see in parallel in the geodata window how the position of the intermediate support moves.
5.4 Output
Depending on the selection, the output is produced as a PDF file, shape file or CSV table. The characteristic values of the calculated cable road can be provided in a short report and a detailed technical report. In the short report, all relevant information for the construction of a cable road can be found, and thus it serves as a construction manual. Furthermore, a plot of the cable road in terrain-profile view can be selected. The cable road layout can be saved as a shape, KML or CSV file and the settings of the preferred solution can be saved and reloaded later.
6. Application
SEILAPLAN was tested on several cable roads and is already in use by forest contractors and enterprises. The following real-world example illustrates the capabilities and functionality of the plugin. The cable road was built in the framework of a commercial operation in the Buriwand area (canton of Zurich, Switzerland, UTM Coordinates: 47.3282, 8.9465) and extends from 750 m a.s.l. up to 1000 m a.s.l. The mixed forest consisted mainly of spruce, fir, beech and sycamore maple. Timber harvesting was carried out in May 2020 using a Syncrofalke 4-ton tower yarder with a Sherpa U4 XL carriage, both from MM Forsttechnik GmbH, and a mounted processor. The timber was extracted in the downhill direction. The cable road included two intermediate supports, one tail spar and was anchored on the uphill side with a dead man’s anchor. The first span was more than twice as long as the other two spans. The output diagram is shown in Fig. 6, and the short report, which can be used as a construction manual, in Fig. 7. In Fig. 6, the plot of the load-path curve and its corresponding illustration of the ground clearance is particularly useful. Having a look at Fig. 6, it is also apparent that the condition of sufficient ground clearance is not completely fulfilled in the third span. Therefore, to resolve this issue, for example, a smaller payload must be transported there or higher supports are necessary.
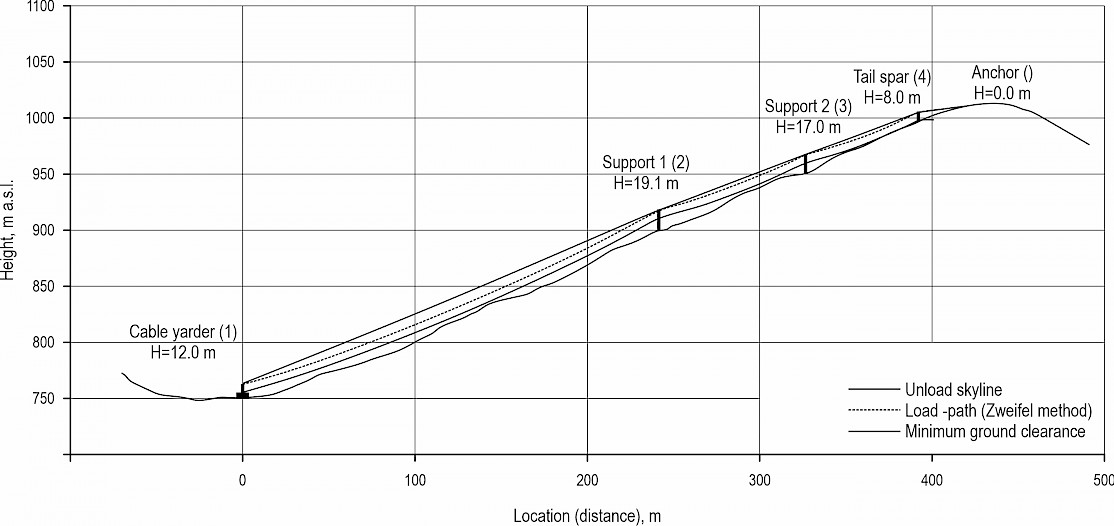
Fig. 6 Output diagram of the cable road in the Buriwand area (canton of Zurich), which consists of the terrain profile and cable road with different load paths (unloaded and loaded) and an illustration of ground clearance
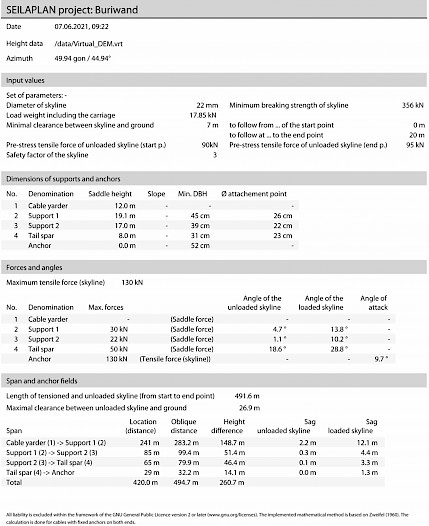
Fig. 7 Short report of the cable road in the Buriwand area, which can be used as construction guide, in the short report, the input values and all required values for the construction of a cable yarder system are listed: dimensions of supports and anchors, forces and angles, and properties of spans and anchor fields, for example, based on the calculated forces on the saddles, the minimum DBH a tree must have (min. DBH) is indicated, following (Pestal 1961)
7. Discussion and Conclusion
The purpose of this article was to present the new »QGIS plugin SEILAPLAN« to the community and the design decisions that had been taken based on existing knowledge and on research work. The plugin is a semi-automated state-of-the-art cable road design software, with the following features:
1. a »close-to-reality« cable mechanic module
2. an optimization routine
3. integration into a GIS program
4. a user-friendly GUI.
The integration into a GIS program, as well as the implementation of cable mechanics, was very much appreciated by practitioners. The pilot enterprises valued the implemented precise calculation method according to Zweifel and the associated realistic information for the construction and operation of a cable road. They also used various remote sensing datasets and GIS layers for manual and situational adjustment of the cable road, which was facilitated by the integration of the tool into QGIS. According to the forest practitioners involved in the research project, the output containing the most important information about the cable road in graphical form and as a short report was helpful for the documentation of the cable road project and could additionally be used as a construction guide.
The incorporated automatic optimization algorithm for the intermediate support location and the support height in the QGIS plugin is of little use for skilled planners. From their point of view, the manual editing option is especially valuable, as it can be used to test different variants easily and quickly. Thus, a good or even optimal solution can quickly be identified, even manually. Experience has shown that users prefer applying a tool to »try things out« rather than being served by a ready-made solution. On the one hand, the tool can increase the understanding of a system and, on the other hand, the solution from the optimization routine would still have to be checked manually (e.g. to verify if there are really support trees where the tool proposes to set one). The optimization algorithm could be developed further to achieve results closer to »expert solutions« by including the criterion of the »rope deflection angle« at the supports and also by including the presence of support trees in the optimized solution search.
The tool was designed according to the needs of the target users. It has already been used operationally by enterprises during its development. Without specifically promoting the plugin, it has already spread widely among potential users, mainly through recommendations from experienced cable logging enterprises that are already using it. This indicates a broad acceptance and high user-friendliness.
The tool has great practical relevance as it simplifies cable road design by rapidly and reliably evaluating different variants and obtaining realistic results. As a result, the layout of cable roads can be designed more efficiently, which in turn leads to more cost-effective timber harvesting in steep terrain. The open-source concept makes it available to a wide range of users. Students and apprentices can reach a good understanding of cable road systems. They can, for example, experiment with different load configurations or span lengths and see what is feasible and how these settings interact with each other in an interactive way.
In the research setting, the tool serves as a basis for trying out new methods. For example, new methods of single tree detection, in which it is possible to identify tree species, as well as stability or stem shape, could be directly integrated into a tool and made accessible to practice.
We have received many suggestions from the practice partners for improvement and further development of SEILAPLAN, which could be implemented in a follow-up project.
Þ Flexible support positions: In reality, it can happen that there is no suitable support tree at the calculated optimal support position. In this case, a new, nearby support is usually selected on site and no recalculation of the cable road is necessary. Therefore, it would be valuable to know what effect repositioning a support would have on the forces and the sag. In addition to the optimal support position, a range could be given within which the support could be moved without exceeding the maximum cable tensile force and without falling below the minimum ground clearance. In addition, this information could be supplemented with the support height, which may change with repositioning
Þ Threshold value for skyline rope deflection angle: In the current version (3.2) of SEILAPLAN, the threshold values of the unloaded and loaded skyline rope deflection angle are not considered in the optimization. Solutions in which the skyline lifts off the saddle or the carriage cannot travel over the support because the loaded cable rope deflection angle is too large could be excluded
Þ Addition to the diagram output: For staking and constructing the cable road, it could be helpful to add information to the diagram, such as a terrain profile, support positions and the cable road course. On the one hand, including a section of an aerial photo or a topographic map would improve navigation. On the other hand, a bird’s eye sketch of the cable road (situation plan) would improve the applicability of the cable plan output as a construction guide. In such a sketch, construction details, such as whether the skyline passes through the support(s) on the left or right side, could be shown clearly
Þ User interface adjustments: The usability could be improved. It would be useful if the start and end coordinates could already be moved and recalculated in the adjustment window.
Acknowledgments
We are very grateful to the Swiss Federal Office for the Environment FOEN, the Swiss Forest and Wood Research Fund (WHFF-CH) and the professorship of ETHZ Prof. Dr. H.R. Heinimann for providing financial support for this project. We also thank the forestry company Nüesch und Ammann AG (Eschenbach SG, Switzerland) for dedicated cooperation during the measurements and the testing of SEILAPLAN in daily business. We acknowledge the forest enterprise Tössstock (state forest Zurich) and Ortsgemeinde Lichtensteig for the permission to carry out measurements at their sites. We are grateful to the forestry companies Abächerli AG (Giswil OW, Switzerland) and Untervaz (GR, Switzerland) for constructive feedback on SEILAPLAN. We further thank Pfeifer Isofer AG for valuable input on cable properties and the loan of a load cell, the forestry company Mayr-Melnhof for information on the cable equipment and for testing the measurement protocol through an internship, and Wyssen Seilbahnen AG (Reichenbach BE, Switzerland) for answering our questions about support saddles, cable properties and cable yarders. Last but not least, we thank Melissa Dawes for English editing assistance and Stefan Holm for useful hints concerning the manuscript.
8. References
Berger, F., Dupire, S., Nemestóthy, N., Monnet, J-M., Hainzer, E., Stoehr, D., 2014: Forest logistic planning strategies. Good practices for the Alpine forests, 111 p.
Bont, L., Heinimann, H.R., 2012: Optimum geometric layout of a single cable road. European Journal of Forest Research 131(5):1439–1448. https://doi.org/10.1007/s10342-012-0612-y
Bont, L.G., Ramstein, L., Frutig, F., Schweier, J., 2022: Tensile forces and deflections on skylines of cable yarders: comparison of measurements with close-to-catenary predictions. International Journal of Forest Engineering. (Accepted) https://doi.org/10.1080/14942119.2022.2051159
Brändli, U.B., Abegg, M., Allgaier Leuch, B., 2020: Schweizerisches Landesforstinventar: Ergebnisse der vierten Erhebung 2009–2017.(results of the fourth Swiss National Forest Inventory 2009–2017). Birmensdorf, Switzerland: Swiss Federal Research Institute for Forest, Snow and Landscape Research, Birmensdorf (ZH) and Federal Office for the Environment (FOEN), Bern.
Carson, W.W., 1973: Dynamic characteristics of skyline logging cable systems. PhD Thesis. Seattle, WA, USA: University of Washington, Mechanical engineering.
Carson, W.W., Studier, D., Lysons, H.H., 1971: Running skyline design with a desk-zop computer/plotter. Portland, OR, USA.
CHPS. 2016: CHPS Home. Available online: http://cableharvesting.com/ (accessed 2021 Oct 28)
Chung, W., Sessions, J., 2003: A computerized method for determining cable logging feasibility using a DEM. In: Bar Harbor, Maine.
Dupire, S., Bourrier, F., Berger, F., 2014: CableHelp: A numerical tool to optimize the set-up of a standing skyline and improve cable yarding planning, 15 p.
Dupire, S., Bourrier, F., Berger, F., 2016: Predicting load path and tensile forces during cable yarding operations on steep terrain. Journal of forest research 21(1): 1–14. https://doi.org/10.1007/s10310-015-0503-4
Erber, G., Spinelli, R., 2020: Timber extraction by cable yarding on flat and wet terrain: a survey of cable yarder manufacturer’s experience. Silva Fennica 54(2): 1–19. https://doi.org/10.14214/sf.10211
Eurocode, 2008: Eurocodes: Building the future – The European Commission website on the Eurocodes 130. Available online: https://eurocodes.jrc.ec.europa.eu/showpage.php?id=130 (accessed 2021 Apr 26).
Harris, C.R., Millman, K.J., van der Walt, S.J., Gommers, R., Virtanen, P., Cournapeau, D., Wieser, E., Taylor, J., Berg, S., Smith, N.J., Kern, R., Picus, M., Hoyer, S., van Kerkwijk, M.H., Brett, M., Haldane, A., Fernández del Río, J., Wiebe, M., Peterson, P., Gérard-Marchant, P., Sheppard, K., Reddy, T., Weckesser, W., Abbasi, H., Gohlke, C., Oliphant, T.E., 2020: Array programming with NumPy. Nature 585(7825): 357–362. https://doi.org/10.1038/s41586-020-2649-2
Heinimann, H.R., Stampfer, K., Loschek, J., Caminada, L., 2001: Perspectives on Central European Cable Yarding Systems. In: The International Mountain Logging and 11th Pacific Northwest Skyline Symposium 2001, Seattle.
Higham, D.J., Higham, N.J., 2016: MATLAB guide. SIAM.
Holm, S., Frutig, F., Lemm, R., Thees, O., Schweier, J., 2020: HeProMo: A decision support tool to estimate wood harvesting productivities. PLOS ONE 15(12): e0244289. https://doi.org/10.1371/journal.pone.0244289
Irvine, M.H., 1981: Cable structures. The NTTPress.
Knobloch, C., Bont, L.G., 2021: A new method to compute mechanical properties of a standing skyline for cable yarding. PLOS ONE 16(8): e0256374. https://doi.org/10.1371/journal.pone.0256374
Leitner, A., Yaohua, L., Leitner, A.S., 1994: A new computer aided planning tool for cable logging. In: Sessions J, editor. Harbin (P.R. of China), 8 p.
Magaud, P., 2011: SIMULCABLE: A new software to optimise the line implantation for cable yarding. In: Pushing the boundaries with research and innovation in forest engineering FORMEC 2011, Proceedings of the 44th International Symposium on Forestry Mechanisation, Graz, Austria, 9–13 October, Institute of Forest Engineering, University of Natural Resources and Life.
Mancuso, A., Belart, F., Leshchinsky, B., 2018: Operative loading in cable yarding systems: field observations of static and dynamic tensions in mobile anchor systems. Canadian Journal of Forest Research 48(11): 1406–1410. https://doi.org/10.1139/cjfr-2018-0219
Mologni, O., Lyons, C.K., Zambon, G., Proto, A.R., Zimbalatti, G., Cavalli, R., Grigolato, S., 2019: Skyline tensile force monitoring of mobile tower yarders operating in the Italian Alps. European Journal of Forest Research 138(5): 847–862. https://doi.org/10.1007/s10342-019-01207-0
Oliphant, T.E., 2006: A guide to NumPy. Trelgol Publishing USA.
Oliphant, T.E., 2007: Python for Scientific Computing. Computing in Science Engineering 9(3): 10–20. https://doi.org/10.1109/MCSE.2007.58
Pestal, E., 1961: Seilbahnen und Seilkräne für Holz- und Materialtransporte. Wien und München: Georg Fromme & Co.
Rheinberger, S., 2021: SkylineXL 18.0. Skyline profile and payload analysis. USFS PNW Forest Products Programs and Software. Available online: https://www.fs.usda.gov/detail/r6/landmanagement/resourcemanagement/?cid=fsbdev2_027048
Schweier, J., Klein, M-L., Kirsten, H., Jaeger, D., Brieger, F., Sauter, U.H., 2020: Productivity and cost analysis of tower yarder systems using the Koller 507 and the Valentini 400 in southwest Germany. International Journal of Forest Engineering 31(3): 172–183. https://doi.org/10.1080/14942119.2020.1761746
Schweier, J., Ludowicy, C., 2020: Comparison of A Cable-Based and a Ground-Based System in Flat and Soil-Sensitive Area: A Case Study from Southern Baden in Germany. Forests 11(6): 611. https://doi.org/10.3390/f11060611
Sessions, J., 1992: Unpublished software developed for educational use. Oregon State University, Corvallis, OR.
Softree 2020 Cable Analysis : Softree Technical Systems Support. Available online: https://support.softree.com/knowledge-base/terrain-module/cable-analysis (accessed 2021 Oct 28).
Spinelli, R., Magagnotti, N., Cosola, G., Grigolato, S., Marchi, L., Proto, A.R., Labelle, E.R., Visser, R., Erber, G., 2021: Skyline tension and dynamic loading for cable yarding comparing conventional single-hitch versus horizontal double-hitch suspension carriages. International Journal of Forest Engineering 32(sup1): 1–11. https://doi.org/10.1080/14942119.2021.1909322
Virtanen, P., Gommers, R., Oliphant, T.E., Haberland, M., Reddy, T., Cournapeau, D., Burovski, E., Peterson, P., Weckesser, W., Bright, J., van der Walt, S.J., Brett, M., Wilson, J., Millman, K.J., Mayorov, N., Nelson, A.R.J., Jones, E., Kern, R., Larson, E., Carey, C.J., Polat, İ., Feng, Y., Moore, E.W., VanderPlas, J., Laxalde, D., Perktold, J., Cimrman, R., Henriksen, I., Quintero, E.A., Harris, C.R., Archibald, A.M., Ribeiro, A.H.,Pedregosa, F., van Mulbregt, P., SciPy 1.0 Contributors, 2020: SciPy 1.0: fundamental algorithms for scientific computing in Python. Nature Methods 17(3): 261–272. https://doi.org/10.1038/s41592-019-0686-2
Visser, R., Harrill, H., 2017: Cable Yarding in North America and New Zealand: A Review of Developments and Practices. Croatian Journal of Forest Engineering 38(2): 209–217.
Zweifel, O., 1959: Näherungslösungen für die Lastwegkurve einer Einzellast bei beidseitiger Verankerung der Tragseile. Internationale Seilbahn Rundschau 2(2).
Zweifel, O., 1960. Seilbahnberechnung bei beidseitig verankerten Tragseilen. Schweizerische Bauzeitung 78(1/2): 11.
Appendix A
Installation
SEILAPLAN can be installed via the QGIS plugin menu under Plugins > Manage and Install Plugins. A new repository must be added under Settings. The address of the repository is: https://raw.githubusercontent.com/piMoll/SEILAPLAN/master/plugin.xml
The plugin can be installed under 3.6 versions or newer of QGIS, but updating to a current version of QGIS is advised. To let QGIS automatically check for plugin updates, the corresponding setting under Manage and Install Plugins > Settings has to be activated. Whenever an update for a plugin is available, a notification will appear at the bottom of the QGIS interface.
The plugin supports four languages: German, French, Italian and English. Depending on the language settings of QGIS, SEILAPLAN automatically adapts to the current language (Settings > Options > General > Locale menu). If the language of QGIS cannot be adopted, SEILAPLAN will be displayed in German (English in the next release). To change the language of the plugin manually, the language settings in QGIS have to be adjusted and then QGIS has to be restarted.
Software availability
Name of software: SEILAPLAN
Software required: QGIS 3.6 and newer
Program Language: Python 3
Developers: Leo Bont (cable mechanics, optimization), Patricia Moll (GUI)
Software license: GNU – General Public License
Contact Address: Sustainable Forestry Group, Swiss Federal Institute for Forest, Snow and Landscape Research (WSL), Zuercherstrasse 111, CH 8903 Birmensdorf, Switzerland
Email : leo.bont@wsl.ch
Availability : https://seilaplan.wsl.ch/ or https://github.com/piMoll/SEILAPLAN (website, documentation) or http://pimoll.github.io/SEILAPLAN/ (source code)
© 2022 by the authors. Submitted for possible open access publication under the
terms and conditions of the Creative Commons Attribution (CC BY) license (http://creativecommons.org/licenses/by/4.0/).
Authors’ addresses:
Leo Gallus Bont, PhD *
e-mail: leo.bont@wsl.ch
Laura Ramstein
e-mail: laura.ramstein@wsl.ch
Fritz Frutig
e-mail: friedrich.frutig@bluewin.ch
Janine Schweier, PhD
e-mail: janine.schweier@wsl.ch
Swiss Federal Institute for Forest, Snow and Landscape Research (WSL)
Sustainable Forestry Group
Zuercherstrasse 111
CH 8903 Birmensdorf
SWITZERLAND
Patricia Edith Moll
e-mail: piMoll.dev@gmail.com
CH 5600 Lenzburg
SWITZERLAND
Prof. Hans Rudolf Heinimann, PhD
e-mail: hans.heinimann@env.ethz.ch
ETH Zurich
Department of Environmental Systems Science
CH 8092 Zurich
SWITZERLAND
* Corresponding author
Received: September 17, 2021
Accepted: November 5, 2021
Original scientific paper