Assessment of Tractor Tires Used in Forest Conditions in Terms of Traction Performance and Impact on Ground
doi: 10.5552/crojfe.2024.1171
volume: 45, issue:
pp: 16
- Author(s):
-
- Białczyk Włodzimierz
- Article category:
- Original scientific paper
- Keywords:
- traction properties, soil damages, tractive efficiency, slip, rolling resistance
Abstract
HTML
This paper presents the assessment of selected tractor tires used in forest conditions. The first element of this assessment is related to tractive properties, while the second part concerns the potential negative impact of the tires on the ground. The research was conducted on the skid trail located in a lowland pine stand in Poland (Lower Silesian District). The 9.5-24, 400/55-22.5 and 11.2R24 tires were used for the experiment, and the following tractive parameters were analyzed: traction force, pulling force and rolling resistance. These parameters were determined during the experiment using special measure stand mounted on a 3-point linkage of the tractor. In addition to the traction properties, the impact of the wheel on the ground was determined – this evaluation included measurements of footprint areas and calculation of contact pressures. Based on the obtained results, it was shown that the increase of the vertical load and reduction of the inflation pressure of tires can cause an increase in net traction force of as much as 35% and 16%, respectively. The analysis of contact areas and pressures showed that the widest tire (400/55-22.5) had the least negative impact on the ground. The reducing of inflation pressure allowed to obtain higher traction force, higher contact area and smaller contact pressures.
Assessment of Tractor Tires Used in Forest Conditions in Terms of Traction Performance and Impact on Ground
Marek Brennensthul, Jarosław Czarnecki, Włodzimierz Białczyk
Abstract
This paper presents the assessment of selected tractor tires used in forest conditions. The first element of this assessment is related to tractive properties, while the second part concerns the potential negative impact of the tires on the ground. The research was conducted on the skid trail located in a lowland pine stand in Poland (Lower Silesian District). The 9.5-24, 400/55-22.5 and 11.2R24 tires were used for the experiment, and the following tractive parameters were analyzed: traction force, pulling force and rolling resistance. These parameters were determined during the experiment using special measure stand mounted on a 3-point linkage of the tractor. In addition to the traction properties, the impact of the wheel on the ground was determined – this evaluation included measurements of footprint areas and calculation of contact pressures. Based on the obtained results, it was shown that the increase of the vertical load and reduction of the inflation pressure of tires can cause an increase in net traction force of as much as 35% and 16%, respectively. The analysis of contact areas and pressures showed that the widest tire (400/55-22.5) had the least negative impact on the ground. The reducing of inflation pressure allowed to obtain higher traction force, higher contact area and smaller contact pressures.
Keywords: traction properties, soil damages, tractive efficiency, slip, rolling resistance
1. Introduction
One of the main challenges in forest management is to provide environmentally friendly forest operations, which aims at developing and deploying technologies able to efficiently use resources and minimizing impacts on the structure and function of the forest environment (Heinimann 2007). Logging operations is an example of the strongest human intervention into forest environment, causing many threats to its individual components. In mechanized wood harvesting, each operation must be carried out with minimal impact on the environment and in a cost-effective manner (Spinelli et al. 2014, Thees and Olschewski 2017). In forestry operations, the use of ground-based machinery for logging is common practice around the world. A wide range of equipment, such as skidders, forwarders, and tractors are employed (Bygdén et al. 2003, Agherkakli et al. 2010, Picchio et al. 2011, Ganatsios et al. 2021). Even in the case of tracked vehicles and machines, which should cause lower compaction than wheeled machinery, the values of unit pressure generated on the forest soil can be higher than the recommended value of 70 kPa (Kormanek and Dvořak 2021). On flat or slightly sloped terrain, wheeled machines are generally preferred because of higher performance in terms of productivity and cost (Spinelli et al. 2012). In recent years, these vehicles have become progressively more powerful and efficient but also heavier, which increases negative impact on the soil (Vossbrink and Horn 2004, Horn et al. 2007).
Another problem in forest operations is to determine traction properties of the forest machines and tractors. In the case of wheeled vehicles, their move is possible due to the occurrence of the traction force between the tire and ground. This force can be transferred by the shearing process or by the friction (Karpman et al. 2022). The first mechanism is most common on deformable grounds – also in the case of forest grounds. Traction force (also known as »gross traction force«) is a derivative of the torque on the drive wheels of the vehicle (Zoz and Grisso 2003). However, tractive properties are largely dependent on the ground parameters; if the mechanical strength of the ground is low (this situation often occurs in case of forest grounds), there will be a risk of energy losses in the power transmission from the wheel to the ground. As a consequence, the traction force will be used in small scale to generate the pulling force, which can have a negative impact on cost efficiency of forest vehicles. In the extreme case, small pulling force can stop the forest operations. The energy losses in the wheel–ground system is related to two negative phenomena. The first is the wheel slippage, while the second is a rolling resistance of the wheel. The slippage (sometimes known as »slip« or »travel reduction«) occurs when the horizontal force applied to the soil by a tire or track overcomes the internal shearing strength of the soil, which results in the soil displacing and moving in the opposite direction to the vehicle motion (Alakukku et al. 2003). Rolling resistance is the force resisting the motion, when a wheel rolls on a surface and is directed opposite to the direction of the wheel movement. The accepted view is that rolling resistance consists of two components: one is soil deformation and the other is tire deflection (Kiss 2009). For a vehicle moving on a hard surface, the tire flexing component of the rolling resistance is dominant. Under off-road conditions, in contrast, due to vertical soil compaction and horizontal soil displacement, i.e. rut formation, the rolling resistance makes up the largest part of the motion resistance force (Çarman 2002).
The movement of vehicles over the soil can cause soil damage in the form of scuffing, compaction and rutting. The extent of this damage depends principally on the site and soil characteristics (Ampoorter et al. 2007, Ismoilov et al. 2015), soil moisture, machine traction characteristics (Šusnjar et al. 2006, Wang et al. 2007) and the number of machine passes (Eliasson and Wasterlund 2007). Rut formation may involve direct or indirect damage to the trees root system (Stone and Elioff 2000), and organisms living in the soil (Lindo and Visser 2004), while altered soil and climatic conditions may decrease plant diversity (Buckley et al. 2003). Soil compaction involves the compression of pores, which leads to decreased porosity and pore continuity (Berli et al. 2003, Fernandez et al. 2016, Toivio et al. 2017, D'Acqui et al. 2020, Grigorev et al. 2022). The common effects on soils from drive wheels of forest machines is removal of litter mass in skid trails (Tan et al. 2008). Damage to soil contributes to the deterioration of conditions for tree growth and reduce the site productivity (Gomez et al. 2002, Smith 2003, Nieminen et al. 2017).
As presented in the introduction, with respect to forest operations, there are two main requirements: the first is to obtain the best traction properties, and the second is to prevent damage to the soil (Gelin and Björheden 2020). The improvement of the traction properties can be realized in two main ways: change in the wheel load and change in the inflation pressure of the tire. Application of higher vertical load of drive wheels in tillage works may result in increasing the drawbar force by up to 15% depending on the value of ballast weights (Serrano et al. 2007, Serrano et al. 2009, Muhsin 2010). Increase in dynamic load of the forwarder equipped with Trelleborg Twin 421 Mark II 600/55-26.5 tires also resulted in significant increase in tractive efficiency at 5% slip (Jun et al. 2004). This method to improve traction characteristics has a very important disadvantage – higher vertical forces can cause compaction of the soil and damage to its structure (Grečenko and Prikner 2014, Barbosa and Magalhaes 2015). Increase in vertical load of vehicle drive wheels may also lead to increased rolling resistance and consequently decrease the tractive efficiency, and cause more intense tire wear, increase in fuel consumption and greenhouse gas emissions (Patel and Mani 2011, Lacour et al. 2014, Damanauskas et al. 2015, Damanauskas and Janulevičius 2015, Janulevičius and Damanauskas 2021). Tractor performance researchers recommend the reduction of tire inflation pressure for increasing the contact area between the tires and the ground as a method to reduce energy losses caused by wheel slippage (Šmerda and Čupera 2010, Battiato and Diserens 2017). As a result of increased contact area, vehicle weight is spread across a larger area, reducing pressure on the soil (Nam et al. 2010). Kurjenluoma et al. (2009) reported that the reduction of tire inflation pressure resulted in reduced rolling resistance and rut depth only on soft soil, when the soil strength was low, while in hard soil conditions, the effect on rolling resistance was quite the opposite. Depending on the vehicle size and type of tires, the net traction forces may be increased by up to 8% (Sümer and Sabanci 2005, Elwaleed et al. 2006, Taghavifar and Mardani 2013, Pryadkin et al. 2021).
The studies conducted so far have shown that tire parameters such as vertical load and inflation pressure affect tractive performance of wheels at different degrees of significance. It also depends on other factors such as tire type and size, slippage and soil conditions. In this context, the issue of improving traction performance by ballasting or by reducing the inflation pressure of the tires is thought to require further and deeper understanding in order to better define clear indications for a correct choice of the off-road vehicle configuration. It is important to remember that correct selection of tires and their operation parameters can significantly affect vehicle performance and reduce the impact on forest soils; moreover the safety and comfort of operators could be improved. For this reason the aim of this study is to evaluate the impact of the selected operational parameters of the tire on the traction performance, and to analyze the impact on the ground. The vertical load of the wheel and the inflation pressure of the tire will be taken into account as operational parameters.
2. Materials and Methods
The study was carried out in Poland (province Lower Silesia) in Forest District Oława, Forest Sub-district Chrząstawa Wielka (51°05'28.80"N, 17°18'15.60"E). The research on tractive performance of tires was conducted on a skid trail located in lowland pine forest stand. The skid trail was created on typical acidic brown soil. The value of maximum shearing stress strength on undisturbed soil was 72 kPa, while soil penetration resistance was 1.13 MPa. The bearing capacity of tested grounds was in the range of 25–30 MN∙m-2 (these data were obtained from the forest inspectorate). Based on particle size distribution, the soil was determined as sand. The study was carried out in autumn on the soil with the moisture content of 8.3% vol., and the specific soil field capacity of 3.5%. The average values of maximum shearing stress strength and soil penetration resistance measured at the depth of 0–0.1 m in the skid trail were 120 kPa and 3.58 MPa, respectively (they were almost two times higher than values obtained in the soil out of the skid trail). The studies were conducted using a professional mobile stand for testing tires in field conditions (Fig. 1).
The research stand consists of two-part frame mounted on the three-point linkage of Massey Ferguson 235 farm tractor. The tested wheel mounted on the stand was powered by tractor PTO (using a hydro-mechanical gear and additional intermediate shaft). The test stand was equipped with the following measuring devices: inductive dynamometer located between the external and internal parts of the frame and used for measuring the drawbar force, the inductive torquemeter for measuring the drive torque of tested wheel. The actual and theoretical distances were measured using two rotational encoders MOK40 – one of them was mounted on the shaft with the tested wheel (to measure the theoretical distance) and the other was mounted on the extra wheel (to measure the actual distance). The main technical data of the measuring devices are presented in Table 1.
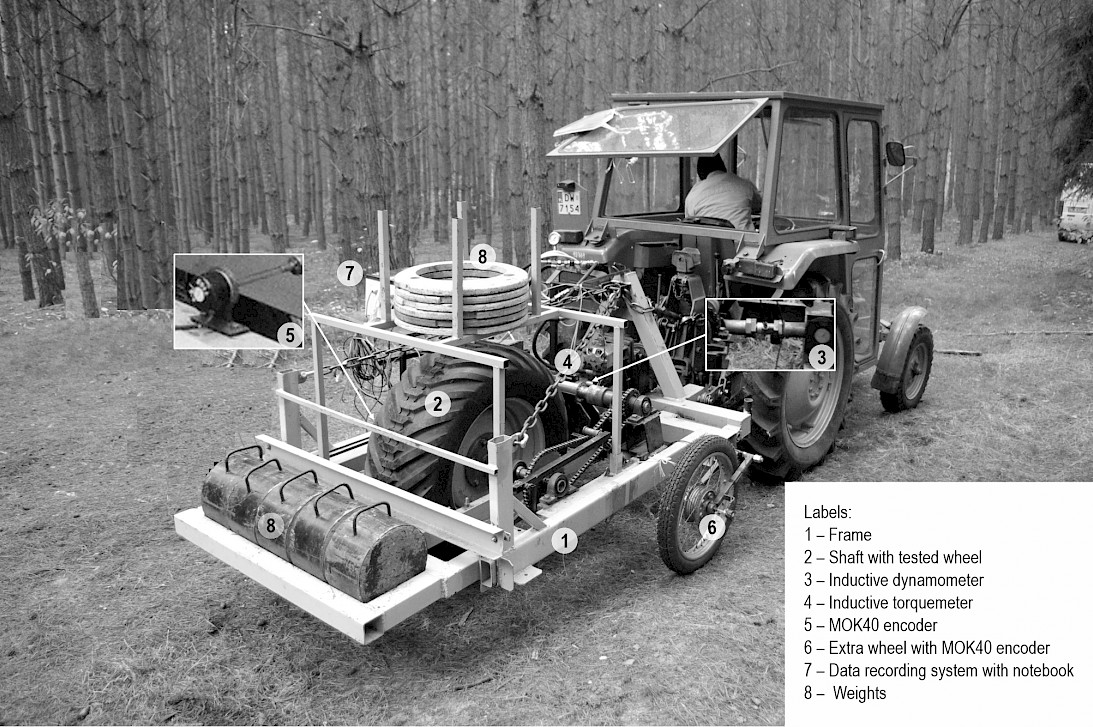
Fig. 1 Test stand for measuring traction properties of tires
Table 1 Measuring devices performance
|
Instrumentation |
Measured parameter |
Range |
Accuracy |
|
|
Inductive dynamometer |
Net traction force |
0–100 kN |
±10 N |
|
|
Inductive torquemeter |
Torque |
0–3000 Nm |
±3 Nm |
|
|
Rotational encoder MOK40 |
Angle of the wheel rotation |
0–360·n* |
±0.36° |
|
|
* n – number of rotations |
||||
During the study, the test stand was moving with the tractor (in neutral gear box position). In the final phase of measurement, the test stand was stopped by the tractor brake. In this way the full range of tested wheel slip was obtained. The data from all measurement devices were recorded in data recording system.
The research was carried out for three tires. Two of them were cross-ply tires (9.5-24 and 400/55-22.5), one was radial tire (11.2R24). The main features differentiating the tested tires, apart from the construction, were the width and tread pattern. All tested tires were new, with no signs of wear. The tires selected for tests are commonly used in forest machinery and tractors. These tires, due to comparable external diameters, can be interchangeable in one vehicle. The main parameters of the tested tires are presented in Table 2, while the their tread pattern is presented in Fig. 2.
Table 2 Technical data of tires
|
Tire size manufacturer |
Tread type |
External diameter mm |
Section width mm |
Height of tread lugs, mm |
Maximum load capacity, kg |
Maximum operational inflation pressure, kPa |
|
9.5-24Mitas |
TD02 |
1000 |
241 |
30 |
1120 |
250 |
|
11.2R24 Alliance |
R-1W |
1000 |
285 |
30 |
1215 |
250 |
|
400/55-22.5Trelleborg |
T404GT |
1000 |
400 |
18 |
1120 |
250 |
The experiment was performed for three variants of vertical loads: 4300 N, 6110 N, 7400 N and two levels of inflation pressure: 200 and 80 kPa. For all tires (with each inflation pressure and vertical load configuration), the contact areas were determined statically. The tire footprints on tested grounds were stamped on 10 mm thick layer of dry gypsum, spread out on flexible fabric. The footprints were photographed, and then the contours were drawn based on the photos. The values of contact area were determined from the drawing in AutoCad 2017 Software. Based on obtained contact areas and vertical loads, average ground contact pressures were calculated. For all tires and operational parameters configuration, each test was repeated 5 times. From the obtained results, the mean values of analyzed parameters were calculated.
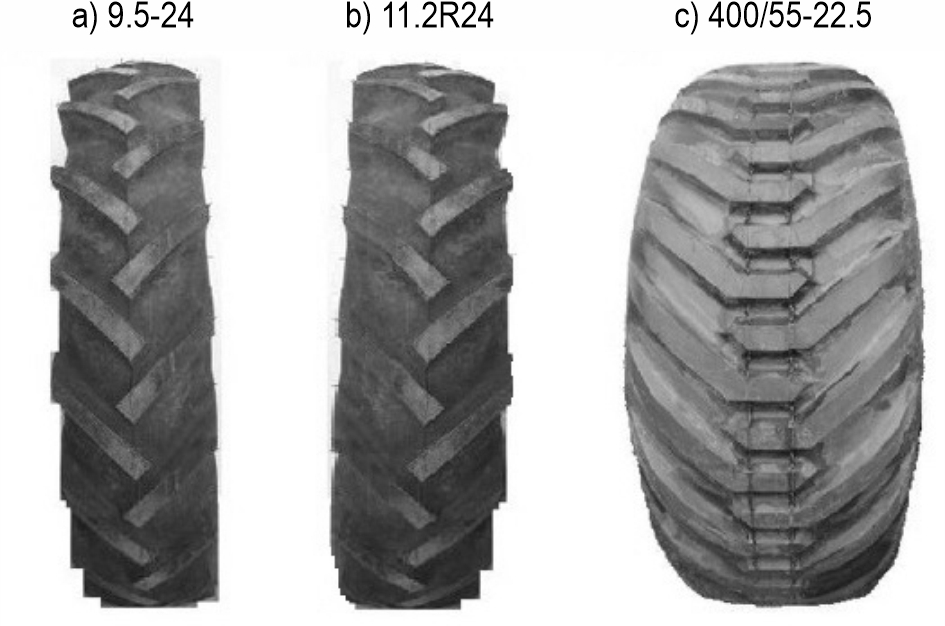
Fig. 2 Overall view of tires tread patterns
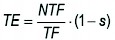
Based on the measured parameters, slip of the tested wheels and values of traction force, rolling resistance and tractive efficiency were calculated using Eq. 1–4:
 (1)
(1)
 (2)
(2)
 (3)
(3)
 (4)
(4)
Where:
s wheel slip
dr actual wheel distance, m
dt theoretical wheel distance, m
TF traction force, N
Mo wheel torque, Nm
rd wheel dynamic radius (determined based on the measured distance covered by the wheel during five full rotations), m
RR rolling resistance, N
NTF net traction force, N
TE tractive efficiency.
The obtained results were statistically analyzed using the Statistica 13.0 software. After verification of applicability conditions (normality of distribution – Shapiro-Wilk test and homogeneity of variance – Levene test), the analysis of variance was carried out; the significance level was 0.05. Moreover, the post-hoc tests (Tukey's test) were used with the aim of assessing the differences between the separate levels of factors. Statistical analysis was conducted separately for each tested tire.
3. Results
3.1 Contact Area and Contact Pressure
Fig. 3 shows the contact areas of the tested tires with the ground for all analyzed inflation pressures and vertical loads. The smallest contact area was measured for 9.5-24 tire, and the largest for the 400/55-22.5 tire. The difference between the contact areas of the tires with the same tread pattern (9.5-24 and 11.2R24) was comparable to the width difference of these tires and was equal to 16–19%. The contact area of the 400/55-22.5 tire was larger by 70% and 100% than that of the 11.2R24 and 9.5-24 tires, respectively. Based on the width of the tires, these differences should be 40 and 66%, respectively. Differences in contact area between the tires remained constant regardless of used vertical load and inflation pressure. As a result of the increase in tire load from 4300 to 6110 N, there was a comparable increase of approximately 10% in contact area. When the load was changing from 6110 to 7400 N, a 5% increase in contact area was observed. The increase in contact area was proportional to the load increase, and the same tendency was observed at both inflation pressures. Regardless of tire load, reducing the inflation pressure resulted in the increase of the contact area by 9% for 9.5-24 and 7% for 400/55-22.5 tire. In the case of radial tire, a 7–11% increase in the contact area was observed – the largest was at a 7400 N load.
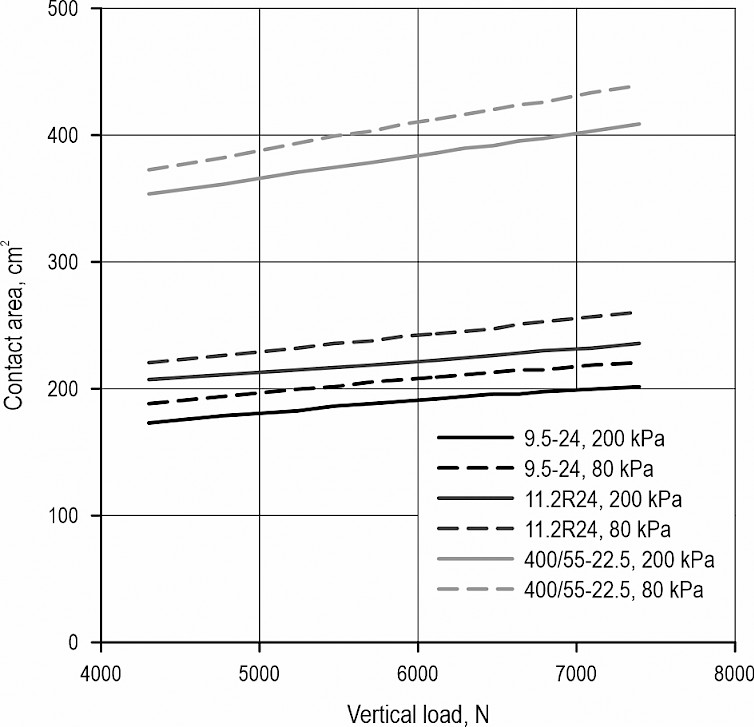
Fig. 3 Tire-ground contact areas for all vertical load/inflation pressure configurations
Due to the fact that the relationships between the vertical load and contact area were linear, the analysis of regression was evaluated (separately for each tire/inflation pressure combination) and the results are presented in Table 3. In all cases high values of coefficient of determination and r-Pearson coefficient were observed. Moreover, values of slope coefficient for the 400/55-22.5 tire were higher than for 9.5-24 and 11.2R24 tires. It meant higher increase rate of contact area due to the increase in vertical load.
Table 3 Results of regression analysis between vertical load and contact area
|
Tire/pressure |
Regression equation |
Coefficient of determination |
Coefficient of correlation (r-Pearson) |
|
9.5-24; 200 kPa |
y = 0.009x + 134.5 |
0.966 |
0.983 |
|
9.5-24; 80 kPa |
y = 0.010x + 144.0 |
0.974 |
0.987 |
|
11.2R24; 200 kPa |
y = 0.009x + 167.7 |
0.987 |
0.993 |
|
11.2R24; 80 kPa |
y = 0.013x + 165.1 |
0.994 |
0.997 |
|
400/55-22.5; 200 kPa |
y = 0.018x + 274.5 |
0.996 |
0.998 |
|
400/55-22.5; 80 kPa |
y = 0.021x + 281.2 |
0.996 |
0.998 |
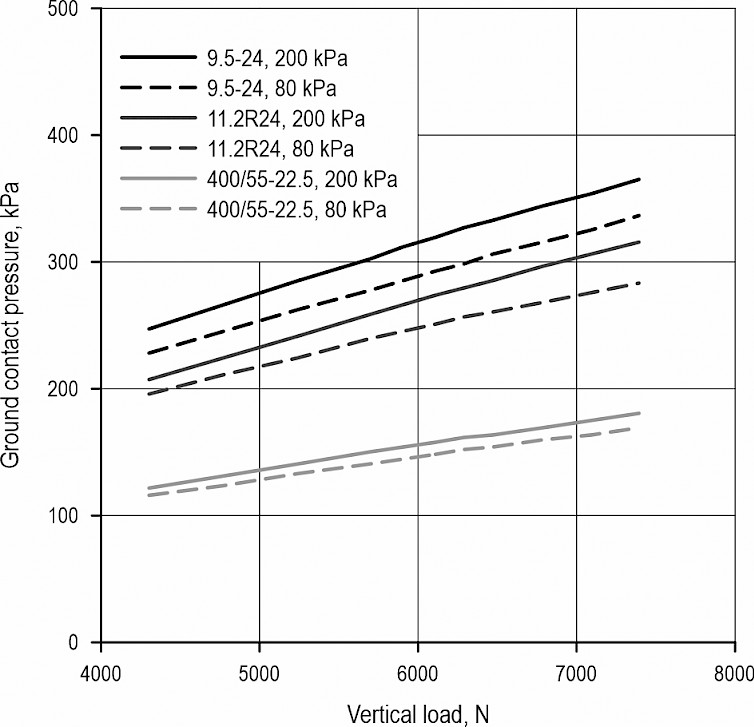
Fig. 4 Average contact pressure exerted on ground by tested tires for all vertical load/inflation pressure configurations
In order to determine the potential impact of the tested tires on the forest ground, average contact pressures were determined (Fig. 4). The pressure exerted by the 9.5-24 tire ranged fron 230–365 kPa, while that of the 11.2R24 and 400/55-22.5 tires was by 17 and 100% lower, respectively. The increase in tire load from 4300 to 6110 N resulted in a 30% increase in ground pressure values, and further tire loading contributed to a 15% increase in the value of this parameter. Reducing tire inflation pressure caused a 6–10% reduction in ground pressure, the smallest decreases concerned the 400/55-22.5 tire. Results of regression analysis are shown in Table 4 – in all cases the values of determination coefficient were at least 0.98; higher values of slope coefficient were observed for the tires with low width (9.5-24 and 11.2R24).
Table 4 Results of regression analysis between vertical load and ground contact pressure
|
Tire/pressure |
Regression equation |
Coefficient of determination |
Coefficient of correlation (r-Pearson) |
|
9.5-24; 200 kPa |
y = 0.038x + 86.7 |
0.991 |
0.995 |
|
9.5-24; 80 kPa |
y = 0.035x + 80.3 |
0.996 |
0.998 |
|
11.2R24; 200 kPa |
y = 0.035x + 60.9 |
0.992 |
0.995 |
|
11.2R24; 80 kPa |
y = 0.029x + 73.8 |
0.984 |
0.976 |
|
400/55-22.5; 200 kPa |
y = 0.019x + 39.1 |
0.983 |
0.991 |
|
400/55-22.5; 80 kPa |
y = 0.017x + 41.9 |
0.985 |
0.992 |
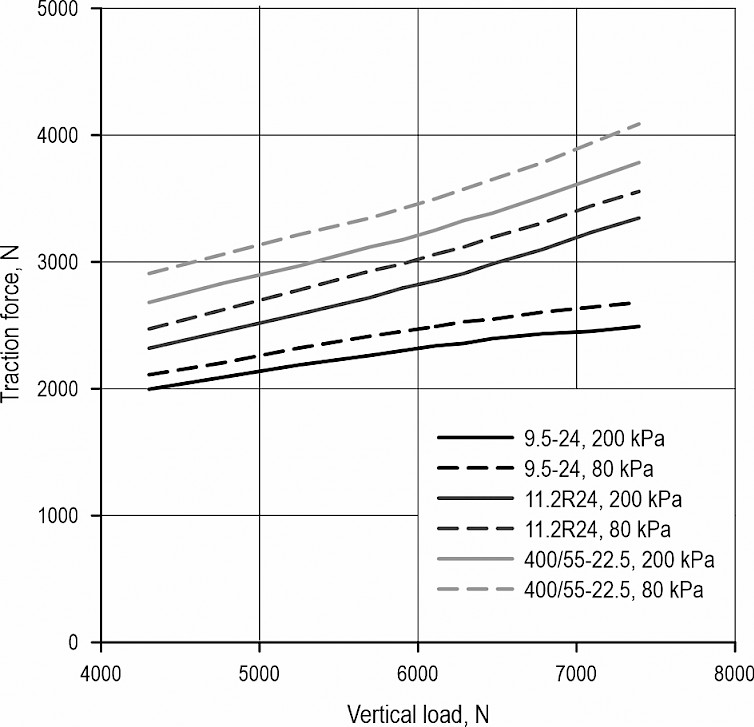
Fig. 5 Relationship between traction force, vertical load and inflation pressure of tested tires
Fig. 5 shows the average values of the traction force of the tested tires obtained at the slip less than 30% (this slippage range guarantees high tractive efficiency). The lowest values of traction force were observed for 9.5-24 tire. For this tire, at a vertical load of 7400 N and inflation pressure of 80 kPa, the traction force was 2680 N (34% higher than that obtained at 200 kPa/4300 N configuration). The 400/55-22.5 tire had such traction force at the lowest load level and an inflation pressure of 200 kPa. The traction force values of the 11.2R24 tire were about 15% lower than those obtained for the 400/55-22.5 tire. Increasing the load of the 11.2R24 and 400/55-22.5 tires resulted in a 15–20% increase in traction force; the increase of the 9.5-24 tire was smaller - 8–18%. Reduction of inflation pressure, regardless of the load level, for all tested tires resulted in a 6–8% increase in traction force.
Table 5 presents the results of regression analysis between vertical load and traction force. There is a difference between values of slope coefficient for 9.5-24 and two other tires: for 9.5-24 slope, the coefficient was lower. The values of determination coefficient were in the range 0.9–0.99.
Table 5 Results of regression analysis between vertical load and traction force
|
Tire/pressure |
Regression equation |
Coefficient of determination |
Coefficient of correlation (r-Pearson) |
|
9.5-24; 200 kPa |
y = 0.158x + 1335.6 |
0.981 |
0.990 |
|
9.5-24; 80 kPa |
y = 0.186x + 1320.5 |
0.992 |
0.995 |
|
11.2R24; 200 kPa |
y = 0.332x + 871.1 |
0.992 |
0.995 |
|
11.2R24; 80 kPa |
y = 0.345x + 982.9 |
0.979 |
0.989 |
|
400/55-22.5; 200 kPa |
y = 0.351x + 1152.1 |
0.978 |
0.989 |
|
400/55-22.5; 80 kPa |
y = 0.376x + 1253.8 |
0.991 |
0.995 |
Fig. 6 shows the relationship between operational parameters (pressure, load) and rolling resistance of the tested tires. The 9.5-24 tire showed the lowest rolling resistance, and the 400/55-22.5 tire the largest. The tendency of changes in rolling resistance (for both levels of inflation pressure) was the same as in the case of tire-ground contact area – increase proportional to the tire load increase. Differences in rolling resistance values between the tested tires increased with the increase of the load; the lowest (10%) increase in the rolling resistance due to the increase of the load was observed for 9.5-24 tire. Lowering the inflation pressure of 9.5-24 tire caused an 8-10% increase in rolling resistance; for 11.2R24 tire this increase was in the range of 10–13%. In the case of 400/55-22.5 tire, the reduction of inflation pressure increased the rolling resistance by 7–13%; the differences decreased as the load increased. Based on regression analysis (table 6), it can be concluded that the smallest values of the slip coefficient were observed in the case of 9.5-24 tire. It means that the low rate of increase of rolling resistance is an effect of vertical load increase.
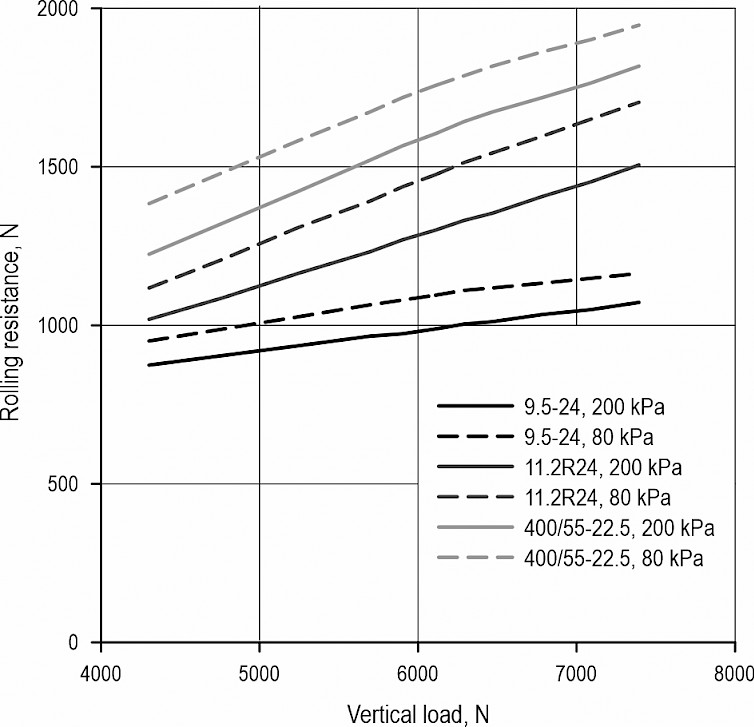
Fig. 6 Relationship between the rolling resistance, vertical load and inflation pressure of tested tires
Table 6 Results of regression analysis between vertical load and rolling resistance
|
Tire/pressure |
Regression equation |
Coefficient of determination |
Coefficient of correlation (r-Pearson) |
|
9.5-24; 200 kPa |
y = 0.064x + 596.8 |
0.974 |
0.986 |
|
9.5-24; 80 kPa |
y = 0.067x + 668.6 |
0.922 |
0.959 |
|
11.2R24; 200 kPa |
y = 0.158x + 336.0 |
0.984 |
0.991 |
|
11.2R24; 80 kPa |
y = 0.191x + 293.6 |
0.992 |
0.995 |
|
400/55-22.5; 200 kPa |
y = 0.194x + 395.8 |
0.980 |
0.989 |
|
400/55-22.5; 80 kPa |
y = 0.185x + 600.9 |
0.981 |
0.990 |
Fig. 7 shows the tractive efficiency and slip characteristics as a function of net traction force for the applied vertical load/inflation pressure configuration. The net traction force that could be achieved was significantly dependent on the contact area between the tire and ground; the greater width of the tire – the higher net traction force. Both the load increase and the tire pressure reduction resulted in the increase in net traction force. The crossing point of the tractive efficiency curves with the slippage curves defines the limits of economic tire exploitation. When this point is exceeded, it is possible to achieve high net traction force, but at low tractive efficiency, it means high energy loss. It was found that the increase in load and lowered inflation pressure caused a drop of slip and also increased the range of net traction force corresponding to maximum tractive efficiency. For 9.5-24 tire at 4300 N load and 200 kPa inflation pressure, the intersection point of slip and tractive efficiency curves corresponded to net traction force of about 1400 N, while at 7400 N and 80 kPa this point occurred at net traction force of 2300 N. For the 11.2R24 tire, at the lowest load variant and inflation pressure of 200 kPa, the intersection was at 1600 N, while for the highest load and low tire inflation pressure, the intersection corresponded to net traction force of 2750 N. In the case of 400/55-22.5 tire, the limit of economic exploitation corresponded to net traction force of 2050 and 3100 N, for analogous variants of inflation pressure and load. For all tires and inflation pressure/load configurations, the limit of economic efficiency corresponded to the tractive efficiency of 0.35–0.38. The largest (72%) increase in net traction force, in terms of increased load and inflation pressure reduction, was found for the 11.2R24 tire; for the 9.5-24 and 400/55-22.5 tires, it was lower and was 64 and 50%, respectively.
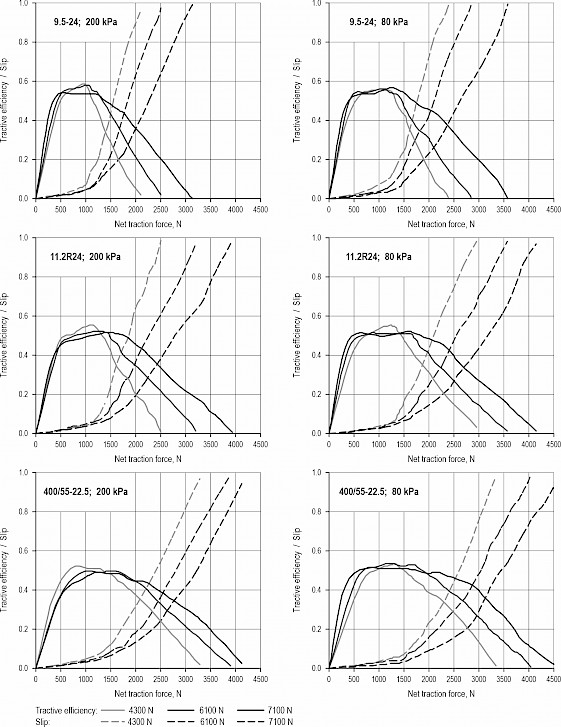
Fig. 7 Descriptive relationship between tractive efficiency, slip and net traction force
Fig. 8 shows the values of the optimum net traction force (obtained at maximum tractive efficiency). The lowest values of this parameter were obtained for the 9.5-24 tire, the highest for the 400/55-22.5 tire. With a load of 4300 N and inflation pressure of 200 kPa, the optimum net traction force of the 11.2R24 and 400/55-22.5 tires was higher than for the 9.5-24 tire by 16 and 34%, respectively. The increase of tire load at 200 kPa resulted in increased differences in optimal net traction force between the 9.5-24 and 400/55-22.5 tires and their reduction between the 11.2R24 and 400/55-22.5 tires. At 80 kPa inflation pressure, the difference in optimal net traction force between cross-ply tires was almost the same as at 200 kPa. For the 11.2R24 tire, the optimal net traction force was less than for the 400/55-22.5 tires by 6–7%, regardless of the load level. Increasing the tire load from 4300 N to 6110 N for cross-ply tires resulted in higher increase (by about 10%) of the optimal net traction at 80 kPa than at 200 kPa. In the case of a radial tire at both inflation pressure levels, increasing the load from 4300 to 6110 N resulted in a 20% increase in the optimum net traction force. Increasing the tire load to 7400 N caused a comparable increase in optimum net traction force at both inflation pressure levels, for 9.5-24 tire by about 10%, and for 11.2R24 and 400/55-22.5 tires by about 15%.
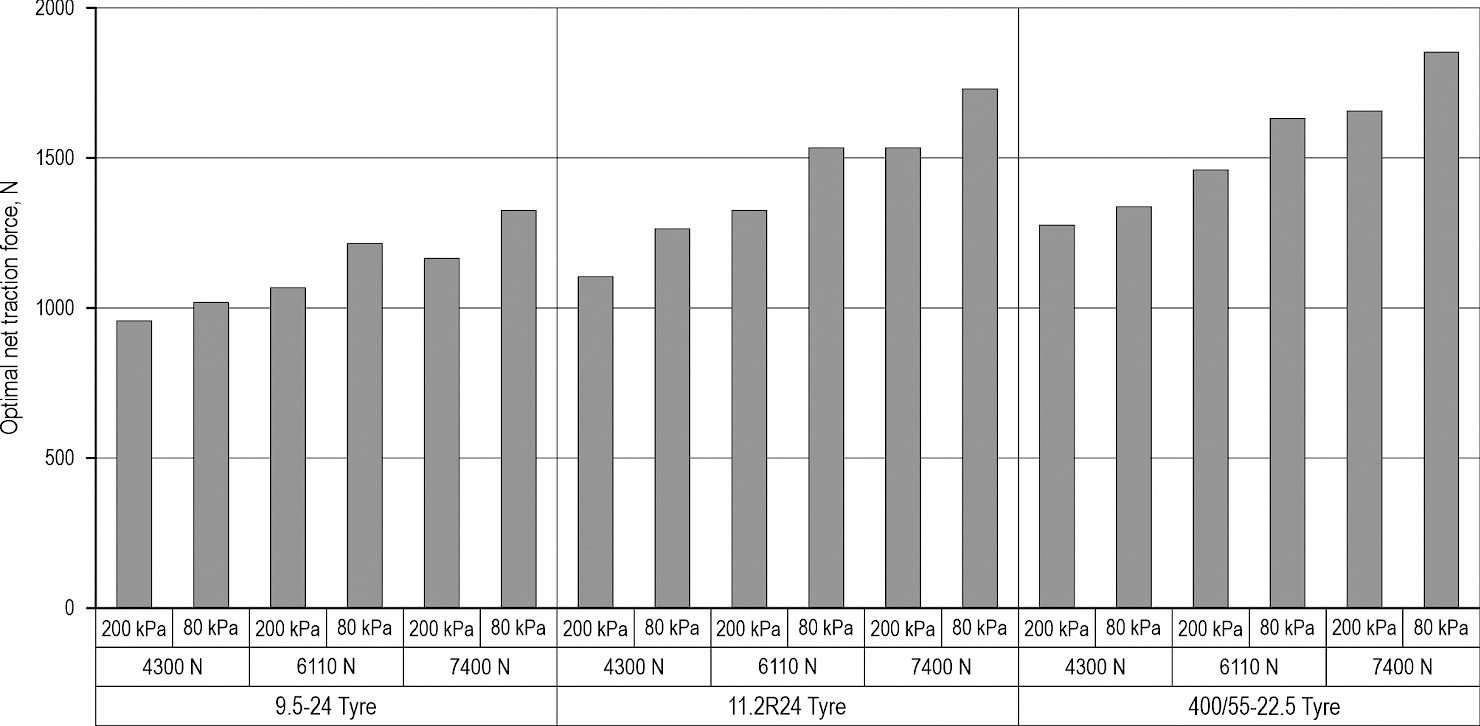
Fig. 8 Optimal net traction force of tested tires, for all vertical load/inflation pressure configurations
Fig. 9 shows the values of the maximum tractive efficiency of the tested tires obtained at applied levels of vertical load and inflation pressure. The highest values of tractive efficiency (0.53–0.59) were obtained for 9.5-24 tire. For the 11.2R24 tire, the maximum tractive efficiency was 0.51–0.55, and for the 400/55-22.5 tire it was in the range of 0.49–0.52. For all tires, there was a slight decrease in the efficiency as a result of increased load. Lowering the inflation pressure caused the reduction of the traction efficiency of the 9.5-24 tire; the other tires showed no significant changes in values of the analysed parameter. The 9.5-24 tire was most prone to changes in tractive efficiency as a result of changing operational parameters; the 400/55-22.5 tire was the most stable.

Fig. 9 Maximum tractive efficiency of tested tires for all load/inflation pressure configurations
Based on statistical analysis of the 9.5-24 tire (Table 7), it can be stated that both the inflation pressure and vertical load had significant influence on all analyzed parameters. The Tukey's post-hoc tests showed that in most of cases each vertical load level was separately classified in homogeneous groups (significant differences between them were observed). The exception was observed for maximum tractive efficiency – in this case there were no differences between 4300 and 6110 N vertical loads.
Table 7 Results of statistical analysis for 9.5-24 tire
|
Analyzed parameter |
Inflation pressure |
Vertical load |
Mean1 |
±SD |
p-value2 for inflation pressure |
p-value2 for vertical load |
|
Contact area, m2 |
200 kPa |
4300 N |
0.0174A |
0.0002 |
<0.00001 |
<0.00001 |
|
6110 N |
0.0191B |
0.0003 |
||||
|
7400 N |
0.0202C |
0.0006 |
||||
|
80 kPa |
4300 N |
0.0189A |
0.0001 |
|||
|
6110 N |
0.0208B |
0.0004 |
||||
|
7400 N |
0.0220C |
0.0003 |
||||
|
Traction force, N |
200 kPa |
4300 N |
2001A |
51 |
<0.00001 |
<0.00001 |
|
6110 N |
2340B |
41 |
||||
|
7400 N |
2487C |
38 |
||||
|
80 kPa |
4300 N |
2113A |
39 |
|||
|
6110 N |
2484B |
47 |
||||
|
7400 N |
2684C |
46 |
||||
|
Rolling resistance, N |
200 kPa |
4300 N |
872A |
17 |
0.00001 |
<0.00001 |
|
6110 N |
986B |
30 |
||||
|
7400 N |
1073C |
38 |
||||
|
80 kPa |
4300 N |
952A |
35 |
|||
|
6110 N |
1092B |
32 |
||||
|
7400 N |
1164C |
47 |
||||
|
Optimal net traction force, N |
200 kPa |
4300 N |
953A |
32 |
0.00001 |
<0.00001 |
|
6110 N |
1063B |
41 |
||||
|
7400 N |
1163C |
42 |
||||
|
80 kPa |
4300 N |
1020A |
25 |
|||
|
6110 N |
1211B |
22 |
||||
|
7400 N |
1330C |
35 |
||||
|
Maximum tractive efficiency |
200 kPa |
4300 N |
0.59A |
0.004 |
0.00003 |
0.00014 |
|
6110 N |
0.58A |
0.010 |
||||
|
7400 N |
0.55B |
0.011 |
||||
|
80 kPa |
4300 N |
0.55A |
0.010 |
|||
|
6110 N |
0.54A |
0.007 |
||||
|
7400 N |
0.53B |
0.011 |
||||
|
SD – standard deviation; p-value – probability level 1 the same letters (A, B, C) mean the same homogenous group 2 when the p-value is higher than significance level (0.05), the factor is not significant |
||||||
For the 11.2R24 tire (Table 8), it can be observed that the inflation pressure was a significant factor for all analyzed parameters except for maximum tractive efficiency; the vertical load of the wheel had significant influence on all analyzed parameters. The post-hoc tests showed the lack of significant differences between maximum values of tractive efficiency at vertical load of 6110 and 7400 N. In other cases, each vertical load level was classified into a separate group.
Table 8 Results of statistical analysis for 11.2R24 tire
|
Analyzed parameter |
Inflation pressure |
Vertical load |
Mean1 |
±SD |
p-value2 for inflation pressure |
p-value2 for vertical load |
|
Contact area, m2 |
200 kPa |
4300 N |
0.0207A |
0.0004 |
<0.00001 |
<0.00001 |
|
6110 N |
0.0223B |
0.0006 |
||||
|
7400 N |
0.0235C |
0.0006 |
||||
|
80 kPa |
4300 N |
0.0220A |
0.0005 |
|||
|
6110 N |
0.0243B |
0.0005 |
||||
|
7400 N |
0.0261C |
0.0006 |
||||
|
Traction force, N |
200 kPa |
4300 N |
2314A |
40 |
<0.00001 |
<0.00001 |
|
6110 N |
2858B |
41 |
||||
|
7400 N |
3347C |
42 |
||||
|
80 kPa |
4300 N |
2479A |
49 |
|||
|
6110 N |
3067B |
41 |
||||
|
7400 N |
3551C |
45 |
||||
|
Rolling resistance, N |
200 kPa |
4300 N |
1018A |
28 |
<0.00001 |
<0.00001 |
|
6110 N |
1300B |
32 |
||||
|
7400 N |
1503C |
33 |
||||
|
80 kPa |
4300 N |
1119A |
20 |
|||
|
6110 N |
1477B |
22 |
||||
|
7400 N |
1700C |
33 |
||||
|
Optimal net traction force, N |
200 kPa |
4300 N |
1106A |
36 |
<0.00001 |
<0.00001 |
|
6110 N |
1321B |
33 |
||||
|
7400 N |
1528C |
23 |
||||
|
80 kPa |
4300 N |
1260A |
30 |
|||
|
6110 N |
1531B |
31 |
||||
|
7400 N |
1734C |
35 |
||||
|
Maximum tractive efficiency |
200 kPa |
4300 N |
0.55A |
0.006 |
0.13917 |
<0.00001 |
|
6110 N |
0.52B |
0.010 |
||||
|
7400 N |
0.51B |
0.011 |
||||
|
80 kPa |
4300 N |
0.55A |
0.009 |
|||
|
6110 N |
0.51B |
0.009 |
||||
|
7400 N |
0.51B |
0.008 |
||||
|
SD – standard deviation; p-value – probability level 1 the same letters (A, B, C) mean the same homogenous group 2 when the p-value is higher than significance level (0.05), the factor is not significant |
||||||
Based on the results of statistical analysis for the 400/55-22.5 tire (Table 9), it can be stated that both vertical load and inflation pressure had no significant influence on maximum tractive efficiency. A significant impact was observed in other parameters – in these cases the post-hoc tests showed significant differences between each vertical load level.
Table 9 Results of statistical analysis for 400/55-22.5 tire
|
Analyzed parameter |
Inflation pressure |
Vertical load |
Mean1 |
±SD |
p-value2 for inflation pressure |
p-value2 for vertical load |
|
Contact area, m2 |
200 kPa |
4300 N |
0.0353A |
0.0005 |
<0.00001 |
<0.00001 |
|
6110 N |
0.0386B |
0.0004 |
||||
|
7400 N |
0.0408C |
0.0004 |
||||
|
80 kPa |
4300 N |
0.0372A |
0.0006 |
|||
|
6110 N |
0.0412B |
0.0005 |
||||
|
7400 N |
0.0439C |
0.0005 |
||||
|
Traction force, N |
200 kPa |
4300 N |
2680A |
51 |
0.00239 |
<0.00001 |
|
6110 N |
3256B |
44 |
||||
|
7400 N |
3775C |
50 |
||||
|
80 kPa |
4300 N |
2900A |
40 |
|||
|
6110 N |
3489B |
41 |
||||
|
7400 N |
4079C |
50 |
||||
|
Rolling resistance, N |
200 kPa |
4300 N |
1221A |
32 |
<0.00001 |
<0.00001 |
|
6110 N |
1602B |
36 |
||||
|
7400 N |
1818C |
28 |
||||
|
80 kPa |
4300 N |
1381A |
29 |
|||
|
6110 N |
1760B |
39 |
||||
|
7400 N |
1930C |
13 |
||||
|
Optimal net traction force, N |
200 kPa |
4300 N |
1281A |
25 |
<0.00001 |
<0.00001 |
|
6110 N |
1457B |
25 |
||||
|
7400 N |
1662C |
20 |
||||
|
80 kPa |
4300 N |
1337A |
25 |
|||
|
6110 N |
1634B |
38 |
||||
|
7400 N |
1852C |
37 |
||||
|
Maximum tractive efficiency |
200 kPa |
4300 N |
0.51A |
0.016 |
0.48304 |
0.46717 |
|
6110 N |
0.49B |
0.012 |
||||
|
7400 N |
0.49C |
0.007 |
||||
|
80 kPa |
4300 N |
0.50A |
0.006 |
|||
|
6110 N |
0.50B |
0.009 |
||||
|
7400 N |
0.40C |
0.013 |
||||
|
SD – standard deviation; p-value – probability level 1 the same letters (A, B, C) mean the same homogenous group 2 when the p-value is higher than significance level (0.05), the factor is not significant |
||||||
4. Discussion
On the tested trail with high soil penetration resistance and high shearing stress strength, the driving force was generated by the friction force to a larger extent than by soil shearing caused by tire tread lugs. Therefore, the contact area between the ground and tires played a major role in the transmission of the traction force. Our results showed that the increase in wheel load results in the increase of the contact area. The higher the vertical load acting on the wheel, the bigger is the resistance force of the tire, acting in the opposite direction. This phenomenon results in tire deflection that affects the contact area. This process is confirmed by Schjønning et al. (2008) and Kormanek and Dvořak (2021). In terms of the influence of the tire pressure on contact area, it has been shown that a lower inflation pressure results in increased contact area between the tire and the soil. The same relationship has also been observed by Keller et al. (2004). Diserens (2009) explored a wide range of tires and reported contradictory results for the effect of inflation pressure on the contact area. Finally, he concluded that inflation pressure had negligible effect on the contact area. Determination of the contact area between the tire and soil plays an important role both for the intensity of soil compaction and also other wheel-soil interactions. Effects of inflation pressure and dynamic load on soil compaction for a forwarder tire were investigated by Eliasson (2005). In his study on forwarder tires of 300, 450, 600 kPa inflation pressure, it has been shown that rut depth and soil compaction were not significantly affected by the tire inflation pressure. Differentiation of the tested tires in terms of width, tread and contact area was reflected in the values of analyzed traction parameters. Both increasing the vertical load and lowering the inflation pressure resulted in the increase in net traction force, but also led to the increase in rolling resistance. Our results are in line with the results obtained by Janulevicius et al. (2015) and Battiato and Diserens (2017), who showed that the lowering inflation pressure produced an improvement of drawbar pull and increase in wheel load, which resulted in a higher net traction force. According to the present study, the value of net traction force increases both as a result of increased load and lowered inflation pressure. These results are in line with the results of Taghavifar and Mardani (2013) conducted in soil bin on firm soil for three inflation pressure levels of 100, 200, 300 kPa and 5 load levels (from 1000 to 5000 N). They also showed that the smallest changes in rolling resistance have occurred at the lowest wheel load due to the reduction of inflation pressure. Also, in similar studies conducted by Elwaleed et al. (2006), lowering of tire inflation pressure by 55 kPa caused the increase in rolling resistance by 9.9% which further supports the experimental results obtained in the presented studies. Gharibkhani et al. (2012) showed that, at constant level of soil compaction, the rolling resistance was found to increase within the increase in vertical load, and at all tested inflation pressures, the effect of vertical load seems to be similar. Research has shown that both loading and reduction of inflation pressure contributed to the decrease in slippage of tires. A clear effect of reduction of tire inflation pressure on tractive efficiency has not been demonstrated; 9.5-24 and 11.2R24 tires reacted with a drop in tractive efficiency and the 400/55-22.5 tire with slight increase. The differences in maximum tractive efficiency were statistically significant only for the 9.5-24 tire. A slight decrease in tractive efficiency has also been shown due to the increase of the tire load; statistically significant differences were found for 9.5-24 and 11.2R24 tires. These results are in accordance with the results obtained by Jadhav et al. (2013) in the study conducted on sandy loam soil at stubble field. Their results have shown that the tractive efficiency decreases gradually with the decrease in inflation pressure. Jun et al. (2004), in the study conducted on a firm clay soil showed that net traction force and tractive efficiency of the Trelleborg Twin 421 Mark II 600/55-26.5 forwarder tire increased with the decrease (from 200 to 100 kPa) of inflation pressure at constant dynamic load. They also concluded that, at constant inflation pressure, net traction force and tractive efficiency increased with increasing dynamic load. Ekinci et al. (2015), in the study on 7.50R18 tires tested on stubble field with soil cone index of 2.64 MPa, showed that the net traction force increased as slip increased. Depending on increased dynamic axle load, the average tractive efficiency values increased by 6%. When inflation pressure was reduced, the tractive efficiency increased. These results are only partially in accordance with the results obtained in the present study. No increase in traction efficiency as a result of lowering the inflation pressure or increasing the tire load can be explained by soil conditions. On hard soil (penetration resistance of 3.58 MPa), the wheel does not have the tendency to sink. Increase in contact area between the tires and soil resulted in comparable increase both in net traction force and rolling resistance.
5. Conclusions
This study described traction properties of the wheels designed for forestry machines and their impact on forestry soil. The aim was to evaluate the operational parameters of tires on traction performance and the impact on soil. Based on the obtained results, the following conclusions were made:
Design features and dimensions have a significant impact on tire behaviour. The 400/55-22.5 tire had the best tractive performance, it developed the highest traction force in the range of economical operation (high traction efficiency, low slippage). In addition, the largest width allowed to obtain the lowest pressure on the ground. The radial 11.2R24 tire was the intermediate solution between the classic cross-ply agricultural tire and the forest tire. In terms of traction properties, this tire was closer to 400/55-22.55, as the generated ground pressure was more similar to the 9.5-24 tire.
Both the load increase and the tire pressure reduction resulted in increased net traction force of 35% and 16%, respectively, and a decrease in slippage with no or slight decrease in tractive efficiency. The increased contact area due to increased load did not compensate for the added ballast, which resulted in increased ground pressure.
Taking into account both traction abilities and impact on the forest ground, the best solution is to use the tires with the largest possible width, which guarantees the lowest losses in the wheel-ground interaction.
6. References
Agherkakli, B., Najafi, A., Sadeghi, S., 2010: Ground based operation effects on soil disturbance by steel tracked skidder in a steep slope of forest. J. For. Sci. 56(6): 278–284. https://doi.org/10.17221/93/2009-JFS
Alakukku, L., Weisskopf, P., Chamen, W.C., Tijink, F.G., Van der Linden, J., Pires, S., Sommer, C., Spoor, G., 2003: Prevention strategies for field traffic-induced subsoil compaction: a review. Part 1. Machine/soil interactions. Soil Tillage Res.73(1–2): 145–160. https://doi.org/10.1016/S0167-1987(03)00107-7
Ampoorter, E., Goris, R., Cornelis, W.M., Verheyen, K., 2007: Impact of mechanized logging on compaction status of sandy forest soils. For. Ecol. Manag. 241(1–3): 162–174. https://doi.org/10.1016/j.foreco.2007.01.019
Barbosa, L.A.P., Magalhaes, P.S.G., 2015: Tire tread pattern design trigger on the stress distribution over rigid surfaces and soil compaction. J. Terramech. 58: 27–38. https://doi.org/10.1016/j.jterra.2014.12.006
Battiato, A., Diserens, E., 2017: Tractor traction performance simulation on differently textured soils and validation: A basic study to make traction and energy requirements accessible to the practice. Soil Tillage Res. 166: 18–32. https://doi.org/10.1016/j.still.2016.09.005
Berli, M., Kulli, B., Attinger, W., Keller, M., Leuenberger, J., Flühler, H., Springman, S.M., Schulin, R., 2003: Compaction of Agricultural and forest soils by tracked heavy construction machinery. Soil Tillage Res. 75(1): 37–52. https://doi.org/10.1016/S0167-1987(03)00160-0
Buckley, D.S., Crow, T.R., Nauertz, E.A., Schulz, K.E., 2003: Influence of skid trails and haul roads on understorey plant richness and composition in managed forest landscapes in Upper Michigan, USA. For. Ecol. Manag. 175(1–3): 509–520. https://doi.org/10.1016/S0378-1127(02)00185-8
Bygdén, G., Eliasson, L., Wästerlund, I., 2003: Rut depth, soil compaction and rolling resistance when using bogie tracks. J. Terramech. 40(3): 179–190. https://doi.org/10.1016/j.jterra.2003.12.001
Çarman, K., 2002: Compaction characteristics of towed wheels on clay loam in a soil bin. Soil Tillage Res. 65(1): 37–43. https://doi.org/10.1016/S0167-1987(01)00281-1
D'Acqui, L.P., Certini, G., Cambi, M., Marchi, E., 2020: Machinery's impact on forest soil porosity. J. Terramech. 91: 65–71. https://doi.org/10.1016/j.jterra.2020.05.002
Damanauskas, V., Janulevičius, A., 2015: Differences in tractor performance parameters between single-wheel 4WD and dual-wheel 2WD driving systems. J. Terramech. 60: 63–73. https://doi.org/10.1016/j.jterra.2015.06.001
Damanauskas, V., Janulevičius, A., Pupinis, G., 2015: Influence of extra weight and tire pressure on fuel consumption at normal tractor slippage. J. Agric. Sci. 7(2): 55–67. http://dx.doi.org/10.5539/jas.v7n2p55
Diserens, E., 2009: Calculating the contact area of trailer tires in the field. Soil Tillage Res. 103(2): 302–309. https://doi.org/10.1016/j.still.2008.10.020
Ekinci, S., Çarman, K., Kahramanlı, H., 2015: Investigation and modelling of the tractive performance of radial tires using off-road vehicles. Energy 93: 1953–1963. https://doi.org/10.1016/j.energy.2015.10.070
Eliasson, L., 2005: Effects of forwarder tire pressure on rut formation and soil compaction. Silva Fenn. 39(4): 549–557. https://doi.org/10.14214/sf.366
Eliasson, L., Wasterlund, I., 2007: Effects of slash reinforcement of strip roads on rutting and soil compaction on a moist fine-grained soil. For. Ecol. Manag. 252(1–3): 118–123. https://doi.org/10.1016/j.foreco.2007.06.037
Elwaleed, A.K., Yahya, A., Zohadie, M., Ahmad, D., Kheiralla, A.F., 2006: Effect of inflation pressure on motion resistance ratio of a high–lug agricultural tire. J. Terramech. 43(2): 69–84. https://doi.org/10.1016/j.jterra.2004.08.006
Flores Fernandez, J.L., Rubin, L., Hartmann, P., Puhlmann, H., von Wilpert, K., 2019: Initial recovery of soil structure of a compacted forest soil can be enhanced by technical treatments and planting. For. Ecol. Manag. 431: 54–62. https://doi.org/10.1016/j.foreco.2018.04.045
Ganatsios, H.P., Tsioras, P.A., Papaioannou, A.G., Blinn, C.R., 2021: Short term impacts of harvesting operations on soil chemical properties in a Mediterranean Oak ecosystem. Croat. j. for. eng.42(3): 463–476. https://doi.org/10.5552/crojfe.2021.1100
Gelin, O., Björheden, R., 2020: Concept evaluations of three novel forwarders for gentler forest operations. J. Terramech. 90: 49–57. https://doi.org/10.1016/j.jterra.2020.04.002
Gharibkhani, M., Mardani, A., Vesali, F., 2012: Determination of wheel–soil rolling resistance of agricultural tire. Aust. J. Agric. Res. 3(1): 6–11.
Gomez, A., Powers, R.F., Singer, M.J., Horwath, W.R., 2002: Soil compaction effects on growth of young ponderosa pine following litter removal in California's Sierra Nevada. Soil Sci. Soc. Am. J. 66(2): 1334–1343. https://doi.org/10.2136/sssaj2002.1334
Grečenko, A., Prikner, P., 2014: Tire rating based on soil compaction capacity. J. Terramech. 52: 77–92. https://doi.org/10.1016/j.jterra.2013.08.001
Grigorev, I., Kunickaya, O., Tikhonov, E., Hertz, E., Druzyanova, V., Timokhova, O., Ivanov, V., Kruchinin, I., 2022: Dynamic impact of wheeled skidders on forest soil in felling areas. J. Terramech. 101: 1–9. https://doi.org/10.1016/j.jterra.2022.02.001
Heinimann, H., 2007: Forest operations engineering and management – the ways behind and ahead of a scientific discipline. Croat. j. for. eng. 28(1): 107–121.
Horn, R., Vossbrink, J., Peth, S., Becker, S., 2007: Impact of modern forest vehicles on soil physical properties. For. Ecol. Manag. 248(1–2): 56–63. https://doi.org/10.1016/j.foreco.2007.02.037
Ismoilov, A., Sellgren, U., Andersson, K., Löfgren, B., 2015: A comparison of novel chassis suspended machines for sustainable forestry. J. Terramech. 58: 59–68. http://dx.doi.org/10.1016/j.jterra.2015.01.002
Jadhav, P.P., Sharma, A.K., Wandkar, S.V., Gholap, B.S., 2013: Study of tractive efficiency as an effect of ballast and tire inflation pressure in sandy loam soil. Agric. Eng. Int.: CIGR J. 15(2): 60–67.
Janulevičius, A., Damanauskas V., 2022: Prediction of tractor drive tire slippage under different inflation pressures. J. Terramech. 101: 23–31. https://doi.org/10.1016/j.jterra.2022.03.001
Jun, H., Way, T.R., Löfgren, B., Landström, M., Bailey, A.C., Burt, E.C., McDonald, T.P., 2004: Dynamic load and inflation pressure effects on contact pressures of a forestry forwarder tire. J. Terramech. 41(4): 209–222. https://doi.org/10.1016/j.jterra.2004.03.002
Karpman, E., Huang, W., Kövecses, J., Teichmann, M., 2022: Speed-made-good: Mobility map generation for wheeled vehicles on softterrain. J. Terramech. 101: 11–22. https://doi.org/10.1016/j.jterra.2022.01.003
Keller, T., 2004: Soil compaction and soil tillage – studies in agricultural soil mechanics. ACTA Agraria 489, Swedish University of Agricultural Sciences.
Kiss, P., 2009: Determination of Rolling Resistance Components. Járművek és Mobilgépek 1: 237–246.
Kormanek, M., Dvořak, J., 2021: Ground Pressure Changes Caused by MHT 8002HV Crawler Harvester Chassis. Croat. J. For. Eng. 42(2): 201–212. https://doi.org/10.5552/crojfe.2021.844
Kurjenluoma, J., Alakukku, L., Ahokas, J., 2009: Rolling resistance and rut formation by implement tires on tilled clay soil. J. Terramech. 46(6): 267–275. https://doi.org/10.1016/j.jterra.2009.07.002
Lacour, S., Burgun, C., Perilhon, C., Descombes, G., Doyen, V., 2014: A model to assess tractor operational efficiency from bench test data. J. Terramech. 54: 1–18. https://doi.org/10.1016/j.jterra.2014.04.001
Lindo, Z., Visser, S., 2004: Forest floor microarthropod abundance and oribatid mite (Acari: Oribatida) composition following partial and clear-cut harvesting in the mixedwood boreal forest. Can. J. For. Res. 34(5): 998–1006. https://doi.org/10.1139/x03-284
Nam, J.S., Park, Y.J., Kim, K.U., 2010: Determination of rating cone index using wheel sinkage and slip. J. Terramech. 4(4)7: 243–248. https://doi.org/10.1016/j.jterra.2010.02.002
Nieminen, M., Sarkkola, S., Laurén, A., 2017: Impacts of forest harvesting on nutrient, sediment and dissolved organic carbon exports from drained peatlands: A literature review, synthesis and suggestions for the future. For. Ecol. Manag. 392: 13–20. https://doi.org/10.1016/j.foreco.2017.02.046
Patel, S.K., Mani, I., 2011: Effect of multiple passes of tractor with varying normal load on subsoil compaction. J. Terramech. 48(4): 277–284. https://doi.org/10.1016/j.jterra.2011.06.002
Picchio, R., Neri, F., Maesano, M., Savelli, S., Sirna, A., Blasi, S., Baldini, S., Marchi, E., 2011: Growth effects of thinning damage in a Corsican pine (Pinus laricio Poiret) stand in central Italy. For. Ecol. Manag. 262(2): 237–243. https://doi.org/10.1016/j.foreco.2011.03.028
Pryadkin, V., Artemov, A., Kolyadin, P., 2021: Mobile vehicles with extra-low pressure tires in the transport infrastructure of the Arctic region and northern territories of the Russian Federation. Transp. Res. Proc. 57: 502–510. https://doi.org/10.1016/j.trpro.2021.09.078
Schjønning, P., Lamandé, M., Tøgersen, F.A., Arvidsson, J., Keller, T., 2008: Modelling effects of tire inflation pressure on the stress distribution near the soil–tire interface. Biosyst. Eng. 99(1): 199–133. https://doi.org/10.1016/j.biosystemseng.2007.08.005
Šmerda, T., Čupera, J., 2010: Tire inflation and its influence on drawbar characteristics and performance – Energetic indicators of a tractor set. J. Terramech. 47(6): 395–400. https://doi.org/10.1016/j.jterra.2010.02.005
Smith, C.W., 2003: Does soil compaction on harvesting extraction roads affect long-term productivity of Eucalyptus plantations in Zululand, South Africa? South. Afr. For. J. 199: 41–53.
Spinelli, R., Lombardini, C., Magagnotti, N., 2014: The effect of mechanization level and harvesting system on the thinning cost of Mediterranean softwood plantations. Silva Fenn. 48(1): 2–17. https://doi.org/10.14214/sf.1003
Spinelli, R., Magagnotti, N., Laina Relano, R., 2012: An alternative skidding technology to the current use of crawler tractors in Alpine logging operations. J. Clean. Prod. 31: 73–79. https://doi.org/10.1016/j.jclepro.2012.02.033
Stone, D.M., Elioff, J.D., 2000: Soil disturbance and aspen regeneration on clay soils: three case histories. For. Chron. 76(5): 747–752. https://doi.org/10.5558/tfc76747-5
Sümer, S.K., Sabanci, A., 2005: Effects of different tire configurations on tractor performance. Turk. J. Agric. For. 29(6): 461–468.
Šusnjar, M., Horvat, D., Seselj, J., 2006: Soil compaction in timber skidding in winter conditions. Croat. J. For. Eng. 27(1): 3–15.
Taghavifar, H., Mardani, A., 2013: Investigating the velocity, inflation pressure and vertical load on rolling resistance of a radial ply tire. J. Terramech. 50(2): 99–106. http://dx.doi.org/10.1016/j.jterra.2013.01.005
Tan, X., Chang, S.X., Kabzems, R., 2008: Soil compaction and forest floor removal reduced microbial biomass and enzyme activities in a boreal aspen forest soil. Biol. Fertil. Soils 44: 471–479. http://dx.doi.org/10.1007/s00374-007-0229-3
Thees, O., Olschewski, R., 2017: Physical soil protection in forests – insights from production-, industrial- and institutional economics. For. Policy Econ. 80: 99–106. https://doi.org/10.1016/j.forpol.2017.01.024
Toivio, J., Helmisaari, H.S., Palviainen, M., Lindeman, H., Ala-Ilomäki, J., Sirén, M., Uusitalo, J., 2017: Impacts of timber forwarding on physical properties of forest soils in southern Finland. For. Ecol. Manag. 405: 22–30. https://doi.org/10.1016/j.foreco.2017.09.022
Vossbrink, J., Horn, R., 2004: Modern forestry vehicles and their impact on soil physical properties. Eur. J. For. Res. 123: 259–267. http://dx.doi.org/10.1002/jpln.201100075
Wang, J., LeDoux, C.B., Edwards, P., 2007: Changes in soil bulk density resulting from construction and conventional cable skidding using preplanned skid trails. North. J. Appl. For. 24(1): 5–8. https://doi.org/10.1093/njaf/24.1.5
Zoz, F.M., Grisso, R.D., 2003: Traction and tractor performance. ASAE distinguished lecture series (Tractor Design No. 27). ASAE Publication No. 913C0403. St. Joseph, Michigan, ASAE.
© 2023 by the authors. Submitted for possible open access publication under the
terms and conditions of the Creative Commons Attribution (CC BY) license (http://creativecommons.org/licenses/by/4.0/).
Authors' addresses:
Authors' addresses:
Marek Brennensthul, PhD *
e-mail: marek.brennensthul@upwr.edu.pl
Jaroslaw Czarnecki, PhD
e-mail: jaroslaw.czarnecki@upwr.edu.pl
Prof. Włodzimierz Białczyk, PhD
e-mail: wlodzimierz.bialczyk@upwr.edu.pl
Wroclaw University of Environmental and Life Sciences
Faculty of Life Sciences and Technology
Institute of Agricultural Engineering
Chelmonskiego str. 37
51-630, Wroclaw
POLAND
* Corresponding author
Received: September 03, 2020
Accepted: May 05, 2023
Original scientific paper