Comparing Different Replacement Policies for Logging Machines in Brazil
doi: 10.5552/crojfe.2024.2243
volume: 45, issue:
pp: 14
- Author(s):
-
- Diniz Carlos
- Timofeiczyk Junior Romano
- Garzel Joao Carlos
- Robert Renato Cesar Gonçalves
- Sessions John
- da Silva Lopes Eduardo
- Article category:
- Original scientific paper
- Keywords:
- Dynamic programing, equipment replacement problem, minimizing costs, harvester, forwarder
Abstract
HTML
A dynamic programing algorithm to identify schedules that minimize the discounted cost (DC) of logging machines over a planning horizon including gains from technological progress was used. The identified schedules were also compared with three alternative replacement policies derived from the literature and Brazilian forestry companies. The case study used a harvester and a forwarder and a 100-year planning horizon, where the maximum replacement limit was 8 years. To apply the dynamic programing algorithm, it was necessary to generate lists from cash flows, which incorporated the possible replacement combinations of a series of machines according to the length of the planning horizon and the maximum replacement limit. The lists were formed by three descriptors: predecessor node (moment of purchase of the machine), future node (point of sale for the acquisition of a new machine), and arc value (DC information, the mean production cost and mean production). The results show that the DC identified for the series of harvester replacements was higher compared to the forwarder. It was also identified that the harvester's economic life is shorter, and with technological progress, there was a reduction in the economic life of both machines. Technological progress was also responsible for reducing the average production cost and increasing the average production of machines. When comparing the alternative schedules (AS), it was found that, although AS had a higher DC value and mean production costs, there was very little difference between them. In the harvester's case, AS01 had the highest DC value ($4.36 million). By choosing it, the decision maker would bear a DC boost of $54,000, while AS02 and AS03 would trigger an increase of $43,000 and $32,000, respectively. For the forwarder, the schedule with the highest DC value was AS03 ($3.69 million). The postponement of the replacements made in alternative schedule 01 and alternative schedule 02 resulted in an increase in the DC of $5000, while the anticipation of the replacements made in the alternative schedule 03 resulted in an increase of $48,000. The aspect that stood out the most, in relation to the results presented, was the small variation that the alternative schedules presented in relation to the schedules obtained using the dynamic programing algorithm. With a DC variation of less than 1.4%, the results lead us to conclude that the decision maker will not suffer much harm in choosing any of the alternative schedules tested.
Comparing Different Replacement Policies for Logging Machines in Brazil
Carlos Diniz, Romano Timofeiczyk Junior, Joao Carlos Garzel, Renato Cesar Gonçalves Robert, John Sessions, Eduardo da Silva Lopes
Abstract
A dynamic programing algorithm to identify schedules that minimize the discounted cost (DC) of logging machines over a planning horizon including gains from technological progress was used. The identified schedules were also compared with three alternative replacement policies derived from the literature and Brazilian forestry companies. The case study used a harvester and a forwarder and a 100-year planning horizon, where the maximum replacement limit was 8 years. To apply the dynamic programing algorithm, it was necessary to generate lists from cash flows, which incorporated the possible replacement combinations of a series of machines according to the length of the planning horizon and the maximum replacement limit. The lists were formed by three descriptors: predecessor node (moment of purchase of the machine), future node (point of sale for the acquisition of a new machine), and arc value (DC information, the mean production cost and mean production). The results show that the DC identified for the series of harvester replacements was higher compared to the forwarder. It was also identified that the harvester's economic life is shorter, and with technological progress, there was a reduction in the economic life of both machines. Technological progress was also responsible for reducing the average production cost and increasing the average production of machines. When comparing the alternative schedules (AS), it was found that, although AS had a higher DC value and mean production costs, there was very little difference between them. In the harvester's case, AS01 had the highest DC value ($4.36 million). By choosing it, the decision maker would bear a DC boost of $54,000, while AS02 and AS03 would trigger an increase of $43,000 and $32,000, respectively. For the forwarder, the schedule with the highest DC value was AS03 ($3.69 million). The postponement of the replacements made in alternative schedule 01 and alternative schedule 02 resulted in an increase in the DC of $5000, while the anticipation of the replacements made in the alternative schedule 03 resulted in an increase of $48,000. The aspect that stood out the most, in relation to the results presented, was the small variation that the alternative schedules presented in relation to the schedules obtained using the dynamic programing algorithm. With a DC variation of less than 1.4%, the results lead us to conclude that the decision maker will not suffer much harm in choosing any of the alternative schedules tested.
Keywords: Dynamic programing, equipment replacement problem, minimizing costs, harvester, forwarder
1. Introduction
The mechanization of forest operations was only possible due to technological progress over the decades (McEwan et al. 2019). As a result, companies, contractors, and independent producers were able to increase safety during the activities, with a higher level of productivity (Mac Donagh et al. 2020). Silversides (1972) was among the first researchers to address this subject, which has since been studied by many researchers (e.g. Spinelli et al. 2014, Mac Donagh et al. 2017, Harrill et al. 2019, Nordfjell et al. 2019, Mac Donagh et al. 2020).
Silversides (1997) reported that, as mechanization of wood harvesting operations progressed, non-mechanized systems transitioned to fully mechanized systems. Nowadays this progress tends to be greater, mainly due to automation technology, as observed in the fields of robotics, artificial intelligence, and control systems (Lindroos et al. 2017).
In Brazil, it was only during the 1970s, when trees planted following reforestation incentives were being harvested, that the modernization of wood harvesting operations began. It was also during this time that the national industry began to produce small and medium-sized machinery (Machado et al. 2014). Until then, few companies used machines in wood harvesting operations (Lima and Leite 2014), while in North America, different types of forest machines were already being used (Conrad IV et al. 2018).
Brazil is among the five largest producers of industrial roundwood with more than 145 million solid cubic meters per year (FAO 2016). With such a large annual harvest volume, it is necessary to use high technology machines, so that this demand is met. According to Lundbäck et al. (2021), world-wide, 70% of logging activities are being made with fully mechanized systems. Cut-to-length harvesting methods represented 45%, while full-tree harvesting methods represents 25%.
In 2020, the Brazilian forestry sector invested around $136 million in harvesting machine purchases, 24% higher than in 2019 (IBA 2021). There are some reasons, that are not exclusive to each other, that can make the replacement of machines economical, such as machine deterioration, technological progress, or change in the operation itself, which ends up making the current machine an inappropriate choice, presenting high costs (Yatsenko and Hritonenko 2020). Spinelli et al. (2019) commented that replacements due to changes in operation have been occurring frequently due to changes in the characteristics of the stand, such as reduction of the individual volume of trees and the establishment of forests in rough terrain.
Among the methods to determine the economic life of harvesting machines, most common are the equivalent annual cost, differential equations and dynamic programing (e.g. Marques et al. 2005, Cantú et al. 2017, Diniz and Sessions 2020). Although there are many methods available, Cantú and Lebel (2010) observed some resistance on the part of contractors in using the methods, making their decisions based on personal experience and intuition. One of the reasons for this behavior is the complexity of applying such methods. The authors also identified that, generally, replacements are held longer than the optimal time.
The aims of this study were to use a dynamic programing algorithm to identify schedules that minimize the discounted cost of logging machines over a planning horizon including gains from technological progress. The dynamic programing approach permits a flexible approach, where all inputs can be varied over the planning horizon including assumptions of the rate and magnitude of technological change, cost inputs, and the discount rate. The identified schedules were also compared with three alternative replacement policies derived from the literature and Brazilian forestry to show whether the decisions taken are far from the economic optimal or not.
2. Material and Methods
2.1 Problem Formulation and Assumptions
The replacement problem is illustrated using two fully mechanized cut-to-length harvesting machines (Fig. 1). These machines were deployed to harvest hybrid clones E. grandis (W Hill ex Maiden) and E. urophylla (ST Blake), usually harvested between five and seven years depending on the productivity of the forest. All the study plantations were predominantly established on a ground slope gradient below 30%.
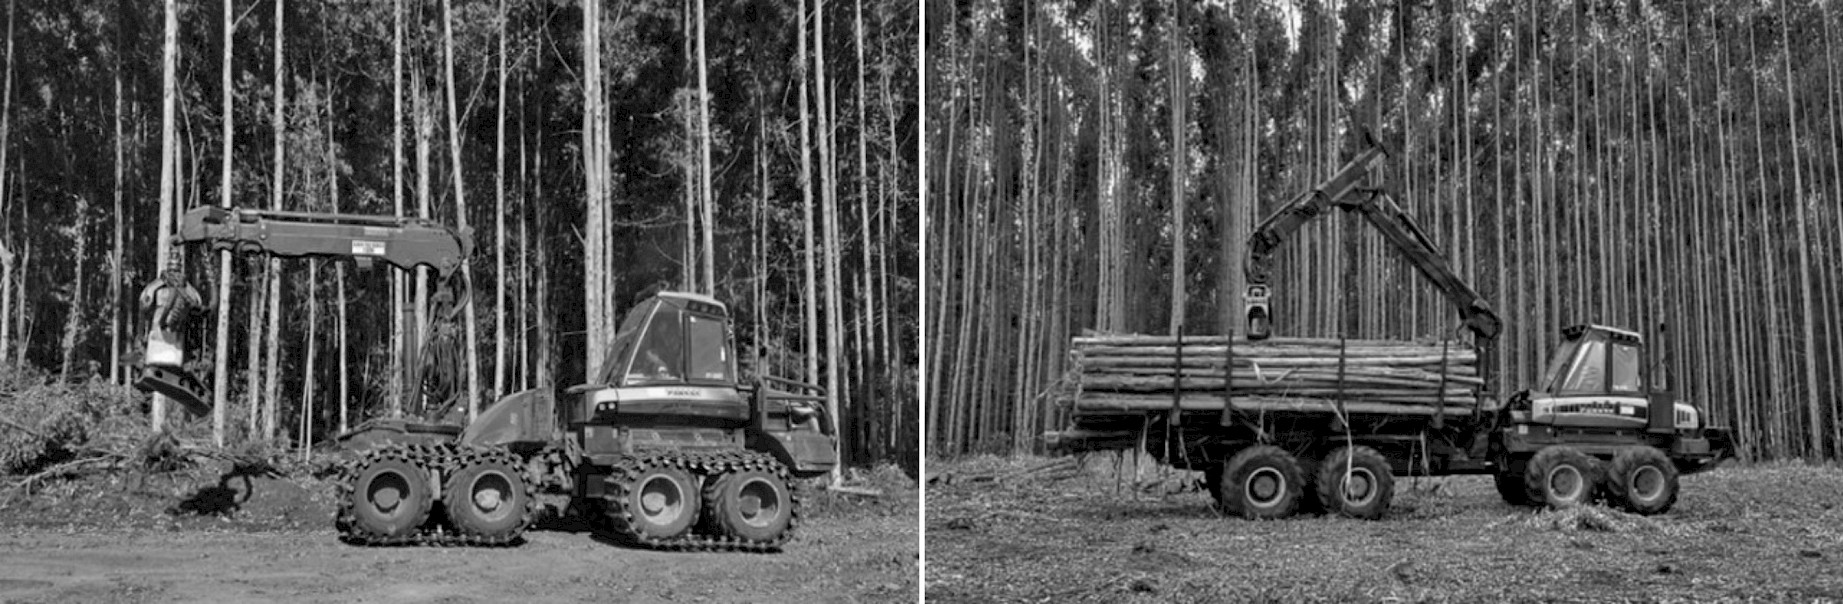
Fig. 1 Ponsse Bear harvester (left) and Ponsse Elephant forwarder (right) used in the study
As in our previous work (e.g. Diniz et al. 2020, Diniz and Sessions 2020), it is assumed that the desired machine replacement schedule is one that minimizes discounted cost (DC) subject to production targets by Eq. 1 (Bowman and Fetter 1967).
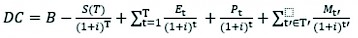 (1)
(1)
Where:
DC discounted cost
B purchase price of the new machine at time T
S(T) salvage value of the machine of age T
E operating and maintenance cost at time t for the machine bought in time t
P cost at time t for the lost production at time t
Mt' overhaul cost at time t' where t' is in the set T' of overhaul times
i discount rate.
As the machine works, maintenance cost increases, and availability decreases. Major parts are replaced or rebuilt as a function of operating hours. A production penalty is applied if the availability of the machine falls below a specified level, and a substitute machine must be »rented« to make up the lost production. Thus, during the hours of non-operation, the work is done by a contractor, so that the company's production target can be met.
Eq. 2  was used to calculate the residual value, made available from the machine manufacturer.
 (2)
(2)
Where:
RV residual value, %
HR hour meter, h
B purchase price of the new machine at time T.
2.2 Data Acquisition
Appendix 1 shows O&M costs, productivity, and machine utilization over the machine life. This information was obtained from the company's historical database, making it possible to obtain reliable values that fit the scope of the research. Continuously variable costs were used to estimate O&M costs, as they occur less frequently, and can affect the replacement decision. To calculate the productivity of the machine for each month, a constant tree size (0.29 m³) and average forwarding distance (400 m) were used. This could also have been varied over the planning horizon if suggested by the strategic plan.
Table 1 provides the initial purchase price, discount rate, lost production penalty, overhaul costs, and expense schedule as well as the equations for cost and productivity changes over time. The real discount rate used to discount the cash flow values in this research was defined according to the willingness of the company studied to accept a risky investment for this type of project.
Table 1 Machine inputs to calculate DC
|
Parameters |
Harvester |
Forwarder |
Next generation equations |
|
Purchase price, $ |
444,480 |
425,960 |
Y = Xt0 + 2000 ln(t) |
|
Machine utilization, % |
appendix 1 |
Y = Xt0+ 0.01 ln(t) |
|
|
O&M cost, $ PMH |
appendix 1 |
Y = Xt0 + 1 ln(t) |
|
|
Productivity, t PMH |
appendix 1 |
Y = Xt0 + 0.2 ln(t) |
|
|
Tires, $ 1 |
8019 |
Y = Xt0 + 100 ln(t) |
|
|
Tracks, $ 1 |
12,000 |
Y = Xt0 + 100 ln(t) |
|
|
Hydraulic pump, $ 1 |
10,000 |
Y = Xt0 + 100 ln(t) |
|
|
Engine, $ 1 |
9000 |
Y = Xt0 + 100 ln(t) |
|
|
Harvester head, $ 1 |
44,000 |
Y = Xt0 + 200 ln(t) |
|
|
Lost productivity penalty $ PMH |
100 |
Y = Xt0 + 1.2 ln(t) |
|
|
Discount rate, a.a. % |
6.45 |
– |
|
|
Schedule machine hour SMH month |
510 |
– |
|
|
Planning horizon, months |
1200 |
– |
|
|
1 Overhaul replacement times (tires = 8000 hours; tracks and hydraulic pump = 10,000 hours harvester head = 12,000 hours; engine = 20,000 hours) Y = Parameter X = Initial parameters value in t0 |
|||
To calculate the cash flow lists, Visual Basic for Applications (VBA) was used. Fig. 2 shows the logic diagram to calculate the input data by Equation 1 to form the lists for each machine.
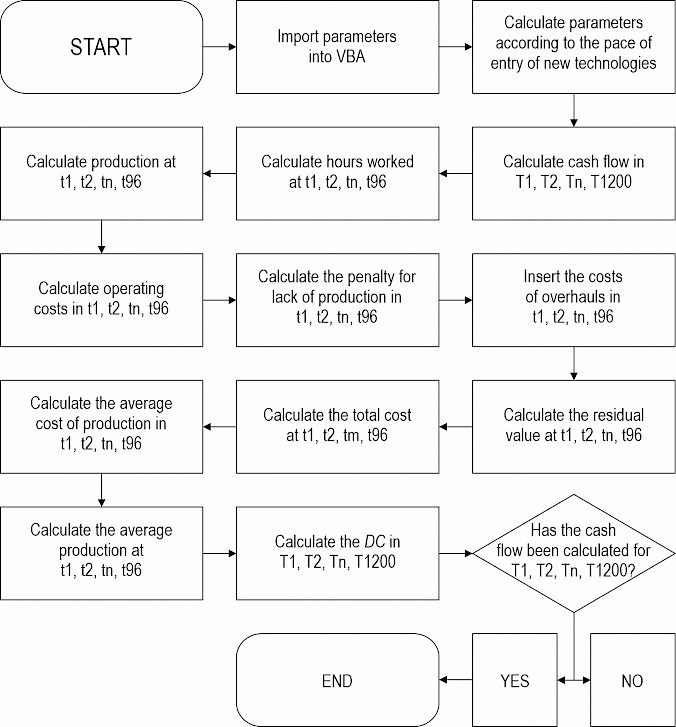
Fig. 2 Logic diagram to calculate input data by Eq. 1
2.3 Optimal Machine Replacement Schedule
The problem is solved as a dynamic programing problem recognizing a special network structure that permits the use of the so-called forward reaching algorithm (Denardo 1984). All investment opportunities need only three descriptors - period born, period died, and DC value. Using a list of investment opportunities generated by »period born«, the number of calculations needed to arrive at the optimal solution is equal to the length of the list. The encoding of the forward reaching algorithm in VBA to minimize DC is described below.
DO i = 1; nArcs
{
If bestvalue(begnode(i)) + netvalue(i) < bestvalue(endnode(i))
bestvalue(endnode(i)) = bestvalue(begnode(i)) + netvalue(i)
prednode(endnode(i)) = begnode(i)
}
Where:
nArcs number of machine replacement options (arcs) over planning horizon
begnode(i) period (node) in which a machine is born (purchased)
endnode(i) period (node) in which a machine dies (salvaged)
bestvalue(i) current lowest discounted cost at period (i)
netvalue(i) discounted cost of a machine born in period begnode(i) and dying in period endnode(i)
prednode(i) predecessor node used for tracing back the optimal path
After identifying the node with the lowest DC at the end of the planning horizon, the recursion technique is used from its predecessor node, as described below:
TOP = L
K = prednode(L)
DO WHILE k > 1
{
TOP = K
K = prednode(K)
}
LOOP
Where:
L desired planning horizon
prednode(L) arc that presents the smallest DC for the desired planning horizon
prednode(K) predecessor arc used to execute the optimal economic schedule.
2.4 Comparing Optimal Schedule with Alternative Schedules
Using the same lists generated after calculating the cash flows, the DC value and the average production cost of each machine over the planning horizon were identified using the interval proposed by the alternative replacement policies. The final DC value for each of the alternative replacement policies is the sum of its values presented by each of the machines over the planning horizon.
Alternative schedules 01 and 02 were extracted from works carried out by Spinelli et al. (2011) and Malinen et al. (2016), respectively. In their study, age, size, annual use, and price of the cut-to-length harvesters and forwarders for sale in North America and Europe were investigated, using sales data from the online marketplace.
Alternative schedule 3 was based on a replacement schedule that is generally adopted by some Brazilian forestry companies. This replacement schedule suggests that all machines should be replaced within 5 years of use. In Table 2, it is possible to verify the alternative schedules used and their respective replacement intervals.
Table 2 Replacements intervals used for each alternative schedule
|
Alternative schedule |
Harvester |
Forwarder |
Source |
|
AS01 |
94 months |
91 months |
Spinelli et al. 2011 |
|
AS02 |
88 months |
90 months |
Malinen et al. 2016 |
|
AS03 |
60 months |
60 months |
Brazilian forest companies |
It is important to note that these schedules were applied to the same lists generated to identify the optimal economic replacement schedule using the forwarding algorithm. Thus, for the harvester, the AS01 started with the connection between the predecessor node t0 and the future node t94, progressively going to the end of the planning horizon. The same routine was performed for the forwarder and the other schedules.
In order to verify if there is a statistical difference between the means, the results of production costs were submitted to analysis of variance. Initially, the variances of the treatments (alternative schedules) were evaluated for their homogeneity using the Bartlett test. Variables whose variances were homogeneous had the effects of the treatments tested using the F test. When the results revealed statistically significant differences between treatment means, the means were compared by Tukey's test at a 5% significance level. A statistical test was not applied to the DC values because averages do not form them.
3. Results
The harvester and forwarder replacement schedules had a total of 22 and 16 replacements, respectively. For the harvester, the purchase, use and resale of machines over the planning horizon converged to a DC of $4.3 million, while for the forwarder, the DC was $3.6 million (Fig. 3). This difference between the results can be explained by the costs involved in the formation of the cash flows of each machine, which are higher in the case of the harvester, as it is a machine of greater complexity in terms of engineering.
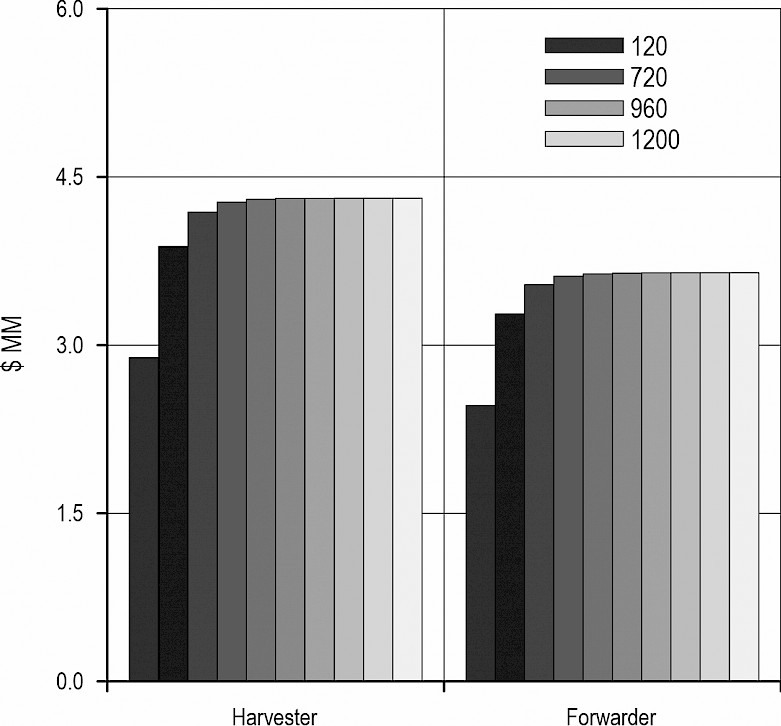
Fig. 3 Accumulated discounted cost over 1200 month planning horizon
Given the 1200-month planning horizon, the results given in Fig. 3 show that after 720 months, the value of the discounted cost increases by less than 0.01% in comparison to the last period, indicating that it is not necessary to go so far into the solution; however, the calculation time is trivial (less than 1 second in VBA on a 64-bit, 4-core, 2.7 GHz, laptop).
Yatsenko and Hitronenko (2011, 2017, 2020) comment that a reduction in the production cost and an increase in production is expected from the entry of new technologies. The results presented in Table 3 are consistent with this hypothesis. As can be seen, the production costs of the economic optimal series of replacement of the harvester and the forwarder showed a reduction, while there was an increase in the production.
Table 3 Production and production cost of selected machines over the planning horizon
|
Replacements |
Harvester |
Forwarder |
Harvester |
Forwarder |
|
Production, tonnes/month |
Cost, $/tonne |
|||
|
1 |
7791 |
14,816 |
4.22 |
2.02 |
|
2 |
7961 |
15,134 |
4.17 |
1.94 |
|
3 |
8051 |
15,303 |
4.12 |
1.92 |
|
4 |
8121 |
15,440 |
4.08 |
1.87 |
|
5 |
8159 |
15,498 |
4.07 |
1.87 |
|
6 |
8191 |
15,576 |
4.06 |
1.86 |
|
7 |
8218 |
15,616 |
4.06 |
1.86 |
|
8 |
8242 |
15,651 |
4.06 |
1.85 |
|
9 |
8263 |
15,683 |
4.05 |
1.85 |
|
10 |
8282 |
15,711 |
4.04 |
1.85 |
|
11 |
8299 |
15,736 |
4.04 |
1.85 |
|
12 |
8315 |
15,760 |
4.03 |
1.85 |
|
13 |
8329 |
15,781 |
4.03 |
1.85 |
|
14 |
8343 |
15,801 |
4.02 |
1.85 |
|
15 |
8355 |
15,820 |
4.02 |
1.84 |
|
16 |
8367 |
15,868 |
4.01 |
1.84 |
|
17 |
8378 |
– |
4.01 |
– |
|
18 |
8410 |
– |
3.98 |
– |
|
19 |
8420 |
– |
3.98 |
– |
|
20 |
8429 |
– |
3.98 |
– |
|
21 |
8460 |
– |
3.95 |
– |
|
22 |
8490 |
– |
3.93 |
– |
|
Mean |
8267 |
15,575 |
4.04 |
1.87 |
|
SD |
170 |
283 |
0.07 |
0.05 |
Fig. 4 shows that the harvester's AS01 presented the highest DC value ($4.37 million). This value is the result of the purchase, use and resale of 13 machines over the planning horizon. By opting for this schedule, the decision maker would incur a DC increase of $54,000, while AS02 and AS03 would cause an increase of $43,000 and $32,000, respectively, resulting from 14 and 20 replacement decisions, respectively.
In the case of the forwarder, the schedule that presented the highest DC value was AS03 ($3.70 million). AS01 and AS02 presented DC values of $3.65 million, showing little difference in relation to the optimal economic schedule (OSE). The postponement of the substitutions made in the AS01 and AS02 of the forwarder showed an increase in DC of $5000, while the anticipation of the substitutions made in the AS03 resulted in an increase of $48,000.
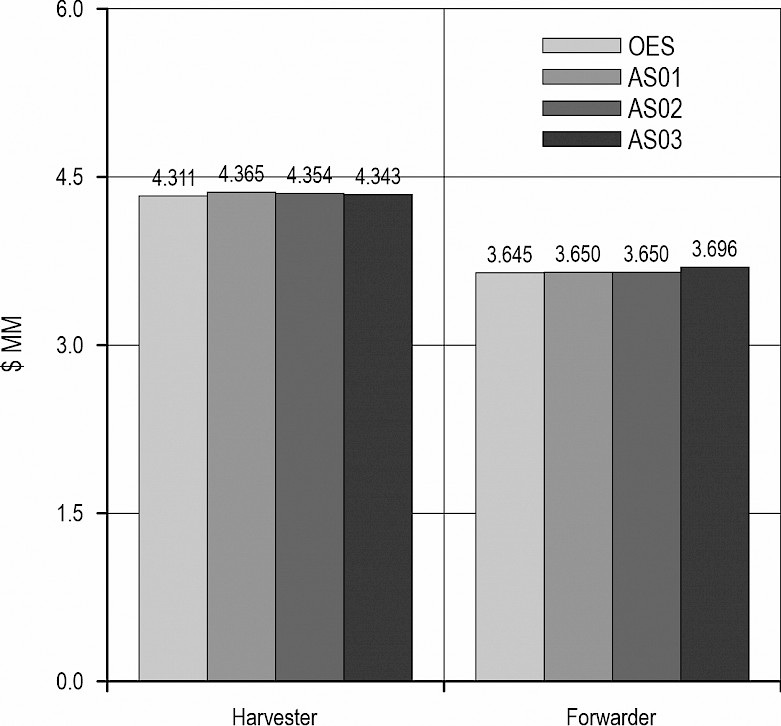
Fig. 4 Accumulated DC for each alternative schedule tested
The harvester's AS01, when compared to the OES showed an increase of 4.7% in the production cost (Fig. 5). AS02 and AS03 showed an increase of 2.7% and 1.7%, respectively. It is also important to highlight that only AS02 showed a significant difference by Tukey's test (p<0.05), when compared to the OES. For the forwarder, it was found that only the AS03 showed a significant difference by Tukey's test (p<0.05). The increase in the DC value is one of the factors that explain this result. The results also allow to verify that the AS01 and AS02 did not present statistical difference by the Tukey test (p<0.05). Previously, it had already been verified that these schedules showed little variation.
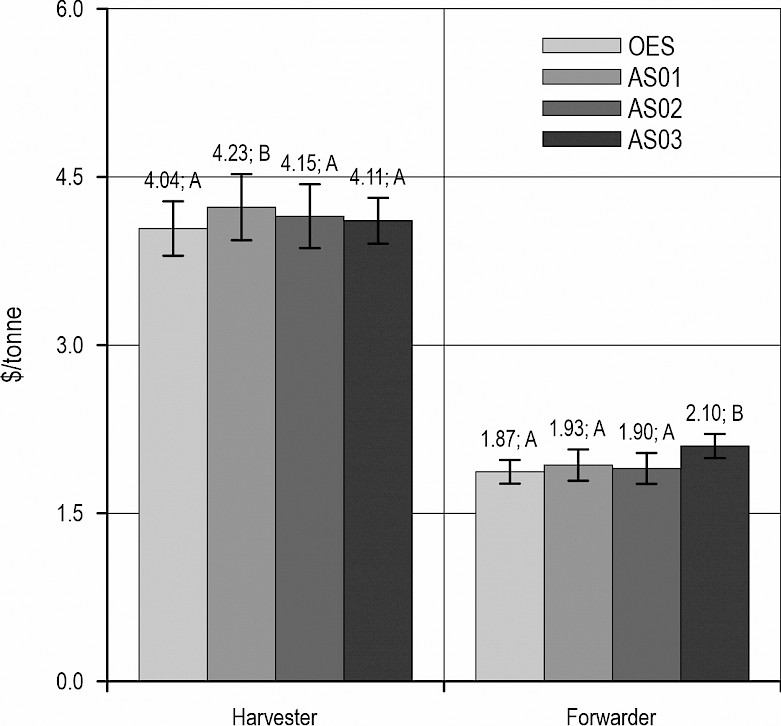
Fig. 5 DC for each alternative schedule tested. Means followed by the same uppercase letter do not differ statistically by Tukey's test (p<0.05)
4. Discussion and Conclusion
The difference between the harvester's and the forwarder's DC is linked to the utilization rate. The machine utilization rate (see appendix) influences the costs with contractors, represented by the lost productivity penalty. The higher the machine utilization rate, the lower the need to hire a contractor. This was one of the costs that most influenced the increase in the harvester's DC in relation to the forwarder. The lower number of decisions to replace the forwarder is related to costs and the process of physical wear of the machines, which was more accentuated for the harvester due to the more complex function it performs.
It is also possible to notice that in both cases the contribution that each replacement decision exerted on the DC was smaller as the planning horizon increased, primarily due to the discount rate. Thus, the further away from the moment t0, the lower the value considered. Another point to be highlighted is the definition of the ideal size of the planning horizon. The planning horizon was chosen based on a DC contribution less than 1% (about month 720). The lower the discount rate, the longer the needed planning horizon to capture the full discounted costs.
Diniz and Sessions (2020) found significant changes in the DC and the equipment life of the selected machines in the optimal economic replacement schedule based on variations in the discount rate. Due to the arithmetic of discounting, higher discount rates reduce the DC, and lower discount rates increase the DC. Thus, the use of higher discount rates favors the use of smaller planning horizons (Rezende and Oliveira 2001), since the point at which the DC contribution is less than 1% was anticipated.
The influence that the entry of new technologies exerted on the results of both machines was consistent with the hypotheses raised by authors such as Hartman and Rogers (2006) and Yatsenko and Hitronenko (2017). It was verified that from the incorporation of new technologies there was a reduction in the economic life of the machines, as verified in the research of Cheevaprawatdomrong and Smith (2003), Rogers and Hartman (2005) and Hritonenko and Yatsenko (2007).
As seen in Table 3 the harvester's and forwarder's production cost was gradually reduced ($4.22/t to $3.93/t and $2.02/t to $1.84/t, respectively). This behavior can be explained through increased productivity of the machines over the planning horizon, which was caused by the entrance of new technology. It is important to emphasize that the average production cost is directly influenced by the amount of wood produced, being very sensitive to any variation, as demonstrated in the research by Costa et al. (2017) and Santos et al. (2017).
The optimal economic replacement schedule had a lower DC value compared to the alternative schedules. Nevertheless, it was found that the difference between the results was less than 1.4%. Diniz and Sessions (2020) had already verified this type of behavior when identifying the optimal economic moment for replacing a harvester. Fig. 4 also shows that, in the case of the forwarder, it may be preferable to make the substitutions in the period proposed by the OES or after it (AS01 and AS02).
When the substitutions were made before the OES, it was noted that the DC value increased (AS03). In other words, by following AS03, the decision maker would incur an increase in costs, mainly due to the devaluation of the machines after the first years of operation. Diniz et al. (2020) identified that the DC cost tended to be higher at the beginning of the machine's economic life, reducing the decline until the economic optimal point of replacement, and then increasing again. The point of interest is that by postponing the replacement decision, the cost increases moderately.
In summary, a process for developing equipment replacement schedules, production, and costs has been outlined that can be used in strategic planning that is consistent with changing macro and microeconomic factors including fuel, labor, equipment, and discount rates. The aspect that stood out the most in relation to the results presented was the small variation that the alternative schedules presented in relation to the schedules obtained using the dynamic programing algorithm. With a DC variation of less than 1.4%, the results lead to the conclusion that, for the range of inputs studied, the decision maker will not suffer much harm in choosing alternative schedules. Risks such as contractor availability, when needed, or capital budgets may be controlled.
Acknowledgements
The authors thank the Brazilian forest company for their support during the data collection. Special thanks to the College of Forestry at Oregon State University as this work was developed while visiting that institution. The authors would also like to thank Dr. Mathew Smidt from the US Forest Service for his valuable and helpful coments.
Funding
This study was financed in part by the Coordenação de Aperfeiçoamento de Pessoal de Nível Superior – Brasil (CAPES) – Finance Code 001.
5. References
Bowman, H., Fetter, R.B., 1967: Analysis for production and operations management. Richard D Irwin, Inc., 3rd edition, 870 p.
Cantú, R.P., LeBel, L., 2010: How adequate are equipment replacement models for logging contractors? Proceedings of the 33rd Annual Meeting of the Council on Forest Engineering (COFE): Fueling the Future, 15 p.
Cantú, R.P., LeBel, L., Gautam, S., 2017: A context specific machine replacement model: a case study of forest harvesting equipment. International Journal of Forest Engineering 28(3): 124–133. https://doi.org/10.1080/14942119.2017.1357416
Cheevaprawatdomrong, T., Smith, R., 2003: A paradox in equipment replacement under technological improvement. Operations Research Letters 31(1): 77–82. https://doi.org/10.1016/S0167-6377(02)00153-0
Conrad IV, J.L., Greene, D., Hiesl, P., 2018: The evolution of logging businesses in Georgia 1987–2017 and South Carolina 2012–2017. Forest Science 64(6): 671–681. https://doi.org/10.1093/forsci/fxy020
Costa, E.M., Marzano, F.L.C., Machado, C.C., Leite, E.S., 2017: Desempenho e custos operacionais de um harvester em floresta de baixa produtividade. Engenharia na Agricultura 25(2): 124–131. https://doi.org/10.13083/reveng.v25i2.751
Denardo, E.V., 1982: Dynamic Programming, Models and Applications. Prentice-Hall Inc., Englewood Cliffs, N.J., 1st edition.
Diniz, C., Sessions, J., 2020: Ensuring consistency between strategic plans and equipment replacement decisions. International Journal of Forest Engineering 31(3): 211–223. https://doi.org/10.1080/14942119.2020.1768769
Diniz, C., Sessions, J., Tmofeiczyk Junior, R., Robert, R., 2020: Equipment replacement policy for forest machines in Brazil. International Journal of Forest Engineering 31(2): 87–94. https://doi.org/10.1080/14942119.2020.1695514
Food and Agriculture Organization of the United Nations, 2016: Statistics yearbook forest products. Rome, Italy.
Harrill, H., Visser, R., Raymond, K., 2019: New Zealand cable logging 2008–2018: a period of change. Current Forestry Reports 5: 1–10. https://doi.org/10.1007/s40725-019-00092-5
Hartman, J.C., Rogers, J.L., 2006: Dynamic programming approaches for equipment replacement problems with continuous and discontinuous technological change. IMA Journal of Management Mathematics 17(2): 143–158. https://doi.org/10.1093/imaman/dpi032
Indústria brasileira de árvores – IBÁ, 2021: Relatório 2021. Recuperado de https://iba.org/datafiles/publicacoes/relatorios/relatorio-iba-2021.pdf.
Lindroos, O., La Hera, P.X.M., Häggström, C., 2017: Drivers of advances in mechanized timber harvesting – a selective review of technological innovation. Croatian Journal of Forest Engineering 38(2): 243–258.
Lima, J.S.S., Leite, A.M.P., 2014: Mecanização. In: Machado, C.C. (2014). Colheita Florestal. Viçosa, MG, 3ª Edição, UFV.
Lundbäck, M., Häggström, C., Nordfjell, T., 2021: Worldwide trends in methods for harvesting and extracting industrial roundwood. International Journaul of Forest Engineering 32(3): 202–215. https://doi.org/10.1080/14942119.2021.1906617
Mac Donagh, P., Botta, G., Schlichter, T., Cubbage, F., 2017: Harvesting contractor production and costs in forest plantations of Argentina, Brazil, and Uruguay. International Journal of Forest Engineering 28(3): 157–168. https://doi.org/10.1080/14942119.2017.1360657
Mac Donagh, P., Velazco, S.J.E., Botta, G., Schlichter, T., Cubbage, F., 2020: Logging contractors' growth in the southern cone: An analysis of contractor business strategies, innovation, and mechanization. Forests 10(1): 1–12. https://doi.org/10.3390/f10010069
Machado, C.C., Silva, E.N., Pereira, R.S., Castro, G.P.O., 2014: O setor florestal brasileiro e a colheita florestal. In: Machado, C.C. (2014). Colheita Florestal. Viçosa, MG, 3ª Edição, UFV.
Malinen, J., Laitila, J., Väätäinen, K., Viitamäki, K., 2016: Variation in age, annual usage and resale price of cut-to-length machinery in different regions of Europe. International Journal of Forestry Engineering 27(2): 95–102. https://doi.org/10.1080/14942119.2016.1171964
Marques, G.M., Silva, M.L., Leite, H.G., Fontes, A.A., 2005: Aplicação da programação matemática na substituição de equipamentos. Árvore 2: 749–756.
McEwan, A., Marchi, E., Spinelli, R., Brink, M., 2019: Past, present and future of industrial plantation forestry and implication on future timber harvesting technology. Journal of Forestry Research 31: 339–351. https://doi.org/10.1007/s11676-019-01019-3
Nordfjell, T., Öhmana, E., Lindroos, O., Ager, B., 2019: The technical development of forwarders in Sweden between 1962 and 2012 and of sales between 1975 and 2017. International Journal of Forest Engineering 30(1): 1–13. https://doi.org/10.1080/14942119.2019.1591074
Rezende, J.L.P., Oliveira, A.D., 2001: Projetos Florestais. 2ª Edição. Universidade Federal de Viçosa – UFV.
Rogers, J., Hartman, J., 2005: Equipment replacement under continuous and discontinuous technological change. IMA Journal of Management Mathematics 16(1): 23–36. https://doi.org/10.1093/imaman/dph027
Santos, L.N., Fernandes, H.C., Silva, R.M.F., da Silva, M.L., de Souza, A.P., 2017: Avaliação de custos do harvester no abate e processamento de madeira de eucalipto. Árvore 41(5): 410–501.
Silversides, C.R., 1972: The mechanization of timber harvesting. 21st Annual Forestry Symposium. Louisiana State University and Agricultural & Mechanical College, »1972: Mechanization, Safety, and Manpower in Southern Forestry«.
Silversides, C.R., 1997: Broad axe to flying shear: the mechanization of forest harvesting east of the Rockies. Transformation Series no. 6, National Museum of Science and Technology. Ottawa, Canada, 174 p.
Spinelli, R., Lombardini, C., Magagnotti, N., 2014: The effect of mechanization level and harvesting system on the thinning cost of Mediterranean softwood plantations. Silva Fennica 48(1): 1–15. https://doi.org/10.14214/sf.1003
Spinelli, R., Visser, R., Han, H., 2019: A decade of forest engineering: Achievements and future directions. Forests 10(9): 1–12. https://doi.org/10.3390/f10090724
Yatsenko, Y., Hritonenko, N., 2017: Machine replacement under evolving deterministic and stochastic costs. International Journal of Production Economics 193: 491–501. https://doi.org/10.1016/j.ijpe.2017.08.013
Yatsenko, Y., Hritonenko, N., 2020: Analytics of machine replacement decisions: economic life vs real options. Management Decision 60(2): 471–487. https://doi.org/10.1108/MD-12-2019-1704
Appendix
Table A1 The machine utilization rate influences the costs with contractors, represented by the lost productivity penalty
|
Hour meter |
Harvester |
Forwarder |
||||
|
Machine utilization |
O&M cost, $ PMH |
Productivity, t PMH |
Machine utilization |
O&M cost, $ PMH |
Productivity, t PMH |
|
|
250 |
0.90 |
135.77 |
20.87 |
0.92 |
116.30 |
41.74 |
|
498 |
0.89 |
137.22 |
20.81 |
0.92 |
116.88 |
41.62 |
|
748 |
0.88 |
138.66 |
20.75 |
0.91 |
117.46 |
41.49 |
|
993 |
0.88 |
140.09 |
20.68 |
0.91 |
118.04 |
41.37 |
|
1238 |
0.87 |
141.53 |
20.62 |
0.90 |
118.62 |
41.24 |
|
1470 |
0.86 |
142.96 |
20.56 |
0.90 |
119.17 |
41.11 |
|
1699 |
0.85 |
144.39 |
20.49 |
0.89 |
119.72 |
40.99 |
|
1926 |
0.84 |
145.81 |
20.43 |
0.88 |
120.26 |
40.86 |
|
2151 |
0.83 |
147.23 |
20.37 |
0.88 |
120.81 |
40.73 |
|
2375 |
0.83 |
148.65 |
20.30 |
0.87 |
121.35 |
40.61 |
|
2597 |
0.82 |
150.07 |
20.24 |
0.86 |
121.89 |
40.48 |
|
2818 |
0.82 |
151.48 |
20.18 |
0.85 |
122.43 |
40.35 |
|
3037 |
0.81 |
152.90 |
20.11 |
0.84 |
122.97 |
40.23 |
|
3256 |
0.81 |
154.30 |
20.05 |
0.83 |
123.51 |
40.10 |
|
3473 |
0.80 |
155.71 |
19.99 |
0.83 |
124.04 |
39.97 |
|
3689 |
0.80 |
157.12 |
19.92 |
0.82 |
124.58 |
39.85 |
|
3905 |
0.79 |
158.52 |
19.86 |
0.82 |
125.12 |
39.72 |
|
4119 |
0.79 |
159.92 |
19.80 |
0.81 |
125.66 |
39.59 |
|
4333 |
0.79 |
161.32 |
19.73 |
0.81 |
126.20 |
39.47 |
|
4546 |
0.78 |
162.71 |
19.67 |
0.80 |
126.74 |
39.34 |
|
4759 |
0.78 |
164.11 |
19.61 |
0.80 |
127.27 |
39.21 |
|
4970 |
0.78 |
165.50 |
19.54 |
0.79 |
127.81 |
39.09 |
|
5181 |
0.78 |
166.89 |
19.48 |
0.79 |
128.35 |
38.96 |
|
5392 |
0.77 |
168.28 |
19.42 |
0.79 |
128.90 |
38.84 |
|
5601 |
0.77 |
169.66 |
19.35 |
0.78 |
129.44 |
38.71 |
|
5810 |
0.77 |
171.05 |
19.29 |
0.78 |
129.98 |
38.58 |
|
6019 |
0.77 |
172.43 |
19.23 |
0.78 |
130.52 |
38.46 |
|
6227 |
0.76 |
173.81 |
19.16 |
0.78 |
131.07 |
38.33 |
|
6435 |
0.76 |
175.19 |
19.10 |
0.77 |
131.61 |
38.20 |
|
6642 |
0.76 |
176.56 |
19.04 |
0.77 |
132.16 |
38.08 |
|
6848 |
0.76 |
177.94 |
18.97 |
0.77 |
132.71 |
37.95 |
|
7054 |
0.76 |
179.31 |
18.91 |
0.77 |
133.25 |
37.82 |
|
7260 |
0.75 |
180.68 |
18.85 |
0.76 |
133.80 |
37.70 |
|
7465 |
0.75 |
182.05 |
18.79 |
0.76 |
134.35 |
37.57 |
|
7670 |
0.75 |
183.42 |
18.72 |
0.76 |
134.90 |
37.44 |
|
7874 |
0.75 |
184.79 |
18.66 |
0.76 |
135.46 |
37.32 |
|
8078 |
0.75 |
186.15 |
18.60 |
0.76 |
136.01 |
37.19 |
|
8281 |
0.74 |
187.52 |
18.53 |
0.75 |
136.56 |
37.06 |
|
8484 |
0.74 |
188.88 |
18.47 |
0.75 |
137.12 |
36.94 |
|
8687 |
0.74 |
190.24 |
18.41 |
0.75 |
137.68 |
36.81 |
|
8889 |
0.74 |
191.60 |
18.34 |
0.75 |
138.24 |
36.68 |
|
9091 |
0.74 |
192.96 |
18.28 |
0.75 |
138.80 |
36.56 |
|
9293 |
0.74 |
194.31 |
18.22 |
0.74 |
139.36 |
36.43 |
|
9494 |
0.74 |
195.67 |
18.15 |
0.74 |
139.92 |
36.31 |
|
9695 |
0.73 |
197.02 |
18.09 |
0.74 |
140.48 |
36.18 |
|
9896 |
0.73 |
198.37 |
18.03 |
0.74 |
141.05 |
36.05 |
|
10,096 |
0.73 |
199.72 |
17.96 |
0.74 |
141.61 |
35.93 |
|
10,296 |
0.73 |
201.07 |
17.90 |
0.74 |
142.18 |
35.80 |
|
10,496 |
0.73 |
202.42 |
17.84 |
0.74 |
142.75 |
35.67 |
|
10,696 |
0.73 |
203.77 |
17.77 |
0.73 |
143.32 |
35.55 |
|
10,895 |
0.73 |
205.11 |
17.71 |
0.73 |
143.89 |
35.42 |
|
11,094 |
0.73 |
206.46 |
17.65 |
0.73 |
144.47 |
35.29 |
|
11,292 |
0.72 |
207.80 |
17.58 |
0.73 |
145.04 |
35.17 |
|
11,490 |
0.72 |
209.14 |
17.52 |
0.73 |
145.62 |
35.04 |
|
11,688 |
0.72 |
210.48 |
17.46 |
0.73 |
146.20 |
34.91 |
|
11,886 |
0.72 |
211.82 |
17.39 |
0.73 |
146.77 |
34.79 |
|
12,084 |
0.72 |
213.16 |
19.65 |
0.73 |
147.36 |
39.30 |
|
12,281 |
0.72 |
214.49 |
19.61 |
0.72 |
147.94 |
39.21 |
|
12,478 |
0.72 |
215.83 |
19.57 |
0.72 |
148.52 |
39.13 |
|
12,675 |
0.72 |
217.16 |
19.52 |
0.72 |
149.11 |
39.05 |
|
12,871 |
0.72 |
218.50 |
19.48 |
0.72 |
149.69 |
38.96 |
|
13,067 |
0.71 |
219.83 |
19.44 |
0.72 |
150.28 |
38.88 |
|
13,263 |
0.71 |
221.16 |
19.40 |
0.72 |
150.87 |
38.79 |
|
13,459 |
0.71 |
222.49 |
19.35 |
0.72 |
151.47 |
38.71 |
|
13,655 |
0.71 |
223.82 |
19.31 |
0.72 |
152.06 |
38.62 |
|
13,850 |
0.71 |
225.15 |
19.27 |
0.72 |
152.65 |
38.54 |
|
14,045 |
0.71 |
226.47 |
19.23 |
0.71 |
153.25 |
38.46 |
|
14,240 |
0.71 |
227.80 |
19.19 |
0.71 |
153.85 |
38.37 |
|
14,435 |
0.71 |
229.12 |
19.14 |
0.71 |
154.45 |
38.29 |
|
14,629 |
0.71 |
230.45 |
19.10 |
0.71 |
155.05 |
38.20 |
|
14,823 |
0.71 |
231.77 |
19.06 |
0.71 |
155.65 |
38.12 |
|
15,017 |
0.70 |
233.09 |
19.02 |
0.71 |
156.26 |
38.03 |
|
15,211 |
0.70 |
234.41 |
18.97 |
0.71 |
156.87 |
37.95 |
|
15,405 |
0.70 |
235.73 |
18.93 |
0.71 |
157.48 |
37.87 |
|
15,598 |
0.70 |
237.05 |
18.89 |
0.71 |
158.09 |
37.78 |
|
15,792 |
0.70 |
238.37 |
18.85 |
0.71 |
158.70 |
37.70 |
|
15,985 |
0.70 |
239.68 |
18.81 |
0.70 |
159.31 |
37.61 |
|
16,178 |
0.70 |
241.00 |
18.76 |
0.70 |
159.93 |
37.53 |
|
16,370 |
0.70 |
242.31 |
18.72 |
0.70 |
160.55 |
37.44 |
|
16,563 |
0.70 |
243.63 |
18.68 |
0.70 |
161.16 |
37.36 |
|
16,755 |
0.70 |
244.94 |
18.64 |
0.70 |
161.79 |
37.28 |
|
16,947 |
0.70 |
246.25 |
18.60 |
0.70 |
162.41 |
37.19 |
|
17,139 |
0.70 |
247.56 |
18.55 |
0.70 |
163.03 |
37.11 |
|
17,331 |
0.70 |
248.87 |
18.51 |
0.70 |
163.66 |
37.02 |
|
17,522 |
0.69 |
250.18 |
18.47 |
0.70 |
164.29 |
36.94 |
|
17,714 |
0.69 |
251.49 |
18.43 |
0.70 |
164.92 |
36.85 |
|
17,905 |
0.69 |
252.79 |
18.38 |
0.70 |
165.55 |
36.77 |
|
18,096 |
0.69 |
254.10 |
18.34 |
0.70 |
166.18 |
36.68 |
|
18,287 |
0.69 |
255.41 |
18.30 |
0.70 |
166.82 |
36.60 |
|
18,478 |
0.69 |
256.71 |
18.26 |
0.69 |
167.46 |
36.52 |
|
18,668 |
0.69 |
258.01 |
18.22 |
0.69 |
168.10 |
36.43 |
|
18,859 |
0.69 |
259.32 |
18.17 |
0.69 |
168.74 |
36.35 |
|
19,049 |
0.69 |
260.62 |
18.13 |
0.69 |
169.38 |
36.26 |
|
19,239 |
0.69 |
261.92 |
18.09 |
0.69 |
170.03 |
36.18 |
|
19,429 |
0.69 |
263.22 |
18.05 |
0.69 |
170.67 |
36.09 |
|
19,619 |
0.69 |
264.52 |
18.01 |
0.69 |
171.32 |
36.01 |
|
19,809 |
0.69 |
265.82 |
17.96 |
0.69 |
171.97 |
35.93 |
|
19,998 |
0.69 |
267.12 |
17.92 |
0.69 |
172.63 |
35.84 |
|
20,188 |
0.68 |
268.41 |
17.88 |
0.69 |
173.28 |
35.76 |
|
20,377 |
0.68 |
269.71 |
17.84 |
0.69 |
173.94 |
35.67 |
|
20,566 |
0.68 |
271.01 |
17.79 |
0.69 |
174.60 |
35.59 |
|
20,755 |
0.68 |
272.30 |
17.75 |
0.69 |
175.26 |
35.50 |
|
20,944 |
0.68 |
273.59 |
17.71 |
0.69 |
175.92 |
35.42 |
|
21,132 |
0.68 |
274.89 |
17.67 |
0.68 |
176.59 |
35.34 |
|
21,321 |
0.68 |
276.18 |
17.63 |
0.68 |
177.25 |
35.25 |
|
21,509 |
0.68 |
277.47 |
17.58 |
0.68 |
177.92 |
35.17 |
|
21,697 |
0.68 |
278.76 |
17.54 |
0.68 |
178.59 |
35.08 |
|
21,885 |
0.68 |
280.05 |
17.50 |
0.68 |
179.27 |
35.00 |
|
22,073 |
0.68 |
281.34 |
17.46 |
0.68 |
179.94 |
34.91 |
|
22,261 |
0.68 |
282.63 |
17.41 |
0.68 |
180.62 |
34.83 |
|
22,449 |
0.68 |
283.92 |
17.37 |
0.68 |
181.30 |
34.75 |
|
22,636 |
0.68 |
285.20 |
17.33 |
0.68 |
181.98 |
34.66 |
|
22,824 |
0.68 |
286.49 |
17.29 |
0.68 |
182.66 |
34.58 |
|
23,011 |
0.68 |
287.78 |
17.25 |
0.68 |
183.35 |
34.49 |
|
23,198 |
0.68 |
289.06 |
17.20 |
0.68 |
184.04 |
34.41 |
|
23,385 |
0.68 |
290.35 |
17.16 |
0.68 |
184.73 |
34.32 |
|
23,572 |
0.67 |
291.63 |
17.12 |
0.68 |
185.42 |
34.24 |
|
23,759 |
0.67 |
292.91 |
17.08 |
0.68 |
186.11 |
34.15 |
|
23,946 |
0.67 |
294.19 |
17.04 |
0.68 |
186.81 |
34.07 |
|
24,132 |
0.67 |
295.48 |
18.55 |
0.68 |
187.51 |
37.11 |
|
24,318 |
0.67 |
296.76 |
18.51 |
0.68 |
188.21 |
37.02 |
|
24,505 |
0.67 |
298.04 |
18.47 |
0.67 |
188.91 |
36.94 |
|
24,691 |
0.67 |
299.32 |
18.43 |
0.67 |
189.61 |
36.85 |
|
24,877 |
0.67 |
300.59 |
18.38 |
0.67 |
190.32 |
36.77 |
|
25,063 |
0.67 |
301.87 |
18.34 |
0.67 |
191.03 |
36.68 |
|
25,249 |
0.67 |
303.15 |
18.30 |
0.67 |
191.74 |
36.60 |
|
25,434 |
0.67 |
304.43 |
18.26 |
0.67 |
192.45 |
36.52 |
|
25,620 |
0.67 |
305.70 |
18.22 |
0.67 |
193.17 |
36.43 |
|
25,805 |
0.67 |
306.98 |
18.17 |
0.67 |
193.89 |
36.35 |
|
25,991 |
0.67 |
308.25 |
18.13 |
0.67 |
194.61 |
36.26 |
|
26,176 |
0.67 |
309.53 |
18.09 |
0.67 |
195.33 |
36.18 |
|
26,361 |
0.67 |
310.80 |
18.05 |
0.67 |
196.06 |
36.09 |
|
26,546 |
0.67 |
312.07 |
18.01 |
0.67 |
196.78 |
36.01 |
|
26,731 |
0.67 |
313.35 |
17.96 |
0.67 |
197.51 |
35.93 |
|
26,916 |
0.67 |
314.62 |
17.92 |
0.67 |
198.24 |
35.84 |
|
27,101 |
0.67 |
315.89 |
17.88 |
0.67 |
198.98 |
35.76 |
|
27,285 |
0.66 |
317.16 |
17.84 |
0.67 |
199.71 |
35.67 |
|
27,470 |
0.66 |
318.43 |
17.79 |
0.67 |
200.45 |
35.59 |
|
27,654 |
0.66 |
319.70 |
17.75 |
0.67 |
201.19 |
35.50 |
|
27,838 |
0.66 |
320.97 |
17.71 |
0.67 |
201.93 |
35.42 |
|
28,022 |
0.66 |
322.23 |
17.67 |
0.67 |
202.68 |
35.34 |
|
28,206 |
0.66 |
323.50 |
17.63 |
0.66 |
203.43 |
35.25 |
|
28,390 |
0.66 |
324.77 |
17.58 |
0.66 |
204.18 |
35.17 |
|
28,574 |
0.66 |
326.03 |
17.54 |
0.66 |
204.93 |
35.08 |
|
28,758 |
0.66 |
327.30 |
17.50 |
0.66 |
205.68 |
35.00 |
|
28,942 |
0.66 |
328.56 |
17.46 |
0.66 |
206.44 |
34.91 |
|
29,125 |
0.66 |
329.83 |
17.41 |
0.66 |
207.20 |
34.83 |
|
29,309 |
0.66 |
331.09 |
17.37 |
0.66 |
207.96 |
34.75 |
|
29,492 |
0.66 |
332.36 |
17.33 |
0.66 |
208.72 |
34.66 |
|
29,675 |
0.66 |
333.62 |
17.29 |
0.66 |
209.49 |
34.58 |
|
29,858 |
0.66 |
334.88 |
17.25 |
0.66 |
210.26 |
34.49 |
|
30,041 |
0.66 |
336.14 |
17.20 |
0.66 |
211.03 |
34.41 |
|
30,224 |
0.66 |
337.40 |
17.16 |
0.66 |
211.80 |
34.32 |
|
30,407 |
0.66 |
338.66 |
17.12 |
0.66 |
212.58 |
34.24 |
|
30,590 |
0.66 |
339.92 |
17.08 |
0.66 |
213.36 |
34.15 |
|
30,773 |
0.66 |
341.18 |
17.04 |
0.66 |
214.14 |
34.07 |
|
30,955 |
0.66 |
342.44 |
16.99 |
0.66 |
214.92 |
33.99 |
|
31,138 |
0.66 |
343.70 |
16.95 |
0.66 |
215.71 |
33.90 |
|
31,320 |
0.66 |
344.96 |
16.91 |
0.66 |
216.50 |
33.82 |
|
31,503 |
0.65 |
346.21 |
16.87 |
0.66 |
217.29 |
33.73 |
|
31,685 |
0.65 |
347.47 |
16.82 |
0.66 |
218.08 |
33.65 |
|
31,867 |
0.65 |
348.73 |
16.78 |
0.66 |
218.88 |
33.56 |
|
32,049 |
0.65 |
349.98 |
16.74 |
0.66 |
219.68 |
33.48 |
|
32,231 |
0.65 |
351.24 |
16.70 |
0.66 |
220.48 |
33.40 |
|
32,413 |
0.65 |
352.49 |
16.66 |
0.65 |
221.28 |
33.31 |
|
32,594 |
0.65 |
353.74 |
16.61 |
0.65 |
222.09 |
33.23 |
|
32,776 |
0.65 |
355.00 |
16.57 |
0.65 |
222.89 |
33.14 |
|
32,958 |
0.65 |
356.25 |
16.53 |
0.65 |
223.70 |
33.06 |
|
33,139 |
0.65 |
357.50 |
16.49 |
0.65 |
224.52 |
32.97 |
|
33,321 |
0.65 |
358.75 |
16.44 |
0.65 |
225.33 |
32.89 |
|
33,502 |
0.65 |
360.01 |
16.40 |
0.65 |
226.15 |
32.81 |
|
33,683 |
0.65 |
361.26 |
16.36 |
0.65 |
226.97 |
32.72 |
|
33,864 |
0.65 |
362.51 |
16.32 |
0.65 |
227.80 |
32.64 |
|
34,045 |
0.65 |
363.76 |
16.28 |
0.65 |
228.62 |
32.55 |
|
34,226 |
0.65 |
365.01 |
16.23 |
0.65 |
229.45 |
32.47 |
|
34,407 |
0.65 |
366.25 |
16.19 |
0.65 |
230.29 |
32.38 |
|
34,588 |
0.65 |
367.50 |
16.15 |
0.65 |
231.12 |
32.30 |
|
34,769 |
0.65 |
368.75 |
16.11 |
0.65 |
231.96 |
32.22 |
|
34,950 |
0.65 |
370.00 |
16.07 |
0.65 |
232.80 |
32.13 |
|
35,130 |
0.65 |
371.24 |
16.02 |
0.65 |
233.64 |
32.05 |
|
35,311 |
0.65 |
372.49 |
15.98 |
0.65 |
234.48 |
31.96 |
|
35,491 |
0.65 |
373.74 |
15.94 |
0.65 |
235.33 |
31.88 |
|
35,671 |
0.65 |
374.99 |
15.90 |
0.65 |
236.18 |
31.79 |
|
35,852 |
0.65 |
376.23 |
15.85 |
0.65 |
237.03 |
31.71 |
|
36,032 |
0.65 |
377.48 |
15.81 |
0.65 |
237.89 |
31.62 |
|
36,212 |
0.65 |
378.73 |
15.77 |
0.65 |
238.75 |
31.54 |
|
36,392 |
0.65 |
379.98 |
15.73 |
0.65 |
239.61 |
31.46 |
|
36,572 |
0.64 |
381.22 |
15.69 |
0.65 |
240.47 |
31.37 |
|
36,752 |
0.64 |
382.47 |
15.64 |
0.65 |
241.34 |
31.29 |
|
36,931 |
0.64 |
383.72 |
15.60 |
0.65 |
242.21 |
31.20 |
|
37,111 |
0.64 |
384.97 |
15.56 |
0.65 |
243.08 |
31.12 |
|
37,291 |
0.64 |
386.21 |
15.52 |
0.65 |
243.96 |
31.03 |
|
37,470 |
0.64 |
387.46 |
15.48 |
0.64 |
244.83 |
30.95 |
|
37,650 |
0.64 |
388.71 |
15.43 |
0.64 |
245.71 |
30.87 |
|
37,829 |
0.64 |
389.96 |
15.39 |
0.64 |
246.60 |
30.78 |
|
38,009 |
0.64 |
391.20 |
15.35 |
0.64 |
247.48 |
30.70 |
|
38,188 |
0.64 |
392.45 |
15.31 |
0.64 |
248.37 |
30.61 |
|
38,367 |
0.64 |
393.70 |
15.26 |
0.64 |
249.26 |
30.53 |
|
38,546 |
0.64 |
394.95 |
15.22 |
0.64 |
250.16 |
30.44 |
|
38,725 |
0.64 |
396.19 |
15.18 |
0.64 |
251.06 |
30.36 |
|
38,904 |
0.64 |
397.44 |
15.14 |
0.64 |
251.96 |
30.28 |
|
39,083 |
0.64 |
398.69 |
15.10 |
0.64 |
252.86 |
30.19 |
|
39,262 |
0.64 |
399.94 |
15.05 |
0.64 |
253.76 |
30.11 |
|
39,440 |
0.64 |
401.18 |
15.01 |
0.64 |
254.67 |
30.02 |
|
39,619 |
0.64 |
402.43 |
14.97 |
0.64 |
255.59 |
29.94 |
|
39,798 |
0.64 |
403.68 |
14.93 |
0.64 |
256.50 |
29.85 |
|
39,976 |
0.64 |
404.93 |
14.88 |
0.64 |
257.42 |
29.77 |
|
40,155 |
0.64 |
406.17 |
14.84 |
0.64 |
258.34 |
29.69 |
© 2023 by the authors. Submitted for possible open access publication under the
terms and conditions of the Creative Commons Attribution (CC BY) license (http://creativecommons.org/licenses/by/4.0/).
Authors' addresses:
Carlos Diniz, PhD *
e-mail: carloscezardiniz@gmail.com
USDA Forest Service
1400 Independence Ave., SW
Washington DC
USA
Prof. Romano Timofeiczyk Junior, PhD
e-mail: romano.timo@gmail.com
Prof. Joao Carlos Garzel, PhD
e-mail: garzel@ufpr.br
Prof. Renato Cesar Gonçalves Robert, PhD
e-mail: renatorobert@ufpr.br
Federal University of Paraná
Rua XV de Novembro 1299
Curitiba – Parana
BRAZIL
Prof. John Sessions, PhD
e-mail: john.sessions@oregonstate.edu
Oregon state University
College of Forestry
336 Peavy Forest Science Complex
Corvallis OR 97331-5704
USA
Prof. Eduardo da Silva Lopes, PhD
e-mail: eslopes@irati.unicentro.br
State University of the Center-West – UNICENTRO
Rua Salvatore Renna 875
Guarapuava – Parana
BRAZIL
* Corresponding author
Received: November 21, 2022
Accepted: August 8, 2023
Original scientific paper