Effects of Boom-Corridor and Selective Thinnings on Harvester Productivity in Dense Small Diameter Pyrenean Oak (Quercus pyrenaica Willd.) Coppices in Spain
doi: 10.5552/crojfe.2024.2130
volume: 45, issue:
pp: 13
- Author(s):
-
- Herguido-Sevillano Lucía
- Tolosana Eduardo
- Laina Rubén
- de la Fuente Teresa
- Bergström Dan
- Fernandez-Lacruz Raúl
- Nordfjell Thomas
- Article category:
- Original scientific paper
- Keywords:
- coppice thinning, biomass, forest time study, accumulating felling head, Bracke C16c, mechanization
Abstract
HTML
Due to socioeconomic transformations in the 20th century, Quercus pyrenaica Willd. coppices in Spain, as well as other European coppices, have experimented an abandonment and lack of intervention leading to stagnant high density stands with fragile health due to competition. Thinnings are often required to ensure their stability and health, producing forest products such as firewood or biomass, which are key energy sources in a carbon-neutral economy. However, thinnings are seldom performed because they lack economic sustainability due to a low productivity, high costs and low biomass prices. In this study, two thinning methods, selective thinning (ST) and boom-corridor thinning (BCT), were tested carrying out a time study in a high-density small-diameter Q. pyrenaica stand in the León province (Castilla y León, Spain) with a forest harvester base machine, on which an accumulating felling head Bracke C16c was mounted. The residual stands were significantly different regarding the final density (greater in BCT) and the final average DBH (bigger in ST), while thinning intensity (odt·ha-1) was the same. In most work elements, time per tree was not significantly different. BCT showed a significant 48.6% increase in harvester productivity when compared to ST, with averaging 4.43 and 2.99 odt·pmh-1, respectively, due mainly to the average weight per extracted tree, 42% greater in BCT. When considering the common range of unit tree weight, the productivity was 16–23% greater for BCT, far less than observed in the trials. These results show the potential of BCT over ST in the studied conditions, although there is room for improvement. Further studies could include the future evolution of the treated stands and perform a cost analysis.
Effects of Boom-Corridor and Selective Thinnings on Harvester Productivity in Dense Small Diameter Pyrenean Oak (Quercus pyrenaica Willd.) Coppices in Spain
Lucía Herguido-Sevillano, Eduardo Tolosana, Rubén Laina, Teresa de la Fuente, Dan Bergström, Raúl Fernandez-Lacruz, Tomas Nordfjell
Due to socioeconomic transformations in the 20th century, Quercus pyrenaica Willd. coppices in Spain, as well as other European coppices, have experimented an abandonment and lack of intervention leading to stagnant high density stands with fragile health due to competition. Thinnings are often required to ensure their stability and health, producing forest products such as firewood or biomass, which are key energy sources in a carbon-neutral economy. However, thinnings are seldom performed because they lack economic sustainability due to a low productivity, high costs and low biomass prices. In this study, two thinning methods, selective thinning (ST) and boom-corridor thinning (BCT), were tested carrying out a time study in a high-density small-diameter Q. pyrenaica stand in the León province (Castilla y León, Spain) with a forest harvester base machine, on which an accumulating felling head Bracke C16c was mounted. The residual stands were significantly different regarding the final density (greater in BCT) and the final average DBH (bigger in ST), while thinning intensity (odt·ha-1) was the same. In most work elements, time per tree was not significantly different. BCT showed a significant 48.6% increase in harvester productivity when compared to ST, with averaging 4.43 and 2.99 odt·pmh-1, respectively, due mainly to the average weight per extracted tree, 42% greater in BCT. When considering the common range of unit tree weight, the productivity was 16–23% greater for BCT, far less than observed in the trials. These results show the potential of BCT over ST in the studied conditions, although there is room for improvement. Further studies could include the future evolution of the treated stands and perform a cost analysis.
Keywords: coppice thinning, biomass, forest time study, accumulating felling head, Bracke C16c, mechanization
1. Introduction
Many Pyrenean oak, Quercus pyrenaica Willd., stands in Spain have traditionally been managed as coppices for firewood and charcoal production (Moreno-Fernández et al. 2021). In Spain, and throughout Europe, coppices were progressively abandoned in the second half of the 20th century due to the socioeconomic transformations that lead to the decrease in the use of firewood and charcoal (Cañellas et al. 2004). Nowadays these stands are underutilized due to the high harvesting and supply costs and the low biomass market price (Cañellas et al. 2004, Schweier et al. 2015). Abandonment of coppices negatively effects these forest ecosystems as they are dependent on human intervention (Adame et al. 2006). Alternatively, conversion of coppices to high forest with regeneration through sexual reproduction can be achieved by applying thinning treatments (Moreno-Fernández et al. 2021). However, this is a long and complex process, which is difficult to apply in Q. pyrenaica coppices due to natural conditions (Cañellas et al. 2004, Salomón et al. 2017) or economic reasons, leading to an aged high-density stand more prone to growth decay, illnesses, and forest fires (Cañellas et al. 2004).
Lately, utilizing coppices as renewable energy resources has gained interest, as it is a means to mitigate climate changes and to move towards a CO2 neutral society, and a way to upgrade the value of coppices as ecosystems. Besides, it is a tool for developing sustainable rural economies (Becker and Unrau 2018). Following these ideas, the Castilla y León autonomic government designed a plan to invest in the development of bioenergy in the region in a 10-year period (2011–2020), which stressed the importance of the sector's growth. In this plan, the total potential biomass, mostly from forests, was estimated to 12,266,000 oven dried tonnes (odt) for 2020, showing an increasing trend in future years (Junta de Castilla y León 2011). Only in the Castilla y León region, there were 722,773 hectares (ha) of Q. pyrenaica coppices stands, with a high canopy cover; Pyrenean oak trees with diameter at breast height (DBH) of less than 7.5 cm represented 66.7% of the total, and those with a DBH of 7.5–12.5 cm represented 21% (Junta de Castilla y León 2007). Many of these stands have historically been managed as coppices and could potentially be managed to balance the ecologic and socioeconomic needs while providing biomass for the bioenergy sector and thus substitute fossil fuels. Nevertheless, the current high harvesting and supply cost and the low harvesting productivity are bottlenecks that should be solved to achieve long-term sustainable management of these stands. Hence, estimating forest productivity accurately is essential for an effective forest management and to ensure an economic balance. These factors, cost and productivity, have led to a growing mechanization of forest operations throughout the last decades in coppices, as in all other types of stands (González et al. 2014, Spinelli et al. 2016, Tolosana 2021). Moreover, there is a growing lack of labour for manual forest work (e.g., chainsaw operators), which further justifies the need of mechanization (Kärhä et al. 2005). This is in part due to the growing concern about safety and health in the workplace (Blombäck et al. 2003), as the forest sector has very high injury and death rates especially in the manual logging phase, and mechanization is known to decrease the fatality number (Albizu-Urionabarrenetxea et al. 2013).
Besides mechanization, the thinning working method also affects the result of the treatments and affects the productivity and costs. The most common working method is a manual selective thinning from below, where the smaller or damaged trees are extracted. In mechanized thinning, the harvester productivity depends on the average tree size cut, the density of the stand, and the intensity of removal. Whole-tree harvesting reduces costs and increases productivity (e.g., Laina et al. 2013) by using accumulating felling heads with no delimbing of stems, which is not essential if the biomass is intended for the bioenergy sector. By utilizing the whole tree instead of just the stemwood, the potential of biomass harvest substantially increases (di Fulvio et al. 2011). In Q. pyrenaica, the aerial part constitutes 76.9% of the tree biomass, of which 21.5% are branches of less than 7 cm in diameter (Montero et al. 2005) that would be utilized with a whole-tree harvesting. The relative dry weight of branches <7 cm becomes more important with a smaller DBH: on average in Spain, for the 5 cm DBH class, the stem and branches bigger than 7 cm weight 1.8 kg, while the branches <7 cm weight 2.8 kg (Montero et al. 2005). Furthermore, boom-corridor thinning (BCT) is a relatively new thinning working method that could enhance the harvester productivity, and even the forwarder productivity. BCT reduces the time spent in selecting and cutting trees by organizing felling in narrow (1–2 m wide) corridors in linear movements of the harvester boom. Field trials of BCT provided a 16% increase in felling and bunching productivity compared to selective thinning (ST) using current best practice (Bergström et al. 2010). Simulation studies show, however, a theoretical increase of 44–46% (Bergström et al. 2007, Sängstuvall et al. 2012). Witzell et al. (2019) show that BCT may also render biodiversity advantages compared to selectively thinned stands, as patches in the stand are left untreated. However, BCT has only been tried in boreal conifer stands outside the Mediterranean region.
Thus, due to the scarcity of scientific studies on the productivity and costs of biomass extraction in Q. pyrenaica coppices and the lack of knowledge on the effect of the BCT working method in this type of stands, the objectives of the present paper were to:
quantify and compare the harvester felling and bunching productivity implementing ST and BCT in small diameter Q. pyrenaica stands, and to understand the most important factors influencing the performance
and evaluate the treatments, measuring the residual stands conditions.
2. Materials and Methods
A total of 20 study units, divided equally between two stands, were laid out in the public forest nº 40 »Dehesa y Coso«, located in the León province, Spain. The forest is owned by the Owners Community »Villar de Ciervos«, formed by citizens of a small village. These study units were 50 m long and 20 m wide each, giving an individual area of 1000 m², with a central strip road marked with red tape (Fig. 1). In each study unit, two perpendicular transects of 20x5 m (100 m²) were laid out, in which stand data was collected pre- and post-thinning. The centres of these transects were at 12.5 m and 37.5 m from the starting point of the strip road (Fig. 1). On these transects, all the DBH>1 cm were measured and trees below this size were counted. The coverage of trees and shrubs, besides the shrub average height, were visually estimated and recorded.
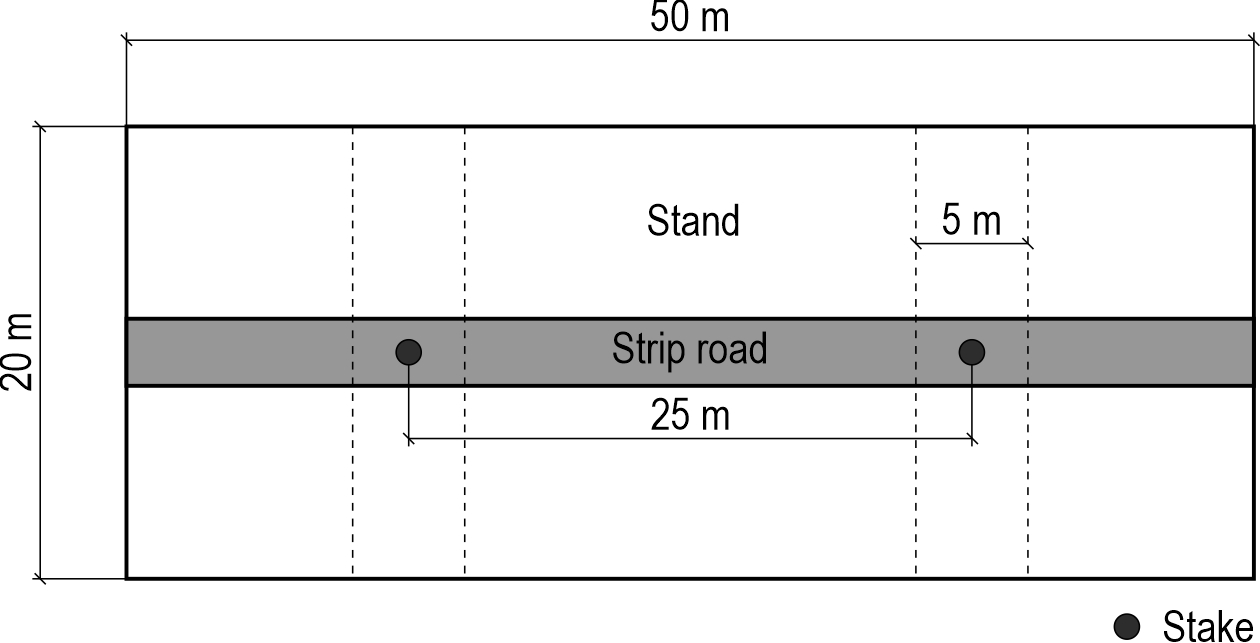
Fig. 1 Schematic sketch over properties of a study unit and transects for inventory
In each stand, the two tested treatments (BCT vs. ST) were assigned to the study units randomly in an alternative way. In both stands, the slope ranged from 5% to 10%, the ground was mostly flat with some small or medium boulders, and the soil bearing capacity was high during trials. Field trials were performed in September – October 2021.
The vegetation was a monospecific coppice of Q. pyrenaica, with shoots with an estimated age of 35–40 years that provided an on-site visually estimated 90–100% tree coverage. For both stands, the density was on average 9200 trees per hectare, with an average DBH of 5.1 cm and a basal area (G) of 23.93 m²·ha-1 (Table 1). No clearing of the undergrowth was performed before thinning treatments. Therefore, small shoots of Q. pyrenaica and disperse spots of heather (Erica sp.) of 1–2 m of height were present in both stands. There was an on-site visually estimated shrub coverage of 20–40%, but it went up to 60–80% in some study units.
The initial pre-treatment characteristics of the study units can be found in Table 1, with stand and method as factors. There was a significant difference between stands in the total estimated dry weight and the basal area. No interactions were found between factors.
Table 1 Significant difference between initial averages, with »method« and »stand« as factors. Different subindex letters mean that there is a significant difference at 95% fiducial probability between adjacent columns. Min and max average values are in brackets, standard deviation in square brackets
|
PRE-TREATMENT |
Stand 1 |
Stand 2 |
p-value |
ST |
BCT |
p-value |
Inter. |
||
|
Total density trees·ha-1 |
11,590a (8300–14,550) [2308] |
13,185a (5200–17,550) [3273] |
0.2436 |
12,445a (5200–16,150) [3221] |
12,330a (8300–17,550) [2659] |
0.9315 |
No |
||
|
Density trees DBH >1 cm·ha-1 |
9185a (6650–11,150) [1547] |
9220a (4350–13,200) [2496] |
0.9638 |
9355a (4350–11,450) [2107] |
9050a (6550–13,200) [2033] |
0.7514 |
No |
||
|
Average DBH cm |
5.18a (4.25–6.05) [0.56] |
5.39a (4.00–9.00) [1.35] |
0.6561 |
5.51a (4.50–9.00) [1.29] |
5.05a (4.00–5.95) [0.62] |
0.3350 |
No |
||
|
Total dry weight [Estimated] odt·ha-1 |
48.04a (35.77–58.29) [8.77] |
60.17b (44.82–76.85) [10.53] |
0.0126* |
Stand 1 62.79a (43.24–83.48) [14.92] |
Stand 2 87.54a (75.11–106.72) [12.76] |
Stand 1 59.02a (42.55–74.83) [15.12] |
Stand 2 85.98a (59.59–133.29) [28.60] |
Stand 1: 0.7023 Stand 2: 0.9144 |
No |
|
Basal area m²·ha-1 |
22.36a (17.95–27.25) [3.34] |
26.24b (21.77–31.75) [3.31] |
0.0117* |
Stand 1 22.84a (18.98–25.96) [2.86] |
Stand 2 28.45b (24.90–31.75) [2.72] |
Stand 1 21.89a (17.95–27.25) [4.05] |
Stand 2 24.03b (21.77–27.01) [2.25] |
Stand 1: 0.6776 Stand 2: 0.0232* |
No |
|
Dry unit weight [Estimated] kg·tree DBH >1cm |
5.36a (3.56–7.50) [1.31] |
7.38a (3.40–16.87) [3.86] |
0.1499 |
6.71a (3.87–16.87) [3.75] |
6.02a (3.40–10.58) [2.13] |
0.6140 |
No |
||
|
Different subindex letters mean that there is a significant difference at 95% fiducial probability between adjacent columns Min and max average values are in brackets, standard deviation in square brackets |
|||||||||
The basic machinery was a Komatsu 901.4 six-wheeled harvester (Komatsu Forest AB, Sweden). It was 2.8 m wide and weighted approximately 15 t, plus 2 t of chains and tracks. The engine power was 150 kW. The crane, which rotated with the cabin and had a 10 m reach (Cranab AB, Sweden), was equipped with an accumulating felling head (AFH) »Bracke C16.c« (Bracke Forest AB, Sweden). This AFH, weighting 657 kg, was specifically designed for harvesting small diameter trees, up to ca 26 cm in diameter. The head was equipped with two pairs of accumulating arms for multi-tree handling of several trees in each crane-cycle. The head cut trees using a self-tensioning ¾" cutting chain installed on a circular disc. This version of the C16 head was specially equipped with a horn-shaped supporting plate, placed 36 cm above the accumulating claws, to support and stabilize handling of tall trees (Fig. 2).
In both ST and BCT, the operator decided by visual inspection which trees/corridors were to be cut in the stand. In the ST method, the operator targeted to remove the dominant or malformed trees until the desired tree density was achieved (corresponding to a 50% removal of initial basal area). In other words, a quality thinning from below was implemented.
In the BCT method, the operator targeted to cut trees between strip roads in 1–2 m wide oblique boom-corridors and fell all trees in the corridor regardless of their quality. In order to reach the target density, corridors were space at 4–5 m (Fig. 3).
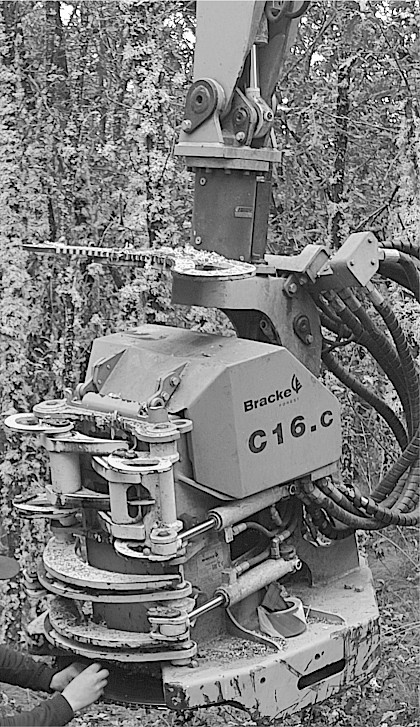
Fig. 2 Felling and bunching head Bracke C16.c
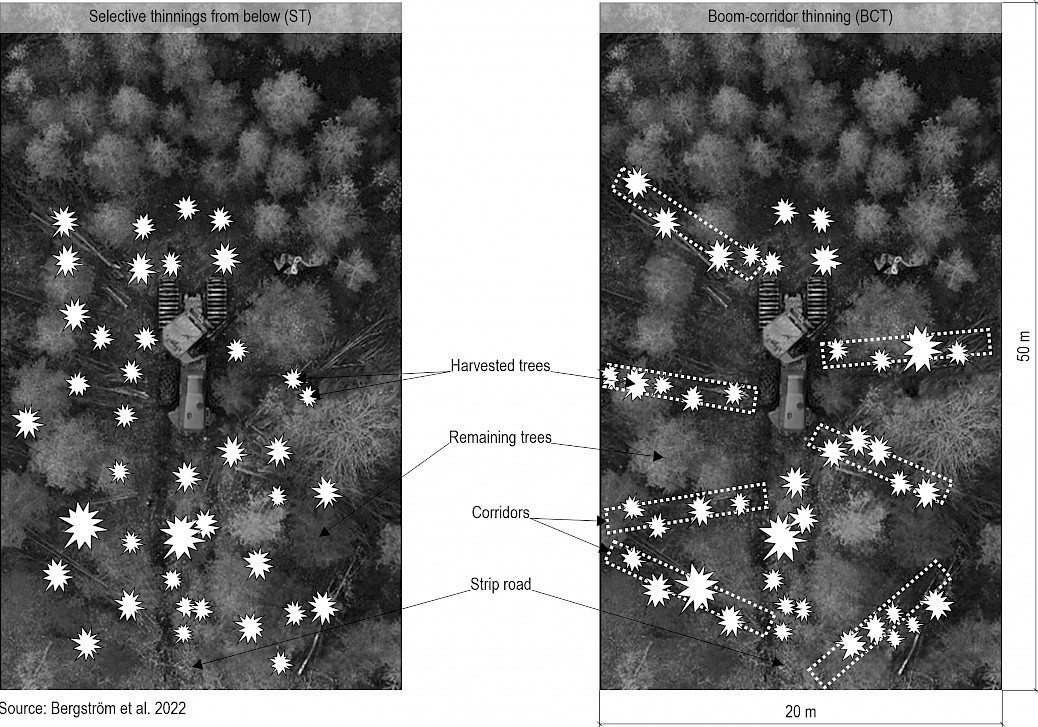
Fig. 3 Aerial photo of harvester with sketches of two thinning methods
The frequency time study was done from inside the machine cabin by an observer sitting behind the machine operator using an »Allegro Field PC« equipped with time-study software that included different work elements in a cycle (Table 2). The time study was done per study unit, starting when the machine was positioned at the beginning of the unit and finished when the machine stopped at the end of the strip road. Every 7 seconds, the work element in progress was recorded. The productive machine time (pmh) was defined as the sum of the work time recorded by the computer excluding delay time and service, maintenance, or ancillary work time.
In addition, an observer outside the machine noted the total time from the starting point to end point in each study unit with a watch. The observer also noted the number of felled trees per cycle, and the number of top buckings and buckings of the bunch done.
Table 2 Work elements in harvester work cycle
|
Work element |
Description |
Priority1 |
|
Boom out |
Boom out for felling or top bucking. Started when the empty boom moved out and ended when the boom slowed down for positioning the AFH on a tree |
1 |
|
Felling in the strip road |
Felling of a tree in the strip road. Started when the boom slowed down for positioning the AFH on a tree and ended when the last tree in the crane cycle was cut and separated from the stump |
1 |
|
Felling in the stand |
Felling of a tree in the stand (between strip roads). Started when the boom slowed down for positioning the AFH on a tree and ended when the last tree in the crane cycle was cut and separated from the stump |
1 |
|
Top bucking |
Bucking of the standing tree at a height of ~4–5 m up, in the stand or strip road. Started when the boom slowed down for positioning the AFH on a tree and ended when the last top bucking was done |
1 |
|
Boom in and bunching |
Started when the AFH cut and separated from the stump the last tree in the crane cycle, the boom was pulled against the machine and ended when the AFH released the bunch |
1 |
|
Bucking of bunch |
Started when the bunch was released on the ground and ended when the bucked part was put on the first part of the bunch |
1 |
|
Moving |
Started when the harvester wheels turned and ended when the harvester wheels stopped |
2 |
|
Miscellaneous |
Other activities such as trees being dropped and then picked up again, cutting of roots of uprooted trees, etc. |
1 |
|
Delays |
Time not related to effective work time such as mechanical breakdowns, personal breaks, etc. |
3 |
|
1 If work elements were performed simultaneously, the element with the highest priority (lowest number) was recorded Source: Bergström et al. 2022 |
||
The felled and bunched biomass (odt) per study unit was bunched along the strip road, and the next week forwarded to the roadside, the bunches separated by study units. After a month, it was weighted with a truck with an integrated scale, and 24 samples were taken for moisture content determination following the ISO 14780:2017 standard, by homogenization, division and drying. According to the ISO 18134:2015 standard, samples were dried at 105 ± 2 °C. For each study unit, productive time, work time and total time of presence in the field were recorded.
The variables used as explanative factors for fitting the productivity predictive equations for felling and bunching were divided into two groups:
estimated beforehand with the initial inventory or measured variables that could be established beforehand by forest management prescriptions: initial density (trees·ha-1); number of tree with DBH < 1 cm (trees·ha-1); initial DBH0 (cm); total initial oven dried weight in kilograms – odkg–, dw0 (odkg·study unit-1), initial basal area G0 (m²·ha-1), initial number of trees per study unit (trees·study unit-1), estimated initial unit dry weight, uw0 (odkg·tree-1); total removed density (extracted trees·ha-1); and extracted basal area, GExt in % and in m²·ha-1
measured variables: final DBHt (cm); count of the number of trees extracted; total scaled dry weight removed, dwExt, in oven dried tonnes – odt – per hectare (odt·ha-1); total estimated dry weight removed, edwExt (odt·ha-1); unit dry weight calculated with dwExt and the count of trees extracted, uwExt (odkg·tree-1); productive time (pmh); and the measured productivity calculated with edwExt and productive time (odt·pmh-1).
In both cases, a categorical variable was tried, namely the dummy variable BCT (dummy = BCT, void = ST). Moreover, the stump height and the width and length of the strip road were other measures used to determine the quality of the remaining stand.
The statistical analysis was made using Statgraphics 19 and R 4.1.3. First, one-factor and multiple-factor ANOVAs were performed for the variables of the pre-treatment inventory, considering stands (1 or 2) and working method (ST or BCT) as factors. This was done to test pre-treatment homogeneity in between locations and study units assigned to each treatment. In the post-treatment results, ANOVA tests were performed in order to determine if there was a significant difference between the impacts of the working method on the different variables. An ANOVA test was performed to find out if there was a significant difference between the productivities of each working method. Differences were considered significant if p<0.05. Afterwards, three pairs of predictive multiple linear regression and non-linear regression models (six in total) were fitted to estimate productivity: one pair per method plus one pair as a combined model for both methods. In each pair, one model was devised with variables measured post-treatment and the other with variables that could be estimated or known before applying the treatment. This was performed to try if reliable productivity estimations could be obtained from variables estimated beforehand or measured in the pre-inventory, and if they were as consistent as the models that used measured variables of the post-inventory. Models were fitted with a multiple linear regression before a variable change. In this case, a stepwise regression was used to select the most significant variables by p-value. In the cases in which the original variable was not the harvester productivity but a derived variable (i.e. logarithmic), the R² was obtained referring to the original dependent variable via non-linear regression.
Additionally, the average percentage from the total time spent in each work element and the time per tree (s·tree-1) for each work element were calculated for each method from the time study. Another ANOVA was performed to see if the times were significantly different between methods.
3. Results
3.1 Residual Stands
Characteristics of the residual stands according to the thinning method applied can be seen in Table 3. There was a significant difference with the method as a factor in the total density left standing, due to the cutting of more trees in the selective method, and in the average DBH of trees standing and dry unit weight standing, which was an expected outcome of selective vs. non-selective thinnings. There was a significant difference with the stand as a factor in the small tree density standing, the strip road length and the stumps height. An interaction between stand and method was only found for the small tree density standing.
Table 3 Residual stand properties in average, min and max (in brackets), and standard deviation (in square brackets) values per treatment
|
POST-TREATMENT |
Stand 1 |
Stand 2 |
p-value |
ST |
BCT |
p-value |
Inter. |
|
Total density standing tree·ha-1 |
3555a (2050–5200) [863] |
3365a (1300–6500) [1503] |
0.6531 |
2695a (1300–3600) [722] |
4225b (2550–6500) [1096] |
0.0017* |
No |
|
Small tree density standing (DBH <1cm) (trees·ha-1) |
25a (0–100) [35] |
95b (0–200) [64] |
0.0037* |
50a (0–150) [53] |
70a (0–200) [71] |
0.3464 |
Yes 0.0275 |
|
DBH cm |
6.3a (4.8–7.5) [0.8] |
6.8a (4.3–12.2) [2.2] |
0.4742 |
7.4a (5.9–12.2) [1.8] |
5.8b (1.25–7.2) [0.94] |
0.0193* |
No |
|
Total dry weight standing [Estimated] (odt·ha-1) |
29.31 (20.91–36.45) [5.45] |
33.69a (21.44–46.26) [8.68] |
0.2134 |
32.16a (20.91–46.26) [8.90] |
30.84a (22.48–44.08) [6.66] |
0.7010 |
No |
|
Basal area standing m²·ha-1 |
12.7a (8.91–15.37) [2.12] |
13.4a (8.67–17.03) [2.6] |
0.5341 |
13.3a (8.67–16.27) [2.66] |
12.8a (10.34–17.03) [2.09] |
0.7153 |
No |
|
Dry unit weight of the trees standing [Estimated] (kg·tree DBH >1 cm-1) |
8.6a (4.8–11.8) [2.0] |
12.7a (4.2–35.6) [8.9] |
0.1324 |
13.4a (7.0–35.6) [8.2] |
7.8b (4.2–14.0) [3.0] |
0.0477* |
No |
|
Strip road width m |
4.61a (3.95–5.10) [0.37] |
4.53a (3.80–5.80) [0.57] |
0.7280 |
4.50a (3.95–5.10) [0.42] |
4.63a (3.80–5.80) [0.53] |
0.5731 |
No |
|
Strip road length m |
52.7a (48.5–56.2) [2.6] |
50.4b (48.0–54.5) [1.8] |
0.0367* |
51.5a (48.0–56.2) [2.7] |
51.6a (48.5–55.0) [2.3] |
0.8960 |
No |
|
Stumps height cm ¹ |
21.7a [14.0] |
28.6b [16.0] |
0.0001* |
25.4a [17.1] |
24.8a [13.6] |
0.706 |
No |
|
¹ No minimum and maximum values in "Stumps height" due to the data being collected by height classes. BCT – boom-corridor thinning, ST – selective thinning Different superindex letters in the same row for the same factor mean that there is a significant difference at 95% fiducial probability |
|||||||
3.2 Time Distribution Among Work Tasks
Although there was a significant difference between methods in the total time per study unit (p<0.001), when dividing the total time of each study unit by the extracted trees, the time per tree cut was not significantly different between methods (p=0.617).
Analyzing the proportion of time spent in each task and the seconds per tree in each task (Table 4), there was a significant difference in the time devoted to moving and to felling tasks, both in the strip road and in the stand. The rest of the tasks do not show significant differences between methods.
The number of accumulations best describes the efficiency when comparing the two methods. One accumulation is the opening of the accumulating claws after doing a cut without releasing the bunch. The one-factor ANOVA showed that the mean number of accumulations between methods is significantly different at 95% confidence (p<0.001), having the BCT method a lower mean number of accumulations per study unit (305.6 in BCT vs. 438.0 in ST), which results in a higher efficiency of the BCT method. The stand does not make a significant difference at 95% confidence.
Moreover, the number of cycles per study unit and the average number of trees cut per cycle were analyzed per method and stand (Table 5). The average number of cycles per study unit was significantly different between both method and stand, while the average number of trees per cycle was only significantly different between stands. No interactions between factors were found. These results are consistent with the difference in basal area and total dry weight between stands (in the case of the average number of trees cut per cycle), and ST having more cycles than BCT with the methods applied.
Table 4 Average time consumption in each task, in minutes per tree, and proportion of total time spent in each task
|
Work element |
Treatment |
p-value |
|||
|
ST, n = 10 |
BCT, n = 10 |
||||
|
Time per tree, s·tree-1 |
Proportion of total time, % |
Time per tree, s·tree-1 |
Proportion of total time, % |
||
|
Boom out |
1.00a (0.49–1.59) |
13 |
0.78a (0.28–1.11) |
10 |
0.146 |
|
Felling in the strip road |
1.76a (1.28–2.19) |
23 |
2.14b (1.63–2.83) |
29 |
0.0186* |
|
Felling in the stand |
2.92a (2.36–3.78) |
38 |
2.39b (1.47–3.13) |
32 |
0.0151* |
|
Top bucking |
0.34a (0–1.81) |
4 |
0.31a (0–1.38) |
4 |
0.889 |
|
Boom in and bunching |
1.21a (0.86v 2.10) |
15 |
1.18a (0.83–2.02) |
16 |
0.801 |
|
Bucking of bunch |
0.03a (0–0.11) |
0 |
0.05a (0–0.27) |
1 |
0.427 |
|
Moving |
0.35a (0.20v 0.48) |
4 |
0.47b (0.33–0.74) |
6 |
0.0158* |
|
Miscellaneous |
0.06a (0–0.15) |
1 |
0.08a (0–0.22) |
1 |
0.474 |
|
Delays |
0.16a (0–1.06) |
2 |
0.06a (0–0.41) |
1 |
0.351 |
|
Total per tree |
7.66a (6.71–10.05) |
– |
7.39a (5.51–10.05) |
– |
0.617 |
|
Average TOBS |
51.14 min·study unit-1a |
33.50 min·study unit-1b |
<0.001* |
||
|
Different superindex letters in the same row mean that there is a significant difference at 95% fiducial probability Min and max values are in brackets, and p-values considered significant are marked (*) |
|||||
Table 5 Total number of cycles in the study and average number of trees per cycle, by method and stand
|
Total Nº cycles in the study |
BCT |
ST |
Sum |
Average Nº cycles study unit-1 |
BCT |
ST |
Total average |
Average Nº Trees·cycle-1 |
BCT |
ST |
Total average |
||
|
Stand 1 |
268 |
389 |
657 |
53.6ᵃ |
77.8ᵇ |
65.7ᶜ |
5.25ᵃ |
5.20ᵃ |
5.22ᵃ |
||||
|
Stand 2 |
320 |
530 |
850 |
64.0ᵇ |
106.0ᵃ |
85.0ᵈ |
4.32ᵇ |
3.83ᵇ |
4.02ᵇ |
||||
|
Sum or average |
588 |
919 |
1507 |
58.8ᶜ |
91.9ᵈ |
75.35 |
4.74ᵃ |
4.41ᵃ |
4.54 |
||||
|
Different superindex letters in a column or row show significant differences calculated with a two-way ANOVA at 95% fiducial probability |
|||||||||||||
3.3 Harvester Productivity
A one-factor ANOVA showed that the productivity measured in the study was significantly different between methods (Table 6), being 48.6% higher for the BCT. The average productivity was 2.99 odt·pmh-1 in ST and 4.43 odt·pmh-1 in BCT.
Table 6 Measured harvester productivity per method and ANOVA p-value
|
Mean |
Min value |
Max value |
sd |
p-value |
|||
|
ST |
2.99a |
1.98 |
4.07 |
0.62 |
0.00818 * |
||
|
BCT |
4.43b |
2.92 |
6.90 |
1.41 |
|||
|
Different superindex letters mean that there is a significant difference at 95% fiducial probability. The significant difference is also indicated by the asterisk (*). All values in odt·pmh-1 |
|||||||
A regression line comparison of productivity and tree size by site was performed for each method to see if there was a learning curve that meant a higher performance in site 2, but neither the intercepts nor the slopes were significantly different for any of the sites (p = 0.67 and p = 0.18 for ST and p = 0.23 and p = 0.56 for BCT).
A productivity equation vs. dry weight per extracted tree – the best common explaining variable - was fitted for each method (Table 7, Fig. 4).
Assuming an equal average dry weight per extracted tree belonging to the common range for both methods (e.g., 6–8 odkg·tree-1), the productivity difference would be + 16–23% greater for BCT, much less than the observed average productivity values. This difference becomes greater with a smaller unit weight.
The fact explaining such a big difference was the different range and average values of dry weight per extracted trees for each method. As there was much less selection in BCT compared to ST, the average weight was significantly greater - 42% (8.99 odkg·tree-1 for BCT vs. 6.32 odkg·tree-1 for ST, p = 0.02).
Table 7 One-variable productivity vs. unit dry weight per extracted tree regression curves
|
Method |
Nº obs¹ |
Equation for productivity odt·pmh-1 |
R² adj, % |
p-value |
sd odt·pmh-1 |
|
ST |
10 |
0.752+0.35·uwExt |
59 |
0.006 |
0.50 |
|
BCT |
10 |
1.4+0.34·uwExt |
48 |
0.015 |
1.04 |

Fig. 4 Harvester productivity in dry metric tonnes per productive hour (odt·pmh-1), per average size of extracted trees (dry kg). In dark grey triangles, ST; in dark grey circles, BCT. Mean productivity per method is indicated with dashed lines
3.4 Predictive Models for the Harvester Productivity
Several predictive models were designed for each working method, some with variables that were known or could be decided beforehand (models 2, 4, 6) and others with variables that were measured in the field after thinning (models 1, 3, 5) (Table 8).
The best explanative variables for the harvester productivity depended on the method. For ST, GExt (%) showed good results along with the unit weight (especially the measured weight, uwExt in odkg·tree-1, over the estimated); whereas for BCT, dwExt (odt·ha-1) and uw0 (odkg·tree-1) were the best.
Models 3, 4 and 5 are nonlinear regressions, and the rest of the models were adjusted by linearization and change of variable. For the models 1 and 2, BC is a dummy variable, being dummy (=1) when BCT is considered and void for ST. Thus, in these two models, the difference between working methods will always be 1.146 and 1.035 odt·pmh-1 if the other variables are fixed, making the BCT method considerably more productive than the ST method: a 37% increment in model 1 and a 34% in model 2, using the mean values for the rest of explicative variables.
Looking into how much each explicative variable affects the dependent variable, model 1 is more sensitive to dwExt (118% and 78% variation in between the minimum and maximum values of the observed range, respectively, for ST and BCT), model 2 to uw0 (116% and 114%), model 3 to uwExt (91%) and model 4 to GExt(%) (30%).
Table 8 Predictive models for harvester productivity depending on working method
|
Model |
Method |
Nº obs² |
Equation for productivity odt·pmh-1 |
R² adj % |
p-value |
MAE odt·pmh-1 |
|
With variables measured after treatment ¹ |
||||||
|
1 |
For both |
20 |
-1.678+0.154·uwExt (odkg·tree-1)+0.148·dwExt (odt·ha¯1)+1.146·BC |
87.0 |
<0.001 |
0.35 |
|
3 |
ST |
9 |
0.238·GExt (%)0.213·uwExt0.949 |
96.5 |
– |
0.19 |
|
5 |
BCT |
10 |
-33.91+2.29·dwExt (odt·ha¯1) |
93.3 |
– |
0.25 |
|
With variables known or decided beforehand ¹ |
||||||
|
2 |
For both |
17 |
0.950+0.0071·GExt (%)·uw0(odkg·tree¯1)+1.035·BC |
76.7 |
0.0000 |
0.31 |
|
4 |
ST |
10 |
0.418·GExt (%)0.44·uw₀(odkg·tree¯1)0.153 |
27.7 |
– |
0.38 |
|
6 |
BCT |
8 |
e(1.26+0.46·uw₀ (odkg·tree-1) |
88.2 |
0.0005 |
0.27 |
|
¹ uwExt – unit dry weight removed, dwExt – total dry biomass weight removed GExt – Basal area removed in %, uw₀ – initial unit dry weight, BC – dummy variable for boom corridor ² In model 2, study units 11 (ST), 14 and 20 (BCT) were removed from the model. In model 3, the study unit 11 was excluded as it had a high studentized residue (–4.52). In model 6, study units 14 and 20 were removed as they also showed high studentized residuals |
||||||
4. Discussion
In this study, the BCT generally showed a significantly higher harvester productivity than ST. When calculating the harvester productivity, the difference between the best explaining factors for each method can be due to the different functioning of the method. In ST, the dry unit weight has a high influence in the ease of moving the head between the trees as it is easier to work with less density and bigger trees. The basal area removed also affects the number of trees to be avoided by the operator, thus affecting the time and productivity in ST. On the other hand, in BCT the basal area is not important as this thinning method is more systematic and does not need to spend time selecting and avoiding trees. Hence, the dry biomass weight removed per hectare becomes the best explaining variable. This variable will also be linked to the unit weight, but the equation works better when applied to an area and not to an individual tree. Moreover, in BCT, for the same amount of biomass extracted, less trees are felled – leaving a higher density standing – because when doing the corridors, bigger trees are also felled. This higher number of standing trees per hectare may be useful to diminish the impact of sprouting in Q. pyrenaica (Vericat et al. 2012).
Laina et al. (2013) performed a selective low thinning with a whole-tree harvesting system and a comparable harvester in Q. pyrenaica coppices in León with similar conditions as the one in this study. They had a felling plus bunching productivity that ranged from 2.8 to 3.9 odt·pmh-1, very similar to the results of the ST method in the present study. However, Tolosana et al. (2018) obtained a harvester productivity of 0.9–2.9 odt·pmh-1, which is slightly lower than that obtained in this study.
In Bergström et al. (2010, 2022), harvester productivity was 15–16% higher in BCT than in ST in boreal high forest conifer or mixed stands, with an average productivity of 4.0 odt·pmh-1 vs 4.6 odt·pmh-1 and 4.7 vs 5.4 odt·pmh-1, respectively for ST and BCT. These productivity values are significantly different from the mean values in the present study: 2.99 odt·pmh-1 in ST and 4.43 odt·pmh-1 in BCT, and an average 48.6% increase. This could be due to the average smaller Q. pyrenaica trees and higher density in this study, which makes it more difficult to maneuver; another reason could be the different stand type – other studies generally tried this method in high forests, mainly in boreal conifer stands, while this study was performed in a Q. pyrenaica coppice. This species is known for its high capacity of producing shoots and the way they form packed stools after being cut. This can lead to difficulties in cutting close shoots of the same stool, which results in more movement of the crane head to select the trees to be felled. This is a common barrier found in other works done in coppices (e.g., Schweier et al. 2015; Tolosana et al. 2018), which does not happen in high coniferous forests. Moreover, this effect could intensify in ST, as the machine operator would need to position the AFH in many different angles to be able to cut the selected shoots of a stool, leading to an increase of the time needed to fell and thus a pronounced decline in the ST method productivity. This, on the other hand, would not occur in BCT as it fells all the trees in the corridor, even taking advantage of the trees growing so close together as it could cut several trees at the same time.
Nonetheless, the main reason for the increase in productivity in BCT, if compared to ST, relies on the much greater size of the extracted trees, 42% heavier in BCT on average. If comparing productivity modeled values of each method for a common range of unit tree weight, the increase in productivity for BCT is far behind the initial comparison: 16–23%.
Regarding the observed productivity values, there may be room for improvement as BCT had not been tried before in this type of stand and the operator of the machine was new to this species, adding the possibility of future technological advances in the harvester and/or AFH.
Analyzing the time study, in ST, more time is dedicated to the felling in the stand than in BCT due to the selection, but the total felling time is pretty much the same as that in BTC, where more time is dedicated to felling in the road. The higher »moving« time in BCT could be due to the priority of the work elements: other work elements prevail over moving. In ST, moving along the strip road was comonly done while boom in or felling was occurring, while in BCT, the work elements did not overlap that much with »Moving«. Time spent in doing top bucking and bucking of the bunch depends more on the location than on the method, as it depends on tree height. Delays and miscellaneous (mainly cutting roots of uprooted trees) were equal for both methods. Comparing the time per tree extracted with the results of Bergström et al. (2022), the time spent in each task was consistently lower in this study, except in felling in the strip road in BCT. This could be due, again, to the trees in a Q. pyrenaica coppice growing closer together, which often enabled the machine to cut several trees at the same time.
Moreover, the average stump height was 25.4 cm (sd = 6.2) and 24.8 cm (sd = 5.6), respectively, for ST and BCT, with no significant difference between methods, which agrees with De la Fuente et al. (2022).
On the other hand, there is some uncertainty in the future response of Q. pyrenaica to these types of thinnings as the intensity and vigour of sprouts do not depend on the age of the stand; there is more competition when the trees are older and bigger, and thus a high mortality of the sprouts is expected. However, it does depend on the thinning intensity – the more intense thinning, the more vigorous sprouts (Valbuena-Carabaña et al. 2008, Vericat et al. 2012). Following this logic, the local practitioners' advice was to avoid strong thinnings and to use small machinery to reduce the strip road width. So, more research is needed to follow up the results of the reduced number of mechanized thinnings performed in these stands, and to be able to prescribe the most appropriate mechanization practices.
5. Conclusions
BCT generally showed a significant 48.6% increase in harvester productivity when compared to ST in Q. pyrenaica coppices under the studied conditions, mainly due to the 42% greater average unit weight of the extracted trees in BCT. When considering the common range for the unit tree weight, productivity was just 16–23% greater for BCT than for ST. Hence, when applying BCT, the intervention could become economically sustainable with a lower extracted biomass weight per ha than when applying ST. In addition, the residual stand did not show significant differences between methods except for the density left standing and the increase in the average DBH of trees left standing in ST, which is consistent with the above-mentioned greater weight.
The productivity values are similar or even higher than those found in other similar studies carried out in the León province in Q. pyrenaica. Nevertheless, ST and BCT performed with this machinery in Q. pyrenaica coppices are generally less productive than in similar trials done in other countries and types of stands, mainly high coniferous forests; however, in the present study, the time per felled tree is considerably lower, the reason probably lying in the fact that the trees in this study were smaller. On the other hand, the productivity gain using BCT under the studied conditions is similar and coherent with the experiences in other European stands.
Nevertheless, BCT productivity could still not be optimal to attain economic sustainability in the current Spanish market conditions. In further studies, it would be interesting to perform a cost analysis to determine the possible economic opportunities and pitfalls of this intervention. Moreover, it would be valuable to do a follow-up study of the intervened study units in the following years in order to analyze the sprouting and development of the stand.
Acknowledgments
This study was supported by the European Union's Horizon 2020 Research and Innovation programme, which has funded the project Smallwood (http://www.smallwood.eu/), through the ERA-NET Cofund 465 action »ForestValue – Innovating the forest-based bioeconomy«, under grant agreement number 773324. The Spanish Ministry of Science and Innovation (Project 464 PCI2019-103673), national Spanish financer of the project, is also acknowledged.
The authors are grateful to the Forest Administration of Castilla y León Region for supporting treatments on terrain in the forests under their management; Javier Ezquerra, Íñigo Oliagordia, Rafael García González, Isabel García-Álvarez and the rest of their staff, to whom we are indebted; the enterprise SOMACYL for helping with the forwarding, chipping and transporting of the biomass, and Rubén García and Carlos Martínez-Torres, who were in charge of operations, and the rest of the personnel from this company, to whom we are grateful; Kjell Törnqvist, for driving the harvester and carrying out the thinnings; Pedro Pérez Nogués, for his valuable assistance during fieldwork; and, last but not least, the Small Local Corporation of Villar de Ciervos that owned the forest stand where the experiments were performed, for authorizing the experiments and helping with practical issues. We would also like to thank the two anonymous reviewers whose comments helped improve and clarify this manuscript.
6. References
Adame, P., Cañellas, I., Roig, S., del Río, M., 2006: Modelling dominant height growth and site index curves for rebollo oak (Quercus pyrenaica Willd.). Annals of Forest Science 63(8): 929–940. https://doi.org/10.1051/forest:2006076
Albizu-Urionabarrenetxea, P.M., Tolosana-Esteban, E., Roman-Jordan, E., 2013: Safety and health in forest harvesting operations. Diagnosis and preventive actions. A review. Forest Systems 22(3): 392–400. https://doi.org/10.5424/FS/2013223-02714
Becker, G., Unrau, A., 2018: Coppice Forests in Europe – A Traditional Landuse with New Perspectives. In A. Unrau, G. Becker, R. Spinelli, D. Lazdina, N. Magagnotti, V.-N. Nicolescu, P. Buckley, D. Bartlett, P. D. Kofman (Eds.), Coppice Forests in Europe: 18–21 p. Albert Ludwig University, Freiburg.
Bergström, D., Bergsten, U., Nordfjell, T., Lundmark, T., 2007: Simulation of geometric thinning systems and their time requirements for young forests. Silva Fennica 41(1): 137–147. https://doi.org/10.14214/sf.311
Bergström, D., Bergsten, U., Nordfjell, T., 2010: Comparison of Boom-Corridor Thinning and Thinning From Below Harvesting Methods in Young Dense Scots Pine Stands. Silva Fennica 44(4): 669–679.
Bergström, D., Fernandez-Lacruz, R., de la Fuente, T., Höök, C., Malinen, J., Nuutinen, Y., Triplat, M., Nordfjell, T., 2022: Effects of boom-corridor thinning on harvester productivity and residual stand conditions. International Journal of Forest Engineering 33(3): 226–242. https://doi.org/10.1080/14942119.2022.2058258
Blombäck, P., Poschen, P., Lövgren, M., 2003: Employment Trends and Prospects in the European Forest Sector. Geneva Timber and Forest Discussion Papers. European Forest Sector Outlook Study (EFSOS).
Cañellas, I., del Río, M., Roig, S., Montero, G., 2004: Growth response to thinning in Quercus pyrenaica Willd. coppice stands in Spanish central mountain. Annals of Science 61(3): 243–250. https://doi.org/10.1051/forest:2004017
Di Fulvio, F., Kroon, A., Bergström, D., Nordfjell, T., 2011:. Comparison of energy-wood and pulpwood thinning systems in young birch stands. Scandinavian Journal of Forest Research 26(4): 339–349. https://doi.org/10.1080/02827581.2011.568951
De la Fuente, T., Bergström, D., Fernandez-Lacruz, R., Hujala, T., Krajnc, N., Laina, R., Nordfjell, T., Triplat, M., Tolosana, E., 2022: Environmental Impacts of Boom-Corridor and Selectively Thinned Small-Diameter-Tree Forests. Sustainability 14(10): 6075. https://doi.org/10.3390/SU14106075
González, V., Tolosana, E., Ambrosio Y., Laina R., Vignote S., 2014: Manual de Mecanización de los Aprovechamientos Forestales. Ed. Mundiprensa, 374 p.
Junta de Castilla y León, 2007: Tercer Inventario Forestal Nacional (1997–2006) – Castilla y León.
Junta de Castilla y León, 2011: Plan regional de ámbito sectorial de la bioenergía de Castilla y León, 1–186 p.
Kärhä, K., Jouhiaho, A., Mutikainen, A., Mattila, S., 2005: Mechanized Energy Wood Harvesting from Early Thinnings. International Journal of Forest Engineering 16(1): 15–25. https://doi.org/10.1080/14942119.2005.10702504
Laina, R., Tolosana, E., Ambrosio, Y., 2013: Productivity and cost of biomass harvesting for energy production in coppice natural stands of Quercus pyrenaica Willd. in central Spain. Biomass and Bioenergy 56: 221–229. https://doi.org/10.1016/j.biombioe.2013.04.016
Montero, G., Ruiz-Peinado, R., Muñoz, M., 2005: Producción de Biomasa y Fijación de CO2 Por Los Bosques Españoles. Monografías INIA: Serie Forestal, nº 13, 271 p. Instituto Nacional de Investigación y Tecnología Agraria y Alimentaria Ministerio de Educación y Ciencia: Madrid, Spain.
Moreno-Fernández, D., Aldea, J., Gea-Izquierdo, G., Cañellas, I., Martín-Benito, D., 2021: Influence of climate and thinning on Quercus pyrenaica Willd. coppices growth dynamics. European Journal of Forest Research 140(1): 187–197. https://doi.org/10.1007/S10342-020-01322-3
Salomón, R., Rodríguez-Calcerrada, J., González-Doncel, I., Gil, L., Valbuena-Carabaña, M., 2017: On the general failure of coppice conversion into high forest in Quercus pyrenaica stands: a genetic and physiological approach. Folia Geobotanica 52(1): 101–112. https://doi.org/10.1007/S12224-016-9257-9
Sängstuvall, L., Bergström, D., Lämås, T., Nordfjell, T., 2012: Simulation of harvester productivity in selective and boom-corridor thinning of young forests. Scandinavian Journal of Forest Research 27(1): 56–73. http://dx.doi.org/10.1080/02827581.2011.628335
Schweier, J., Spinelli, R., Magagnotti, N., Becker, G., 2015: Mechanized coppice harvesting with new small-scale feller-bunchers: Results from harvesting trials with newly manufactured felling heads in Italy. Biomass and Bioenergy 72: 85–94. https://doi.org/10.1016/j.biombioe.2014.11.013
Spinelli, R., Cacot, E., Mihelic, M., Nestorovski, L., Mederski, P., Tolosana, E., 2016: Techniques and productivity of coppice harvesting operations in Europe: ameta-analysis of available data. Ann. For. Sci. 73(4): 1125–1139. https://doi.org/10.1007/s13595-016-0578-x
Tolosana, E., Spinelli, R., Aminti, G., Laina, R., López-Vicens, I., 2018: Productivity, Efficiency and Environmental Effects of Whole-Tree Harvesting in Spanish Coppice Stands Using a Drive-to-Tree Disc Saw Feller-Buncher. Croatian Journal of Forest Engineering 39(2): 163–172.
Tolosana, E., 2021: Chapter II: Madera en rollo (Roundwood). In González, V., Ortuño, S. (Coord.): »La estructura económica del sector forestal en España 2000–2020« 27–41 p. Ed. Ministerio para la transición ecológica y el reto demográfico, 319 p.
Valbuena-Carabaña, M., González-Martínez, S.C., Gil, L., 2008: Coppice forests and genetic diversity: A case study in Quercus pyrenaica Willd. from Central Spain. Forest Ecology and Management 254(2): 225–232. https://doi.org/10.1016/j.foreco.2007.08.001
Vericat, P., Pique, M., Serrada, R., 2012: Gestión adaptativa al cambio global en masas de Quercus mediterráneos. Centre Tecnològic Forestal de Catalunya: Catalonia, Spain.
Witzell, J., Bergström, D., Bergsten, U., 2019: Variable corridor thinning – a cost-effective key to provision of multiple ecosystem services from young boreal conifer forests? Scandinavian Journal of Forest Research 34(6): 497–507. https://doi.org/10.1080/02827581.2019.1596304
© 2023 by the authors. Submitted for possible open access publication under the
terms and conditions of the Creative Commons Attribution (CC BY) license (http://creativecommons.org/licenses/by/4.0/).
Authors' addresses:
Lucía Herguido-Sevillano, MSc
e-mail: luciahersev@gmail.com
Prof. Eduardo Tolosana, PhD *
e-mail: eduardo.tolosana@upm.es
Prof. Rubén Laina, PhD
e-mail: ruben.laina@upm.es
Teresa de la Fuente, PhD
e-mail: maria_teresa_fuente@yahoo.com
Universidad Politécnica de Madrid (UPM)
ETSI Montes, Forestal y del Medio Natural
Dpto. Ingeniería y Gestión Forestal y Ambiental
Avenida Ramiro de Maeztu s/n
28040, Madrid
SPAIN
Prof. Dan Bergström, PhD
e-mail: dan.bergstrom@slu.se
Prof. Tomas Nordfjell, PhD
e-mail: tomas.nordfjell@slu.se
Swedish University of Agricultural Sciences (SLU)
Department of Forest Biomaterials and Technology
Skogsmarksgränd, 17
907 36, Umeå
SWEDEN
Raúl Fernandez-Lacruz, PhD
e-mail: raul.fernandezlacruz@skogforsk.se
The Forestry Research Institute of Sweden (Skogforsk)
Tomterna, 1
918 21, Sävar
SWEDEN
* Corresponding author
Received: June 15, 2022
Accepted: November 16, 2022
Original scientific paper