Infrastructure Requirements for Clear-Fell Harvesting of Small-Scale Plantation Forests in New Zealand
doi: 10.5552/crojfe.2024.2185
volume: 45, issue:
pp: 9
- Author(s):
-
- Allum Jacob
- Harvey Campbell
- Visser Rien
- Hoffmann Stephan
- Article category:
- Original scientific paper
- Keywords:
- forest infrastucture, small-scale forestry
Abstract
HTML
Background: Small-scale forests (woodlots) increasingly account for a greater proportion of the total annual harvest in New Zealand. There is limited information on the extent of infrastructure required to harvest a woodlot; road density (trafficable with log trucks), landing size, or the average harvest area that each landing typically services.
Methods: This study quantified woodlot infrastructure averages and evaluated influencing factors. Using publicly available aerial imagery, roads and landings were mapped for a sample of 96 woodlots distributed across the country. Factors such as total harvest area, average terrain slope, length/width ratio, boundary complexity and extraction method were recorded and investigated for correlations.
Results: The average road density was 25 m/ha, landing size was 3000 m2 and each landing was serviced on average 12.8 ha. Notably, 15 of the 96 woodlots had no internal infrastructure, with the harvest completed using roads and landings located outside of the woodlot boundary. Factors influencing road density were woodlot length/width ratio, average terrain slope and boundary complexity. Landing size was influenced by average terrain slope, woodlot length/width ratio, and woodlot area.
Conclusion: The results provide a contemporary benchmark of the current infrastructure requirements when harvesting a small-scale forests in New Zealand. These may be used at a high level to infer the total annual infrastructure investment in New Zealand’s woodlot estate and also project infrastructure requirements over the foreseeable future.
Infrastructure Requirements for Clear-Fell Harvesting of Small-Scale Plantation Forests in New Zealand
Jacob Allum, Campbell Harvey, Rien Visser, Stephan Hoffmann
Abstract
Background: Small-scale forests (woodlots) increasingly account for a greater proportion of the total annual harvest in New Zealand. There is limited information on the extent of infrastructure required to harvest a woodlot; road density (trafficable with log trucks), landing size, or the average harvest area that each landing typically services.
Methods: This study quantified woodlot infrastructure averages and evaluated influencing factors. Using publicly available aerial imagery, roads and landings were mapped for a sample of 96 woodlots distributed across the country. Factors such as total harvest area, average terrain slope, length/width ratio, boundary complexity and extraction method were recorded and investigated for correlations.
Results: The average road density was 25 m/ha, landing size was 3000 m2 and each landing was serviced on average 12.8 ha. Notably, 15 of the 96 woodlots had no internal infrastructure, with the harvest completed using roads and landings located outside of the woodlot boundary. Factors influencing road density were woodlot length/width ratio, average terrain slope and boundary complexity. Landing size was influenced by average terrain slope, woodlot length/width ratio, and woodlot area.
Conclusion: The results provide a contemporary benchmark of the current infrastructure requirements when harvesting a small-scale forests in New Zealand. These may be used at a high level to infer the total annual infrastructure investment in New Zealand's woodlot estate and also project infrastructure requirements over the foreseeable future.
Keywords: forest infrastucture, small-scale forestry
1. Introduction
Small-scale plantation forests (woodlots) are an important wood resource for the broader New Zealand forestry industry. Woodlots up to 500 hectares account for 463 000 hectares, or 27% of the national plantation estate (Ministry for Primary Industries 2019). In 2019, woodlots accounted for approximately 40% of the national harvest. Annual woodlot harvest yield is projected to be approximately 15 000 000 m3 per annum through to 2035 (New Zealand Forest Owners Association 2020a). Woodlots are often more expensive to harvest, especially without the existing harvesting infrastructure (Indufor 2016). During periods with poor log markets, it becomes particularly important to rationalise infrastructure costs in preparation for harvesting (Manley et al 2017).
Previous mapping studies of small-scale forests in New Zealand define one as containing less than 1000 planted hectares (Manley et al 2017, Manley et al 2020). Government reports such as the Wood Availability Forecast adopt the same definition (Ministry for Primary Industries 2016). Murphy and Visser (2019) developed a woodlot costing for New Zealand conditions defining woodlots as occupying less than 500 hectares. In other regions of the world a definition with a smaller scale may be more suitable, for example Wierum et al (2015) suggest 100 hectares as an upper limit for a definition of a small scale forest.
For woodlots planted on steep, erosion-prone, challenging terrain, at a considerable distance from the market, infrastructure costs are a critical driver for the economic feasibility of a harvest operation (Manley et al 2020). Advanced planning can ensure that the harvesting infrastructure is »fit for purpose« while minimising the environmental impact (New Zealand Forest Owners Association 2020b); however, planning often cannot bridge an economy-of-scale gap that benefits larger plantations. Profitability from the harvest of woodlots justifies a decision to continue the land-use, while also encouraging pastoral farm owners to diversify farm incomes with further forestry (Murphy and Visser 2019).
Roads are a significant capital investment in a production forest. A 2018 survey of New Zealand forestry companies showed that the construction cost of spur roads (single lane access to a landing) was on average NZ$ 72,000 /km, whereas the cost of higher standard secondary roads was on average NZ$ 90,000 /km (Brown and Visser 2018). Total roading construction costs in any forest depends on the length, road standard, topography, and soil type, with aggregate for surfacing being a notable cost component when sourced from outside the forest (Murphy and Visser 2019). In contrast, woodlot roads were found to cost less than NZ$ 40,000 /km on average, reflecting design standards for lower design traffic volume.
Petherick (2014) completed a survey using geospatial imagery to measure in-forest infrastructure by area for the North Island. The results showed that on average 4.2% of a plantation forest area is occupied by infrastructure facilities.
Road density can be defined as the number of lineal metres of road per hectare forested. A common concept is that of an optimum roading density, where the cost of building roads is offset by an associated reduction in harvesting costs (Ryan et al 2004). While many publications discuss the need to optimise road density, few have published road density averages. A brief survey of nineteen small scale forest road networks in New Zealand during 2012 yielded an average of 28 m/ha (Park et al. 2012). In the alpine region of Europe, road densities of 38–51 m/ha are required to reduce extraction distances and rationalise cable logging costs (Ghaffariyan et al. 2010, Toscani et al. 2020). In comparison, eastern European forest road densities are often less than 15 m/ha (Borz 2020).
Landings are designated areas for processing, sorting, and loading out the extracted timber. A landing is generally stripped of topsoil, compacted, flat, contiguous and linked to a road capable of passing log trucks. Landings are designed, located, and managed to balance the needs of safety, environment, production, product quality and value recovery (New Zealand Forest Owners Association 2020b). Depending on terrain, landing construction costs in 2011 were reported to range from NZ$ 3000 to NZ$ 5500 in a comprehensive survey of 142 landings (Visser et al. 2011). More recent anecdotal reports indicate landing construction costs in steep terrain can now regularly exceed NZ$ 20,000, but over NZ$ 50,000 per landing in steep and challenging terrain (Costello pers. comms. 2022). Visser et al (2011) reported the average New Zealand landing area to be 3900 m2, ranging from 1370 to 12,450 m2. This was a substantial increase from an average of 2900 m2 reported by Raymond (1987). Both studies showed a correlation between harvesting productivity and landing size, while the 2011 study also identified the number of log sorts, harvest type and age of landing affecting harvesting productivity.
The objective of this study was to quantify road and landing infrastructure built within the boundaries of a sample of harvested New Zealand woodlots. A secondary objective was to evaluate what factors drive these results.
2. Method
Woodlots were selected from a University of Canterbury database of small-scale forests (Manley et al 2017, Manley et al 2020). The database was created by manual interpretation of publicly-available aerial imagery at 1:4000 scale or greater. Qualifying woodlots were >1 ha of contiguous plantation, >30 m in width and also in a harvested state (as recorded on the small-scale forest database). Imagery resolution ranged from 0.125 to 0.75 m.
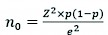
An appropriate sample size was calculated using Cochran's formula determined by Eq. (1) based on a confidence level of 95%, a 10% level of precision and the population degree of variability conservatively set to 0.5.
 (1)
(1)
Where:
n0 required sample size
Z Z-value corresponding to a selected confidence level
e desired level of precision
p estimated degree of variability in the population.
This resulted in a desired sample size of 96 woodlots. However, woodlots are not distributed evenly across New Zealand's nine wood supply regions. To ensure that the study was representative of the actual spread of woodlots throughout the country, the 96 samples were divided across the nine wood supply regions pro-rata, based on the regions' proportion of the national woodlot estate (Table 1). Regions with less than 10% were combined with neighbouring regions, specifically West Coast was combined with Nelson/Marlborough, and East Coast was added to Hawkes Bay. Within each region, the samples were divided across three woodlot size classes (1–39 ha, 40–99 ha and 100–499 ha) pro-rata, by the proportion of the regions' woodlots falling into each size class.
Table 1 Number of samples from each wood supply region
|
Wood Supply Region |
% of total woodlot area, ha |
# of samples |
|
Northland |
12.0% |
11 |
|
CNI |
18.0% |
17 |
|
Hawkes Bay/East Coast |
13.4% |
13 |
|
SNI |
19.2% |
18 |
|
Nelson/Marlborough/West Coast |
12.3% |
12 |
|
Canterbury |
10.8% |
10 |
|
Otago/Southland |
14.5% |
14 |
|
Total |
100% |
96 |
Datasets used for the analysis were:
University of Canterbury's small-scale forest polygon shapefile (Manley et al 2017, Manley et al 2020)
Land Information New Zealand's 8 m resolution Digital Elevation Model (DEM), from which a slope model raster was derived (at the same resolution)
Land Information New Zealand's New Zealand Soil Classification map
Latest Google Earth aerial imagery as of March 2020.
ArcGIS was used to collect woodlot area, perimeter, and average terrain slope data. Average terrain slope was derived using the inbuilt »zonal statistics as table« toolbox function, with the slope model raster and woodlot polygon shapefile as the inputs. Boundary complexity was calculated as the ratio of woodlot area (m2) to woodlot perimeter (m). Google Earth was used to interpret extraction method visually. Radially converging lines on a landing combined with steep terrain typically indicate cable extraction.
Measurements were made in Google Earth of internal infrastructure and the woodlots length-to-width ratio. For all measurements, manual inference was used to determine the locations where measurements start and end. Historical imagery was used to help assessing the change between years. Additionally, once a measurement was taken or road/landing plotted, a full 360° view of the measurement/plot was completed to minimise the chance of error.
Length-to-width ratio was found by using Google Earth line measuring function and interpretation of the latest publicly available aerial imagery. The longest, continuous line within the woodlot was measured and recorded, along with the bearing of that line. The largest width was then found at an angle, perpendicular to the longest line. An example of this process is shown in Fig. 1, where the yellow lines represent the woodlot length and width. The length measurement was taken at a bearing of 352°, therefore, the width measurement was taken at a perpendicular bearing of 82° at the widest section.
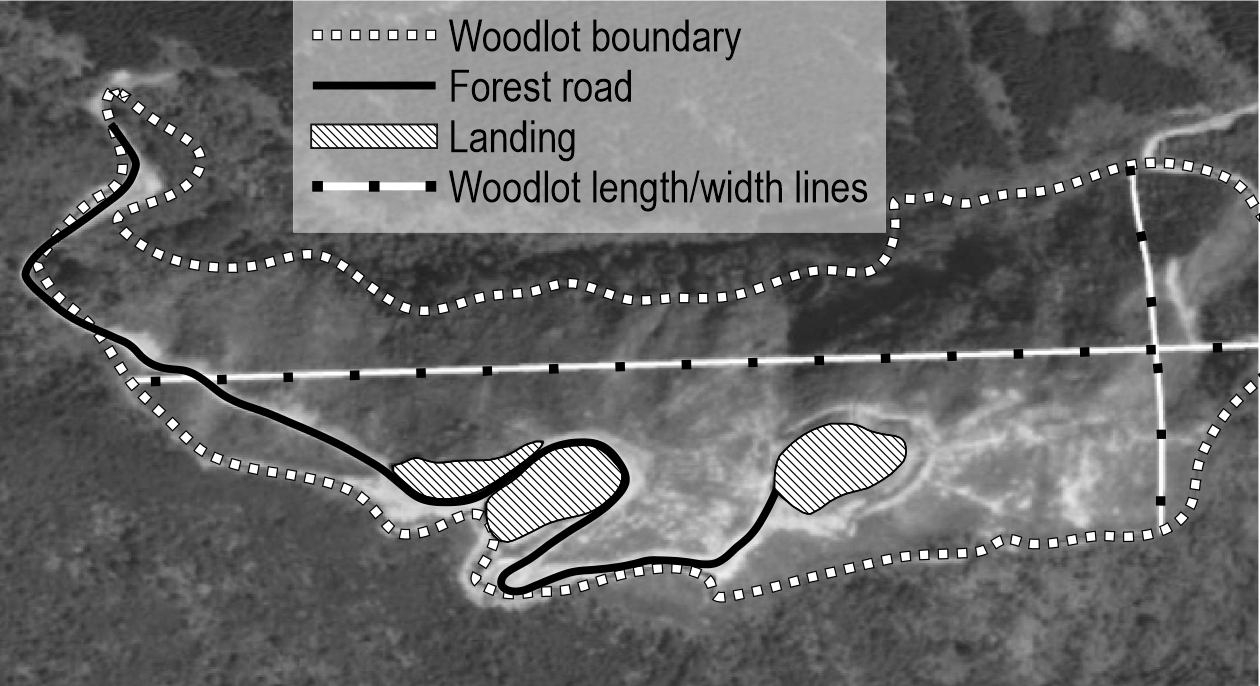
Fig. 1 Example woodlot with boundary, infrastructure and dimensions delineated
The number of landings within each woodlot were recorded. A landing was defined as any stripped, flat and contiguous area that had been definitively used for harvesting trees. The area of each landing was found using Google Earth measurement tools, by plotting a polygon around each landing site. If a road passed through a landing, the road was included as landing area. If a road ran alongside a landing, it was excluded. Where the landing edge was unclear (i.e. due to erosion or slash) historical imagery was used to determine the landing edge with greater clarity, in addition to the 360° assessment. Fig. 1 shows two landings in one woodlot (hatched area). The outer ring of the right-hand landing was determined to be a slash bench, and not part of the flat working surface of the landing.
Using the »path« function in Google Earth, roads within the woodlots were plotted. Roads were defined as linear infrastructure, designed for trafficking by log trucks. Roads are typically differentiated from harvesting tracks by their gradient, gradual corners, drainage controls and application of an aggregate layer. When plotting road paths, the plots were made along the road centre. Only roads within the woodlot boundary were plotted, apart for two notable exceptions:
if the road briefly passed outside and back inside the woodlot boundary
if the road conformed to a woodlot boundary and was deemed necessary to harvest the woodlot in question.
To explain whether any independent variables influence the dependent variables, multivariate stepwise regressions were conducted using four independent numerical infrastructure variables (area, average slope, length/width ratio, and boundary complexity).
3. Results and Analyses
From the 96 woodlots across New Zealand, the overall average road density was 25.2 m/ha (±3.6 m/ha at 95% confidence level), the average landing size 3000 m2 (±230 m2), and the harvest area serviced by the average landing was 12.8 ha (±1.8 ha). A total of 15 woodlots contained no qualifying road infrastructure within woodlot boundaries. Whether these 15 woodlots are included in the national average road density calculation has a significant impact on the value. When included, the average road density is 25.2 m/ha, and when excluded, the average road density is 29.9 m/ha; a 4.7 m/ha difference.
Table 2 Average woodlot infrastructure values and landing service areas across all sites
|
Variable |
Number |
Average |
5th Percentile |
95th Percentile |
|
Road density, m/ha |
96 |
25.2 |
0.0 |
52.8 |
|
Landing size, m2 |
389 |
3210 |
1435 |
5524 |
|
Landing service area ha/landing |
96 |
12.8 |
2.7 |
27.7 |
Table 2 also shows a very large range in the data between the 5th and 95th percentile, and this reflects the variability of woodlots. A histogram of the 96 road density results shows a slightly bimodal nature of the data. Fifteen measures of 0 m/ha contribute to the left-most bar, with the remaining data conforming to a normal distribution.
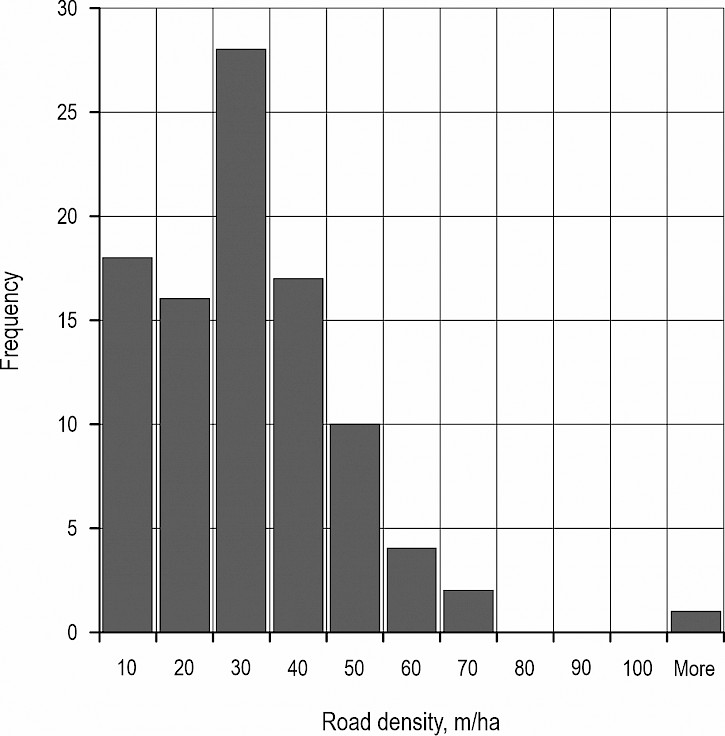
Fig. 2 Distribution of woodlot road densities (n=96)
Most woodlots contained multiple landings, and with this larger number of landing measures, the data does conform nicely to a normal distribution (Fig. 3).
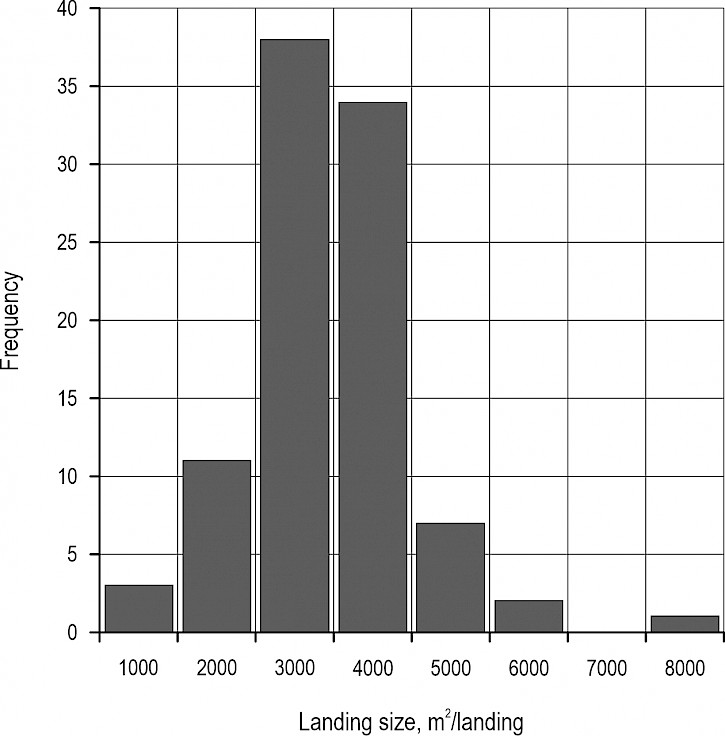
Fig. 3 Distribution of woodlot landing sizes (n=389)
Fig. 4 describes the distribution of average landing service area, and for this data there is a notable right-hand skew. While the majority of landing service areas are below 30 ha, there are five values greater than 30 ha. By all interpretations, these are very large harvest areas.
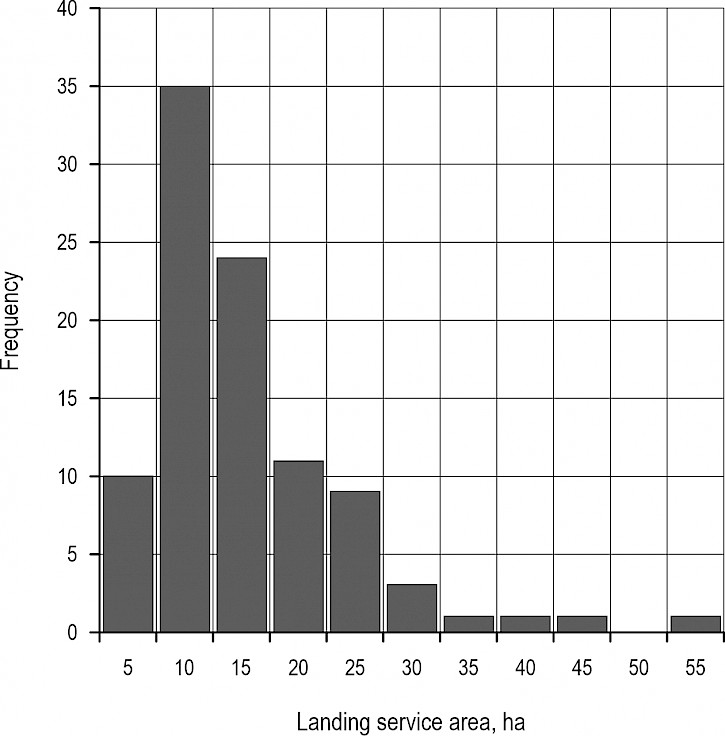
Fig. 4 Distribution of average landing service area in woodlots
Average values for the numerical independent variables are detailed in Table 3.
Table 3 Average values for independent variables (n=96)
|
Variable |
Average |
5th Percentile |
95th Percentile |
|
Woodlot area, ha |
67.2 |
2.7 |
204.5 |
|
Ave. slope, % |
41.1 |
1.9 |
75.3 |
|
Length/Width ratio |
2.4 |
1.1 |
4.4 |
|
Boundary complexity |
93.3 |
34.4 |
212.1 |
With regard to the effect of the four independent variables measured, stepwise multivariate regression against the road density showed no correlation with woodlot area, but sgnificant correlations with average slope, length/width ratio and boundary complexity (p<0.001, <0.001 and 0.012, respectively). Eq. 2 shows the relationship between the variables and road density (R2=0.30).
 (2)
(2)
Similarly, the area, average slope and length/width ratio (p=0.022, <0.001 and 0.017, respectively) were significantly correlated with landing size (R2=0.19).
 (3)
(3)
The best model to present a relationship with the harvest area included all four parameters. Woodlot area (p=0.045) and boundary complexity (p=0.0051) were significant. Although the average slope (p=0.053) and length/width ratio (p=0.07) were just outside of the p=0.5 threshold, a drop in model accuracy from R2=0.37 with all four variable means that they were retained for the equation.
 (4)
(4)
Out of a total of 96 woodlots, 58 used ground-based extraction, 34 used cable yarders (and 4 used both methods) (Table 4). Noteworthy is the higher road density, slightly smaller landing area and landing service area for cable yarder harvests. The large range of variability in the measures means that there was no significant difference between the two extraction methods for all infrastructure variables.
Table 4 Infrastructure averages for different primary extraction methods
|
Infrastructure variable |
Ground-based |
Yarder |
|
Road density, m/ha (including zero results) |
20.8 |
32.4 |
|
Road density, m/ha (excluding zero results) |
27.4 |
33.4 |
|
Landing area, m2 |
3120 |
2790 |
|
Average landing service area, ha/landing |
13.1 |
11.9 |
The data was also evaluated at the regional level. While showing some level of differentiation, overall the averages for each region are similar (Table 5). As expected, given the lower number of samples per region, ANVOA revealed no significant differences between regions.
Table 5 Average woodlot infrastructure by wood supply region
|
Wood supply region |
# of Samples |
Road density ave., m/ha |
Landing size ave. m2 |
Landing service area ave. ha/landing |
|
|
Including zero results |
Excluding zero results |
||||
|
Northland |
11 |
24.0 |
24.0 |
3360 |
14.5 |
|
CNI |
17 |
25.2 |
26.7 |
3280 |
11.7 |
|
East Coast/H.Bay |
14 |
22.3 |
31.8 |
2765 |
9.7 |
|
SNI |
18 |
27.5 |
33.0 |
2660 |
8.2 |
|
Nel/Mar/W.Coast |
12 |
34.8 |
42.5 |
3020 |
15.3 |
|
Canterbury |
10 |
18.0 |
25.8 |
2750 |
18.1 |
|
Otago/Southland |
14 |
22.8 |
26.6 |
3190 |
16.9 |
|
New Zealand |
96 |
25.2 |
29.9 |
3000 |
12.8 |
4. Discussion
Road density varied significantly across the studied sites. A significant number of woodlots had no internal roading. These woodlots had a landing located on the woodlot boundary, and all wood could be extracted using skidder trails, or in one case, by yarder. When the 15 woodlots were included in the road density average, the value was 25.2 m/ha; when they were excluded, the average value was 29.9 m/ha - a difference of 15.6%. Fourteen of the fifteen woodlots with no road internal roads were less than 15 hectares in size, and 80% were below 10 hectares in size. Overall, these fifteen woodlots had an average area of 6.2 hectares. This result suggests multiple points. It indicates that small-scale forest owners may be reluctant to put permanent infrastructure in place. It may also indicate that the planning horizon does not extend to the following rotation. In the case of a long-term, multiple rotation planning horizon, the cost of permanent infrastructure is spread over multiple rotations making the installation of permanent infrastructure more appealing than when the cost is borne for a single rotation. With a short planning horizon, avoidance of infrastructure construction costs makes economic sense to the current forest owner.
For the other two infrastructure variables, the following averages were calculated. The average landing size was found to be 3000 m2, and the average landing service area was found to be 12.8 ha/landing. Understanding the harvest area and landing services on average within woodlots in New Zealand could be of use to harvest planners and forest owners at high level. Average landing service area should give an estimate of how many landings are potentially required to harvest a given woodlot area.
The regional averages should be used with caution. Based on Cochran's formula, 96 samples were taken nationally to achieve a confidence level of 95±10%. Breaking this dataset down into regions decreases the confidence in any region. To make any reliable claims at the regional level, a further study focussing on regional analyses would be necessary.
The regression analyses helped meet the secondary objective of the study, identifying which factors influenced the infrastructure averages. There was a total of six independent variables assessed for influence on the infrastructure variables. Of the six independent variables, four were numerical, and two were non-numerical. A summary of the independent variables that had a significant influence on the infrastructure variables is shown below in Table 6.
Table 6 Independent variables significantly correlated with infrastructure variables. Variables are ranked in terms of significance, with 1 being the most significant
|
Independent variable |
Road density |
Landing size |
Landing service area |
|
Area, ha |
3 |
2 |
|
|
Average slope, % |
2 |
1 |
|
|
L/W ratio |
1 |
2 |
|
|
Boundary complexity |
3 |
1 |
|
|
Extraction method |
While some relationships where predictable, such as average terrain slope on landing area, others were not. Length-to-width ratio was not predicted to have as much influence as was found, yet it had the strongest relationship with roading density and second strongest relationship with landing size. Length-to-width ratio likely yielded the strongest relationship with road density due to cases of long woodlots with entry points at the far end. If this effect is coupled with the woodlot being narrow (high length-to-width ratio), the result is a small area with a considerable length of road (high road density). This differs from terrain slope which was predicted to have an influence on both road density and landing size; which it did. Several woodlots were located on flat terrain, and had larger than average landings. This is likely because the landings were measured post-harvest. Landing dimensions tend to increase throughout harvest, where space allows. With flat sites, it is easier to expand the landing, as opposed to a steep site, where earthworks are likely required. Similar to its relationship with road density, boundary complexity was not predicted and had no a significant relationship with landing service area.
Yarder sites have higher road density, smaller landings and smaller landing service areas than ground-based harvest sites. However, the differences between the two are not significant in terms of statistical testing. The increased landing area size for ground-based extraction could relate to the average slope influence on landing size, shown in the regression. However, the t-tests found no significant difference in comparing the means of the infrastructure values for varying extraction methods. Further investigation into the averages of these extraction methods would be useful in the future.
The results of this study should be put in context with previous publications. In this study, the average landing size for woodlots was found to be 3000 m2. The 2010 study found the landing size to be 3900 m2 (Visser et al. 2010), and the 1987 study found the average landing size to be 2900 m2 (Raymond 1987). Both previous studies included a range of forest sizes and included plantations larger than 500 hectares in size. A direct comparison cannot be made based on forest size, although the results align well. The 2010 study found the main drivers of the landing size to be number of log sorts and production. The 1987 study found similar drivers, with the addition of piece length. These variables were not measured in this study as they required in-depth information on the harvest. Interestingly, the 1987 study also found that the extraction method had no significant influence on landing size, in agreement with this study. The influences found in the 1987 and 2010 studies could explain why the regression model produced an R-squared value of 0.19 for landing size. By including the significant variables found in the previous studies, the model would likely be improved. The 1987 study also found a wide variation of landing sizes – a similar observation could not yet be explained by the variables captured in this study. Soil type did influence landing size in the 1987 study, and no link could be shown in this study either. This is likely due to the fact that the comparison was done through a regional analysis that was based upon the prominent soils in those regions, rather than the specific soils on the sites sampled. This highlights the need for a more detailed regional analysis.
Average values for road density in the New Zealand context are hard to find. A road engineering manual produced in Ireland (Ryan et al. 2004) stated that road density relates to the planned harvesting and extraction methods used. On the contrary, this study found no influence of extraction method on road density in woodlots.
4.1 Limitations to This Study
There were several limitations to this study. Aerial image clarity presented some issues for selecting viable woodlot samples. Clarity issues that resulted in the impossibility to assess the infrastructure of a woodlot include:
temporal gaps in historical imagery (i.e. the woodlot was »in awaiting« (for planting) status in 2016, yet historical imagery could only be accessed for 2014 and 2018)
occlusion due to cloud cover or shadows
dark blue/black image quality
blurred landing boundaries due to slash or erosion.
If any of these image clarity issues were encountered for a particular woodlot, the woodlot would be resampled. Some clarity issues were common to an area (for example with cloud cover or poor blue/black image quality), meaning all woodlots within that affected area would be excluded from analysis.
In several cases, landing boundary was difficult to determine. If there was excessive slash stored on the edge of a landing, or erosion had occurred on steep sites, the boundary was blurred and determining the exact landing extents became difficult. These cases required careful judgement, with historical imagery used to determine the relevant boundary. Some level of error in interpretation is expected in these cases.
5. Conclusion
The main objectives of this study were to quantify average values for key infrastructure required to harvest small-scale woodlots in New Zealand, and to evaluate which variables drive these averages.
The primary objective was met, and the infrastructure averages gained were as follows: road density (0 m/ha samples included) = 25.2 metres/hectare, road density (0 m/ha samples excluded) = 29.9 metres/hectare, landing size = 3000 m2, and landing service area = 12.8 hectares/landing. Of the two road density values reported, the second value is more beneficial as it should be determined early in the harvest planning stage if roads are required in a woodlot. Where roads are required, it makes little sense to use an average value that includes 15 samples that recorded a road density of 0 metres/hectare, in turn lowering the average.
The secondary objective was also met; however, only some of the variables influencing the average values stated above were found. The six variables assessed for their influence were: area (ha), average slope (%), length/width ratio, boundary complexity, extraction method, and soil type. From the most influential to the least, the following relationships were found. Road density has a significant relationship with length-to-width ratio, average terrain slope (%), and boundary complexity. Landing size has a significant relationship with average terrain slope (%), length-to-width ratio, and woodlot area (ha). Finally, landing service area has a significant relationship with boundary complexity and woodlot area (ha).
The results gained from this study appear reliable based on some similarities with previous New Zealand studies. The average values for infrastructure have the potential to be beneficial to industry and government for projecting future development and investment in woodlot infrastructure. Through finding which of the assessed variables influence the averages, the forestry industry could be further benefited by using these relationships to assist in cost reduction, which is becoming increasingly important as large numbers of woodlots planted in the 1990s reach economic maturity.
Acknowledgements
Special thanks to Glen Murphy who helped develop this project idea, also Vega Xu and Bruce Manley for supplying the dataset of mapped woodlots. The lead author would also like to acknowledge the support of the family of John Dey and the NZIF Foundation for the financial support for this project.
6. References
Borz, S., 2020: Forest Roads in Europe. Forest Roads: Regional perspectives from around the world. K. Lyons. Online, International Union of Forest Research Organisations.
Brown, K., Visser, R., 2018: Adoption of emergent technology for forest road management in New Zealand. New Zealand Journal of Forestry 63(3): 23–29.
Ghaffariyan, M.R., Stampfer, K., Sessions, J., 2010: Optimal road spacing of cable yarding using a tower yarder in Southern Austria. European Journal of Forest Research 129(3): 409–416. https://doi.org/10.1007/s10342-009-0346-7
Indufor, Ministry for Primary Industries (MPI), 2016: Wood Availability Forecasts ‒ New Zealand 2014 ‒ 2050, Wellington.
Laurie, A., 2020: Monthly Market Report. Christchurch, Laurie Forestry Limited.
Manley, B., Morgenroth, J., Visser, R., 2017: Quantifying the small-scale owners' estate in Canterbury, Otago and Southland. NZ Journal of Forestry 62(3): 24–32.
Manley, B., Morgenroth, J., Xu, C., 2020: Quantifying the area of the small-scale owners' forest estate in the East Coast, Hawke's Bay and Southern North Island. NZ Journal of Forestry 64(4): 18–26.
Ministry for Primary Industries (MPI), 2019: National Exotic Forest Description, Wellington.
Murphy, G., Visser, R., 2019: How to market and harvest your forest woodlot for profit. Rotorua, Christchurch: Forest Growers Research Ltd, 94 p.
New Zealand Forest Owners Association (NZFOA) 2020a: Facts & Figures 2019/20 New Zealand Plantation Forest Industry. Published by New Zealand Forest Owners, Wellington, New Zealand. 65 p. https://www.nzfoa.org.nz/images/Facts_Figures_2019_20_Web_FA3-updated.pdf
New Zealand Forest Owners Association (NZFOA), 2020b: NZ Forest Road Engineering Manual, Wellington.
Park, D., Manley, B., Morgenroth, J., Visser, R., 2012: What proportion of the forest of small-scale owners is likely to be harvested – a Whanganui case study. New Zealand Journal of Forestry 57(3): 4–12.
Petherick, K., 2014: Assessing the Level of Unproductive Area in Production Forestry Sites in the South Island of New Zealand. Christchurch, Universtiy of Canterbury, 37 p.
Raymond, K.A., 1987: Factors Influencing Landing Size. Rotorua: Logging Industry Research Association.
Ryan, T., Phillips, H., Ramsay, J., Dempsey, J., 2004: Forest Road Manual - Guidelines for the design, construction and management of forest roads. Dublin: COFORD, National Council for Forest Research and Development.
Toscani, P., Sekot, W., Holzleitner, F., 2020: Forest Roads from the Perspective of Managerial Accounting – Empirical Evidence from Austria. Forests 11(4): 378. https://doi.org/10.3390/f11040378
Visser, R., Spinelli, R., Magagnotti, N., 2010: Landing size and landing layout in whole-tree harvesting operations in New Zealand. Padua, Italy: Formec 2010 Symposium: Forest Engineering: Meeting the Needs of the Society and the Environment, 11–14 Jul.
Visser, R., Spinelli, R., Magagnotti, N., 2011: Landing Characteristics for Harvesting Operations in New Zealand. International journal of forest engineering 22(2): 23–27. https://doi.org/10.1080/14942119.2011.10702607
© 2023 by the authors. Submitted for possible open access publication under the
terms and conditions of the Creative Commons Attribution (CC BY) license (http://creativecommons.org/licenses/by/4.0/).
Authors' addresses:
Jacob Allum, BE(Hons)
e-mail: jacobzallum@gmail.com
Campbell Harvey, PhD *
e-mail: campbell.harvey@canterbury.ac.nz
Prof. Rien Visser, PhD
e-mail: rien.visser@canterbury.ac.nz
University of Canterbury
School of Forestry
20 Kirkwood Avenue
Ilam
Christchurch 8041
NEW ZEALAND
Stephan Hoffmann, PhD
e-mail: stephan.hoffmann@nibio.no
Norwegian Institute of Bioeconomy Research
Department of Forest Operations and Digitalization
Høgskoleveien 8
1433 Ås
NORWAY
* Corresponding author
Received: August 30, 2022
Accepted: October 25, 2022
Original scientific paper