Developing a User-Friendly Interface for Interactive Cable Corridor Planning
doi: https://doi.org/10.5552/crojfe.2025.3270
volume: 46, issue: 2
pp: 11
- Author(s):
-
- Retzlaff Carl Orge
- Gollob Christoph
- Nothdurft Arne
- Stampfer Karl
- Holzinger Andreas
- Article category:
- Original scientific paper
- Keywords:
- user interface, cable yarding, forest operations, digital twin
Abstract
HTML
Traditional methods of determining cable corridor layouts often rely on less accurate tree maps based on forest density estimates and satellite imagery, which can lead to designs that rely on infeasible corridors, undermining their reliability. In our previous research, we used LiDAR forest maps to calculate highly realistic cable corridors in steep terrain. We then used a multi-objective optimization strategy to determine an optimal combination of possible cable corridors, taking into account costs as well as ergonomic and environmental factors. The optimization process is however not easily accessible to users not familiar with mixed integer linear programming approaches. To make the optimization process more accessible to forestry professionals, we have developed an interactive interface to support the layout planning process. This interface provides an interactive overview, a 3D perspective of the current layout, and detailed information on costs and metrics of the current cable corridor layout, facilitating the comparison and modification of different corridor layouts. The interface was evaluated by three subject-matter experts and their suggestions were incorporated into the presented version. The resulting tool can help experts use optimized cable corridor layouts in the planning process, and represents another step towards the digitalization of forestry.
Developing a User-Friendly Interface for Interactive Cable Corridor Planning
Carl O. Retzlaff, Christoph Gollob, Arne Nothdurft, Karl Stampfer, Andreas Holzinger
https://doi.org/10.5552/crojfe.2025.3270
Abstract
Traditional methods of determining cable corridor layouts often rely on less accurate tree maps based on forest density estimates and satellite imagery, which can lead to designs that rely on infeasible corridors, undermining their reliability. In our previous research, we used LiDAR forest maps to calculate highly realistic cable corridors in steep terrain. We then used a multi-objective optimization strategy to determine an optimal combination of possible cable corridors, taking into account costs as well as ergonomic and environmental factors. The optimization process is however not easily accessible to users not familiar with mixed integer linear programming approaches. To make the optimization process more accessible to forestry professionals, we have developed an interactive interface to support the layout planning process. This interface provides an interactive overview, a 3D perspective of the current layout, and detailed information on costs and metrics of the current cable corridor layout, facilitating the comparison and modification of different corridor layouts. The interface was evaluated by three subject-matter experts and their suggestions were incorporated into the presented version. The resulting tool can help experts use optimized cable corridor layouts in the planning process, and represents another step towards the digitalization of forestry.
Keywords: user interface, cable yarding, forest operations, digital twin
1. Introduction
Multi-objective optimization of cable corridor planning is a key component of the digital transformation in forest operations (Holzinger et al. 2022, Holzinger et al. 2024). Multi-objective optimization allows to consider multiple criteria simultaneously, such as environmental impact, cost efficiency, and operational safety, when planning cable corridor layouts. By integrating computational techniques into the planning process, forest management can transition from traditional methods based on simple heuristics to more systematic, efficient, and sustainable practices. This shift not only aligns with the broader goals of digital transformation but also enhances the sustainable management of forest resources, illustrating the potential of digital innovations to tackle complex environmental and operational challenges. In European silviculture, the trend towards smaller extraction volumes and harvesting areas has increased extraction costs (Schweier et al. 2020). These costs can be mitigated by mathematically optimizing cable corridor planning, which allows for the determination of cost-minimal layouts.
However, the practical application of optimization approaches has been limited by inherent inaccuracies of the corridor placement when using remote sensing data (Bont et al. 2019). Satellites are often the main source for Remote Sensing data and, in practical applications, they are limited to a resolution of 10 meters for most bands, which makes the estimations of vegetation-density and tree placements little accurate (Acito et al. 2022). Ramstein et al. (2022) demonstrate how remote sensing data can be processed to identify potential support trees, with location deviations averaging between 1.8 and 1.9 meters from the actual tree positions. While this research highlights the potential for creating cable corridor layouts based on remote sensing data, it also acknowledges that in steep and complex terrain, data inaccuracies can result in layouts relying on infeasible supports, which can diminish confidence in the computed results. These issues underscore the need for more precise and realistic cable corridor layouts for complex terrain, where Retzlaff et al. (2024a) introduced a method for simulating cable corridors using high-definition forest maps to tackle these issues, enhancing the realism and reliability of the calculated cable corridors.
Another obstacle to the applicability of optimizations, apart from issues related to reliance on generated layouts, lies in the nature of optimization methods. Research into the automatic determination of optimal cable corridor locations has been extensive, with significant contributions from Chung and Sessions (2003), Dykstra and Riggs (1977), and Sessions (1992). Various optimization methods have been introduced to identify cost-minimal harvesting units and to allocate equipment, but for larger practical problems approximation algorithms have been necessary as the computational complexity increases exponentially with the problem size (Chung et al. 2004, Dykstra and Riggs 1977, Epstein et al. 2006). However, newer approaches, as well as recent advances in computing power, have made it possible to tackle ever larger problems, even allowing the optimization of areas of several hectares in size (Bont et al. 2019). See Bont and Church (2018) for an in-depth discussion of the mathematical background of optimization in forestry.
Retzlaff et al. (2024b) introduced a multi-objective optimization strategy for LiDAR-based cable corridor layouts, allowing users to balance various objectives. In line with Retzlaff et al. (2024b), we refer to those objectives as defined in the following paragraph. The cost of cable corridor layouts is quantified using productivity models from Ghaffariyan et al. (2009) and setup and takedown time estimates from Stampfer et al. (2013). Environmental impact is measured by residual stand damage, which is influenced by lateral yarding distance and affects forest stability and vitality (Limbeck-Lilienau 2002). Ergonomic impact is assessed through lateral yarding workload, which increases with distance and affects worker safety (Berendt et al. 2020). We recognize that although these results are a first step for the application of optimization in forestry, they are mostly accessible for academic users with a background in mixed integer linear programming, which has minimal overlap with our target audience of forestry experts.
Academic research should however not only present trustworthy results, but also ensure their transferability to the real world. There is often a significant gap between academic findings and their practical implementation due to the highly specific nature of the results and the substantial hurdles encountered in their application (Gera 2012). In our case, the area first has to be scanned with a LiDAR scanner, then an expert has to process the point cloud data, an expert has to process the data and compute the appropriate supports (refer to our previous publication Retzlaff et al. (2024a)), and then compute optimal solutions with approaches such as Retzlaff et al. (2024b). This process is overall very technical, and user interfaces can help with enhancing accessibility for the intended users.
The objectives of this publication are the presentation as well as the development and evaluation of an interface to simplify the interaction with our simulation and optimization of cable corridors. The presented interface is a Jupyter-based tool which loads the simulated cable roads of Retzlaff et al. (2024a) as well as the results of the multi-objective optimization of Retzlaff et al. (2024b) and allows the user to compare the resulting cable corridor layout as well as modify them. We aim to provide a comprehensive and interactive overview of the cable corridor layouts, and allow users to compare the properties of current layouts with different optimal layouts, manually select, modify, and compare different cable corridor layouts, and gain a better understanding of the trade-offs between different optimal solutions. As Mao et al. (2005) emphasize, it is crucial to develop solutions aimed at domain experts in collaboration with those experts, which allows for the integration of domain knowledge and specific feedback that would otherwise be inaccessible. In line with this, the interface was developed in conjunction with three subject-matter experts, enhancing its usability and improving its value for the end-user.
2. Materials and Methods
2.1 Technical Implementation
In our study, we used Jupyter Notebook, a web-based interactive computational environment (Kluyver et al. 2016), in conjunction with ipywidgets (»jupyterwidgets/ipywidgets« 2024), to construct an accessible and user-friendly interface. The code for the interface is openly accessible and can be found in our GitHub repository (Retzlaff 2023).
The interface provides a comprehensive 2D overview of the current layout, highlighting the currently selected cable roads as well as the trees assigned to them. It also displays a Pareto frontier, representing all the optimal solutions based on the multi-objective optimization strategy and showing their tradeoffs. Additionally, the interface provides several properties of the current cable corridor layout, such as cost, ergonomic, and ecological factors as defined in Retzlaff et al. (2024b). The individual components of the interface are elaborated upon in Section 3.1.
2.2 Interview Process
To ensure the effectiveness and usability of our interface, we implemented semistructured interviews with three experts in the field of forestry operations. These experts, with their hands-on experience in planning cable corridor layouts and working with cable yarding, provided insights into the practical applications of our interface. Transcripts for the interviews can be found in the supplementary material. The interviews lasted from 30 to 60 minutes, with the expert being structured in three parts. Transcripts of the interviews are provided in the supplementary materials. The first ten minutes were allocated to introducing the interface, where the general aim of the interface and its intended purpose are explained. The interviewer also explained the major interface components and answered any questions. In the second part of the interview, the experts were given the opportunity to use the interface themselves and explore the different components, taking an average of ten to twenty minutes. In the third part of the interview, we provided further explanation on some of the more advanced functionalities and opened the discussion of the interface, taking about 20 to 30 minutes. This last part of the interview was also used to gather explicit feedback as well as discuss new ideas for additions or changes to the interface. Notes were taken during the interview, and propositions for their implementations were discussed with the experts.
All experts were chosen based on their experience in the field of forest engineering and especially cable corridor planning. The experts (also referred to as experts) did not receive financial or other compensation for their participation. Expert 1 was working at the same institute as the main author and is recognized as a forest technology expert, but was otherwise not involved in this publication. The other experts were recruited as professional contacts of the authors and are not otherwise affiliated with this publication. The experts reviewed the interface within the context of cable harvesting practices in Austria, which may limit the broader applicability of our findings.
Expert 1 had an academic background with the focus on cable corridor planning and mathematical optimization in forestry. Their expertise was at the intersection of theoretical knowledge and practical application, and they have spent considerable time researching and implementing strategies for efficient and sustainable forestry practices, with a particular emphasis on cable corridor planning. Expert 2 and 3 have an engineering background from an Austrian harvesting and paper production company. Their combined hands-on experience spans several decades, during which they have planned and conducted cable yarding operations in a variety of terrains. This practical knowledge is invaluable in understanding the real-world challenges and nuances of cable corridor harvesting. Furthermore, they have experience with conducting training courses for cable yarding, demonstrating a thorough understanding of cable corridor planning practices as well as the ability to effectively communicate complex concepts.
2.3 Development Approach
The interface development approach presented in this paper followed an iterative process as suggested by Branton et al. (2013) and Nacheva (2017). See Fig. 1 for a visualization of the interface development process. The first step of our approach was to identify the target users, based on the approach by Branton et al. (2013). As target users, we identified foresters developing a cable corridor layout for a given area. They want to find the best possible layout for their use-case, also involving a tradeoff between costs, worker stress and ecological factors. The target users have moderate technical proficiency in information technology, but possess expert knowledge of the forest environment and the physical considerations of cable corridors. The next step was to gather requirements for the interface as defined in the system requirements phase by Nacheva (2017). The identified requirements include the ability to quickly change corridor configurations, compare different layouts, and receive relevant details about costs and other aspects of the current layout. We furthermore highlight the requirement to speak the users language, one of the ten golden rules of interface design by Nielsen (1994). This requirement can only be fulfilled by collaboration with subject matter experts, ensuring that the appropriate terminology is used in our interface.
The third step included defining the features to implement, which aligns with the sketching phase as outlined by Nacheva (2017). We decided on the following features to be included: a main contour map that displays the cable corridors, a Pareto frontier that presents the computed optimal solutions and their tradeoffs, and tables with information about the currently selected cable corridors and the overall layout costs.
The fourth step involves developing a prototype from the initial designs to create a working model of the interface, allowing developers to see their plans in action. This prototype is a preliminary version of the interface, and was developed in a Jupyter notebook.
In the fifth step, we conducted a user testing and iteration loop, corresponding to the exploring usability phase from Branton et al. (2013). During this phase, the prototype underwent usability testing, with the users providing feedback through observation and interviews. Based on the feedback received, we iterated on the design, going back to the third stage of defining new features to implement and making necessary changes, such as modifying the layout and navigation, or adding new components. Feasible changes are implemented in the interface, as detailed in Section 3.2. This iterative process ensures that the final interface is user-friendly, efficient, and meets the system requirements. The insights gained from this process have significantly enhanced our interface, making it a practical and efficient tool for optimizing cable corridor layouts. In Section 4, potential enhancements within the scope of this work are discussed.
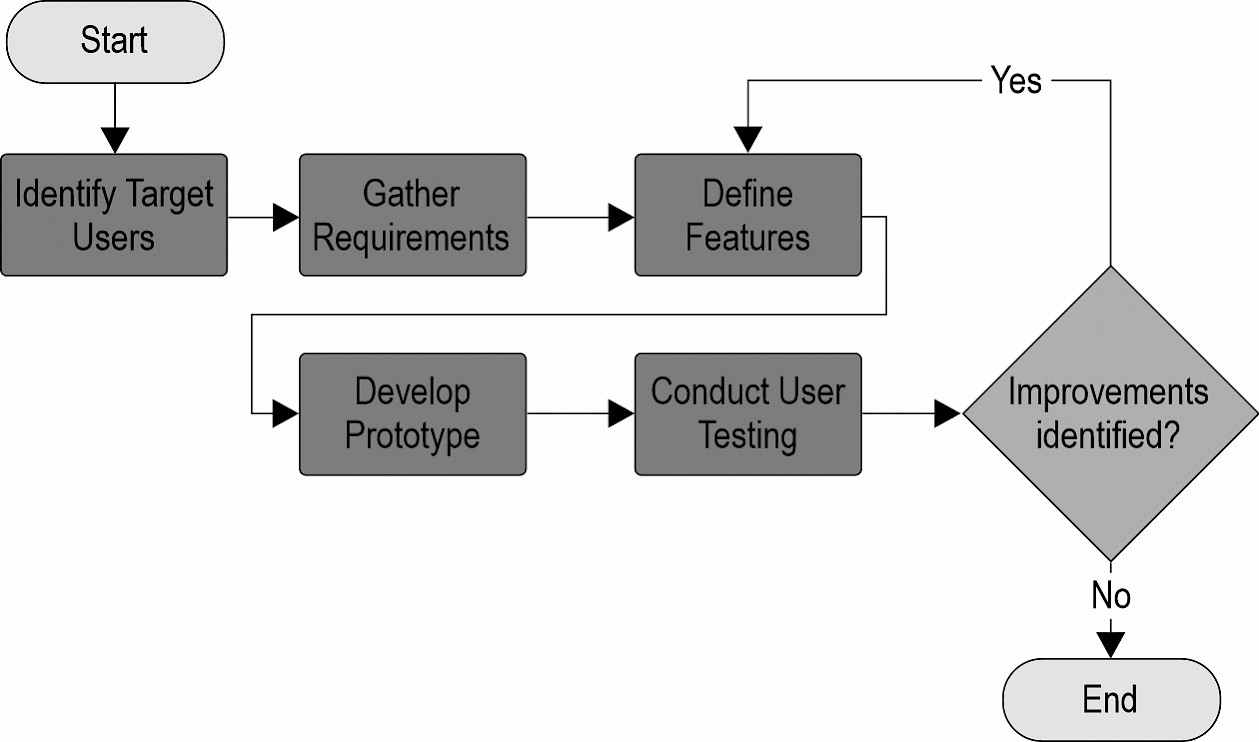
Fig. 1 Flowchart of interface development process
3. Results
The presented interface is set up as the final stage of a cable corridor planning process, following the preprocessing of LiDAR data into a forest map using the approach from Gollob et al. (2021), the calculation of potential cable corridors (Retzlaff et al. 2024a), and the execution of multi-objective optimization (Retzlaff et al. 2024b). These inputs, containing all relevant information on cable corridors and environments, are imported as Python objects into the Jupyter notebook. The interface does not perform optimization itself, but computes and displays critical metrics and enables users to visualize results and evaluate potential ecological and ergonomic impacts. The initial external inputs is the geodata of the area, on which the subsequent results (forest map, cable corridors and optimal layouts) are based. The outputs of the interface (contour map, Pareto frontier, overview tables, 3D cable corridor layout, comparison table) are described and explained in the following section. Fig. 2 describes its workflow, positioning the interface as the concluding step following data processing and optimization.
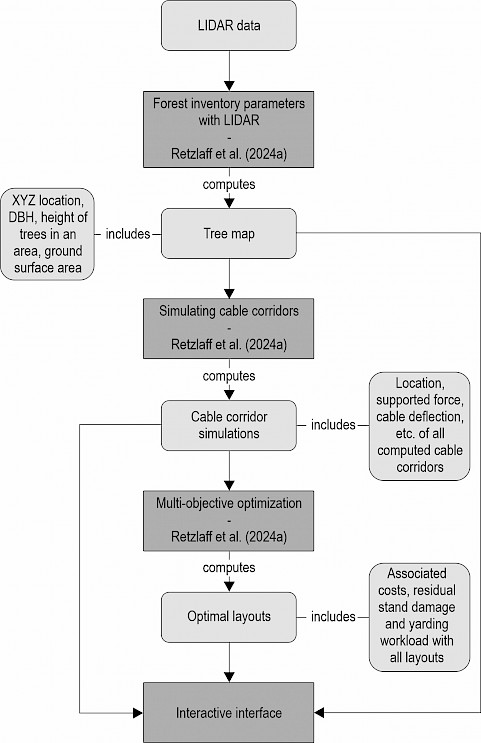
Fig. 2 Flowchart of interface components. The interface loads the simulated cable corridors, computed optimal layouts, as well as tree map, to provide an interface for evaluating and editing different layouts
3.1 Interface Components
The main window of the interface (see Fig. 3) shows a contour map of the area with trees as dots and possible cable corridors as grey lines. By selecting pre-computed layouts from the Pareto frontier graph (see Fig. 4), the selected cable corridors are presented as active with bigger, coloured lines, with the trees coloured correspondingly as per their assignment to each cable corridor. The user can activate and deactivate cable corridors by clicking on them, or by cycling through the adjacent cable corridors with the help of a button.
The second major component is the Pareto frontier (see Fig. 4). It is presented as a 3D graph with the axes cost optimality, environmental optimality and ergonomical optimality, where individual solutions are represented as dots in the 3D space. We pre-computed 16 optimal solutions along the Pareto frontier, based on a combined objective approach as well as the genetic algorithm NSGA and the epsilon-constraint optimization AUGMECON2. See Retzlaff et al. (2024b) for an exhaustive description of how the solutions were generated and the technical background of these optimization approaches. The axes represent the relative optimal, e.g. a solution is 73% optimal with regard to cost (where the most cost-efficient solution found represents the 100% mark), 85% optimal with regard to ergonomical and 54% optimal with regard to ecological optimality. The user can select any of the pre-computed solutions, which are then loaded into the contour map of Fig. 2, which allows for a quick visual comparison of different solutions.
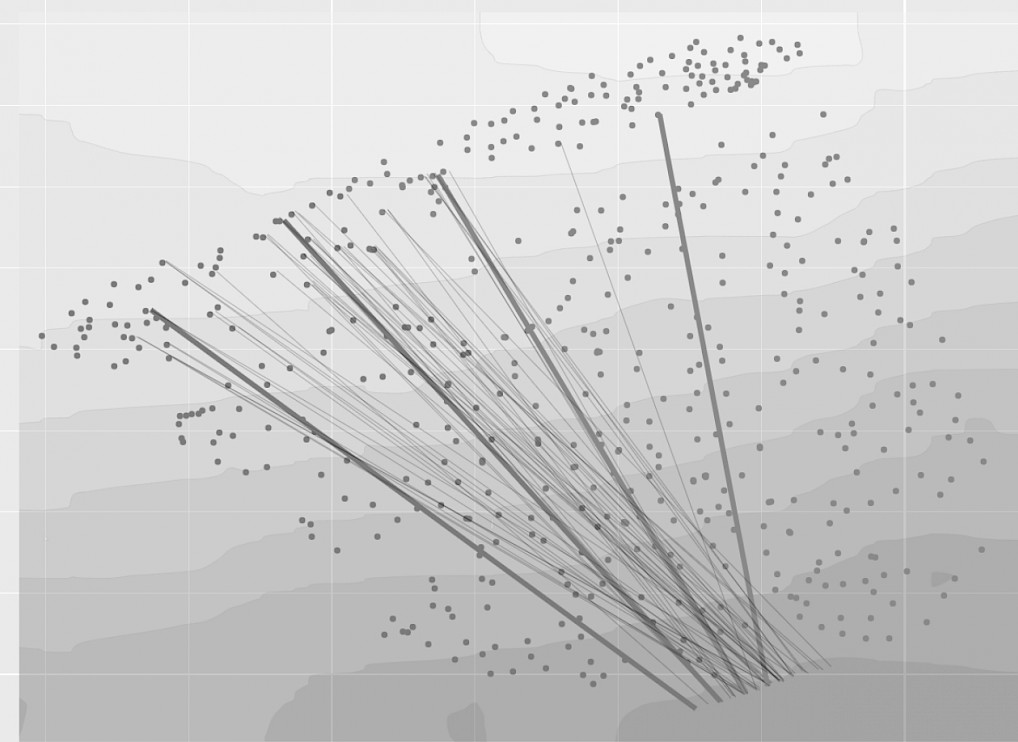
Fig. 3 Contour map of the area with activated cable corridors highlighted by colour and corresponding trees coloured
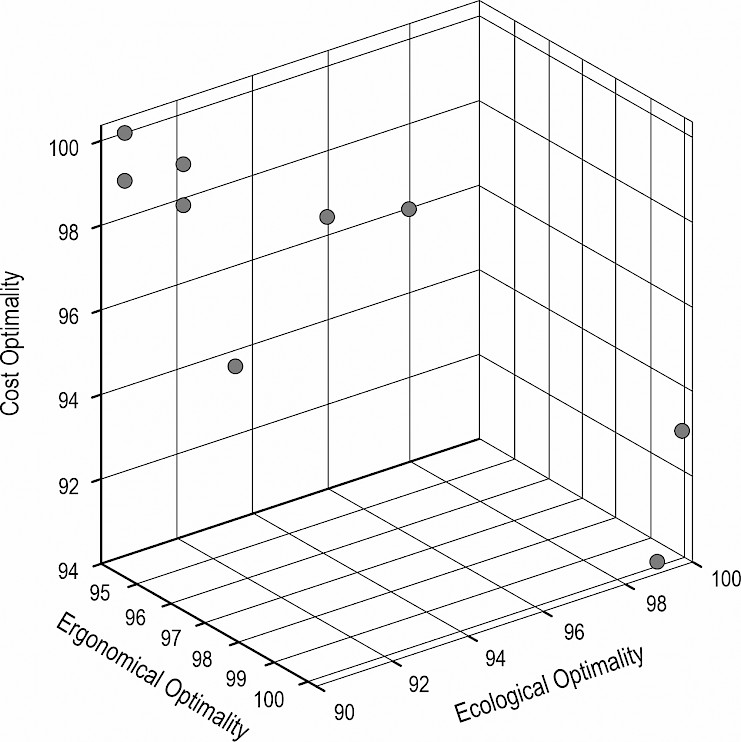
Fig. 4 Pareto frontier of all optimized solutions with regard to cost optimality, environmental optimality and ergonomical optimality
The third main component of our interface are the overview tables seen in Table 1. The first table provides an exact overview of details about the current individual cable roads and their cost, length, wood volume, amount and saddle height of supports as well as the average tree height assigned to each cable road. The second table provides facts about the current corridor layout, such as costs, penalties, yarding distance, costs per cubic meter of wood, etc. The third table shows information about the anchor tree configuration such as DBH (diameter at breast height), height, maximum supported force, etc. All tables are updated when a layout is selected from the Pareto frontier or changed via the contour map.
Furthermore, two additional components were developed to increase the interface usability and visualization capabilities. The first component, the layout comparison table (see Table 2), allows the quick comparison of different layouts. By clicking on the »Add layout to comparison« button, the current cable corridor layout is added to the comparison table. Note that the data in the table contains the same information as the layout overview table, therefore allowing a comparison of the most relevant factors between various layouts. With the help of a dropdown menu, the user can directly load individual layouts from the comparison table into the contour map. The second component (see Fig. 5) provides a 3D view of the current cable corridor layout loaded in the contour map. The user can inspect the location of supports and see the cable deflections as computed by the simulational approach based on Pestal (1961), which allows the user to better visualize the current layout than would be possible only with the contour map as seen in Fig. 3.
Table 1 Activated cable corridor overview, current cable corridor layout overview, as well as anchor information table. Cable corridor setup costs include estimated setup and takedown costs per cable corridor. Total layout costs are the sum of costs for setup and takedown of all cable corridors as well as the productivity cost for harvesting all assigned trees in an area. Productivity is abbreviated as »prod.«. See Retzlaff et al. (2024b) for a more detailed explanation of how the costs are computed
|
Activated cable corridor overview |
|||||||||||||||||||
|
Cable corridor setup cost € |
Cable corridor length m |
Wood volume per cable corridor m3 |
Supports amount |
Supports height m |
Average tree height m |
||||||||||||||
|
569 |
124 |
144 |
1 |
6 |
19.21 |
||||||||||||||
|
463 |
133 |
122 |
0 |
26.81 |
|||||||||||||||
|
618 |
134 |
143 |
1 |
9 |
23.67 |
||||||||||||||
|
693 |
141 |
419 |
1 |
14 |
23.67 |
||||||||||||||
|
Current cable corridor layout overview |
|||||||||||||||||||
|
Total layout costs, € |
Setup and takedown, prod. costs, € |
Ecol. penalty |
Ergon. penalty |
Selected cable corridors |
Max. lateral yarding distance, m |
Average lateral yarding distance, m |
Cost per m3 €/m3 |
Volume per meter m3/m |
|||||||||||
|
22,768 |
2344 20,424 |
1594 |
1522 |
0, 8, 18, 35 |
36 |
9 |
27.5 |
0.64 |
|||||||||||
|
Anchor information |
|||||||||||||||||||
|
BHD, cm |
Heigh, m |
Max. supported force, N |
X coordinate |
Y coordinate |
Corresponding cable corridor |
Attack angle skyline, ° |
|||||||||||||
|
31 |
27 |
33,683 |
–17.94 |
–26.04 |
0 |
53 |
|||||||||||||
|
31 |
27 |
33,683 |
–17.94 |
–26.04 |
8 |
52 |
|||||||||||||
|
50 |
28 |
85,243 |
–15.31 |
–31.33 |
18 |
52 |
|||||||||||||
|
38 |
23 |
50,455 |
–15.13 |
–26.16 |
35 |
52 |
|||||||||||||
Table 2 Comparison of details of three different layouts
|
Total layout Costs, € |
Setup and prod. costs, € |
Ecol. penalty |
Ergon. penalty |
Selected cable corridors |
Max. lateral yarding distance, m |
Average lateral yarding distance, m |
Cost per m3 € |
Volume per meter m3/m |
|
22,768 |
2334, 20,424 |
1594 |
1522 |
0, 8, 18, 35 |
36 |
9 |
27.5 |
0.64 |
|
22,855 |
2357, 20,498 |
1580 |
1513 |
0, 8, 19, 35 |
36 |
9 |
27.6 |
0.65 |
|
23,332 |
2946, 20,385 |
1517 |
1499 |
0, 8, 10, 24, 35 |
36 |
9 |
28.18 |
0.8 |
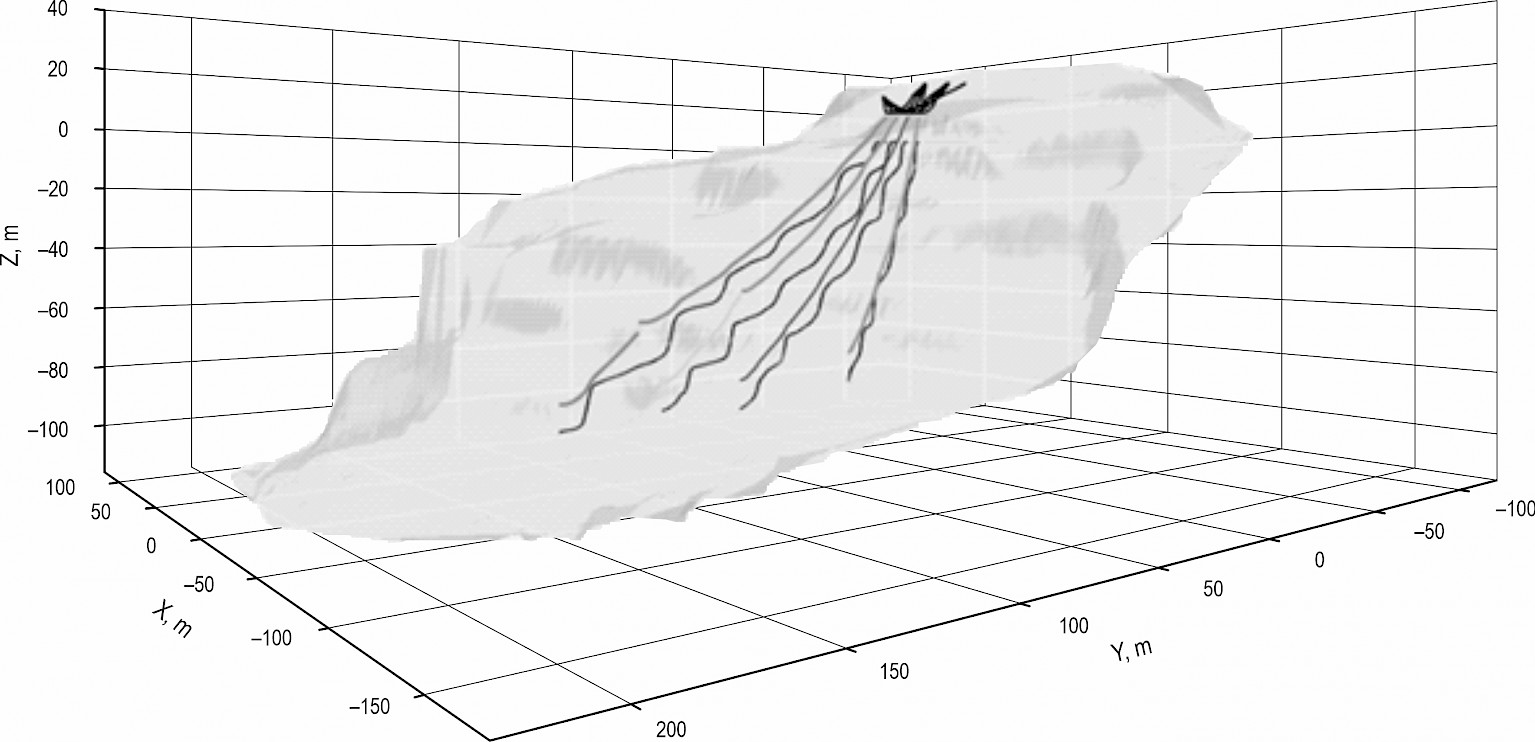
Fig. 5 3D view of cable corridor layout. The upper lines of a cable corridor show the load path of the cable itself, with the corresponding lower lines tracing the floor relief below
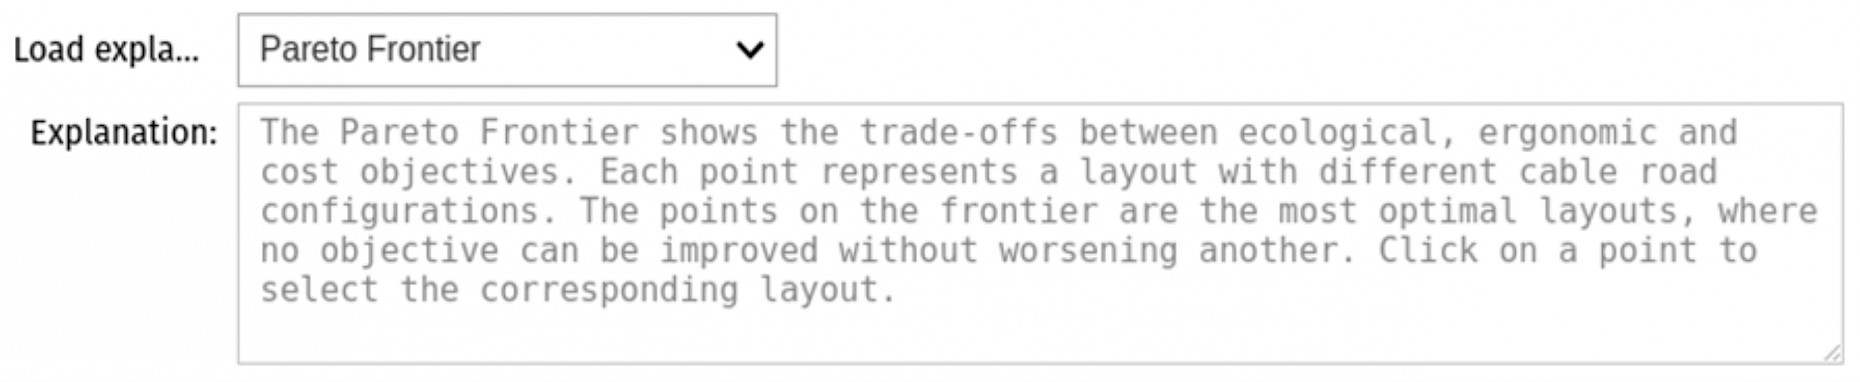
Fig. 6 Dropdown menu which displays explanations for various important terms in a text box
3.2 Interview Takeaways
Insights from the first expert interview have significantly improved our interface functionality. Expert 1 proposed several enhancements regarding which metrics should be provided in the interface, starting with the inclusion of the cost per cubic meter (€/m3). This metric offers a more precise understanding of each layout financial implications, enabling users to make cost-efficient decisions.
Additionally, Expert 1 emphasized the importance of adding units to columns for clarity and precision. By doing so, users can accurately interpret data and make relevant comparisons. To offer a comprehensive view of financial aspects of cable corridor planning, the expert suggested including detailed installation and productivity costs. These insights further support users in making cost-effective choices.
Regarding layout feasibility and safety, Expert 1 advised displaying the number and height of supports as well as the average tree size per cable road, considering its ecological impact in sustainable forestry practices. Furthermore, they proposed adding the volume per running meter—a critical metric for efficient planning and resource allocation, and to include average and maximum lateral yarding distances per cable road.
Expert 1 also highlighted the need to clarify terms such as »economic penalty« and »ergonomic penalty«. We agree that the terms needed a better explanation, as they can be quantified with different approaches. See Retzlaff et al. (2024b) to understand how we defined the ecological and ergonomical penalty. We added a text box with a dropdown menu which provides an explanatory text for the ergonomic and ecological impact, as well as how costs are determined and what the Pareto frontier defines (see Fig. 6). By providing clear definitions and examples, users can better understand these penalties and how they impact the overall optimization process.
Based on feedback from Expert 2 and 3, two new features were implemented to enhance the user experience. A first major change was to change the 3D cable corridor visualization from a point cloud to a 3D mesh surface with Delaunay triangulation, significantly improving the visualization of the area. This change allows for a more detailed and accurate representation of the terrain.
Furthermore, Expert 2 and 3 emphasized that information about the anchor configuration is vital to judge if a cable corridor is feasible. We therefore added the Anchor Information table seen in Table 1, which contains information about the end anchor configuration. The table includes details such as the Diameter at Breast Height (DBH), tree height, supported force, and coordinates, providing the user with comprehensive data about the area and trees they are working with.
The discussion with Expert 2 and 3 brought forth several key points for consideration of various aspects of the interface itself, but also the underlying requirements and possible further applications for the optimization of a toolset for optimizing cable corridor layouts.
Firstly, both experts agreed that a more realistic computation of the cable deflection beyond the Pestal approach (Pestal 1961) was not required. Larger differences in deflection can occur for long single span configurations for the Pestal approach, which is however less relevant as loads are usually transported partially suspended, therefore not placing the full load on the cable itself. The experts furthermore argued that differences in the local terrain, equipment used, tree species, and different approaches for attaching the tree to the cable yarder also have a strong influence on the cable deflection in the field, which makes a more accurate computation of cable deflection superfluous.
Secondly, Expert 2 argued against using the ground contact of trees to measure ecological impact. They emphasized that damage to the residual stand was much more important to quantify ecological damage. They further explained that covering the ruts with branches from the trees reduces impact, and that the weight of stems to be moved is not large enough to pose significant damage to the soil.
Thirdly, both experts highlighted the various complications with an exact quantification of the costs of a layout. They pointed out the significant influence of the skill of the worker for the time required for various tasks, the influence of terrain and tree species, equipment used, weather conditions, etc. The consensus was that a relative computation of costs makes sense, but the absolute cost should not be used as a reliable figure for the end user.
Lastly, Expert 3 suggested the use of the interface for documentation purposes to facilitate the documentation of the layout process. They noted the increasing regulation of cable yarding operations in general, and highlighted the importance of documentation both for governing bodies and for the harvesting company to document their setups for later reference. They proposed that exact information about the cable corridors built, their dimensions, the timber extracted, etc., could be provided by a software package, saving substantial amounts of time for the end users.
4. Discussion
The insights gained by the experts, as presented in Section 3.2, proved to be invaluable to the development of our interface. We already highlighted that it is essential to develop user interfaces in conjunction with users from the target group, as it is often nearly impossible for developers to define what the user actually needs, and often foregoes the expert knowledge the target group has (Mao et al. 2005). Especially aspects like which metrics to consider (such as suggested by Expert 1), adding specific information about the used tail anchors (suggested by Expert 2) as well as the change from visualizing the forest floor with a 3D mesh instead of a point cloud are aspects that significantly increased the usefulness of the interface provided.
As discussed with Expert 3, we highlight the potential of utilizing the interface presented in this paper to streamline and automate the documentation process for setting up a cable corridor. This process could be framed as three-step procedure. The first step involves using the optimization approach and interface to compute an initial draft of the layout. Following the initial draft, the user proceeds to the field to construct the layout based on the computed design. After the completion of the fieldwork, the user returns to the interface to update the cable corridors that were actually built. This step also includes the incorporation of the actual costs and time required by the company. We also propose enabling manual adjustments to additional layout details, such as the saddle height of supports, the skyline attack angle at the support, or the positions of supports and anchors themselves. The updated information could then be used to automatically generate a comprehensive report. This approach not only has the potential to save time and reduce costs for the end user but also adds significant value by providing a seamless and efficient method for planning, implementing, and documenting cable corridor layouts.
There are however also limitations to the implementation of the interface in its current state. The Jupyter-based interface and the underlying Python code can be deployed on platforms like Google Colab (Merkel 2014) and are therefore cheap to set up and use. Jupyter provides an easy way of interacting with the underlying code as well as the interactive interface (see Kluyver et al. 2016) for further information), allowing the users to further adapt it to their use-case. We however acknowledge that there are many required steps before the end user can start working with the interface for a given area (see Section 2 for further details). First, the area has to be scanned with a LiDAR scanner, then an expert has to process the point cloud data, an expert has to process the data and compute the appropriate supports (refer to our previous publication Retzlaff et al. (2024a), then, optionally, compute optimal solutions with the help of Retzlaff et al. (2024b), and finally load these solutions into the provided Jupyter notebook. This process is quite involved, and shows the limitations of such an academical process. The application in a professional context therefore requires further work to simplify and streamline the whole process. Possible approaches could include the readily accessible publication of the LiDAR data processing tools, the publication of Retzlaff et al. (2024a) and Retzlaff et al. (2024b) as coherent package, and possibly the setup as ready-to-use, reproducible environment with for example Docker images (Bisong 2019).
A limitation of the results presented is the possibility of misinterpreting the calculated harvesting costs as exact prices rather than estimates. We emphasise that the calculated costs are estimates, not exact predictions. Experts 2 and 3, with their practical knowledge, emphasized the many factors that influence the time and cost intensity of a harvesting operation. These factors include individual terrain difficulties, weather conditions, tree defects, worker skills and the equipment used. Each of these elements affects where and how cable corridors can be constructed, the speed with which they can be set up and dismantled, and the costs associated with felling and transporting the trees. Furthermore, the expert interviews were conducted in the context of Austrian silviculture and cable harvesting practices, potentially limiting the generalizability of our results to other regions or forestry practices.
Necessarily, the realism of our predictions depends on the underlying models used to forecast setup and takedown costs and productivity costs. While the models used (Stampfer et al. (2013) for setup and takedown times and Ghaffariyan et al. (2009) for productivity costs) provide a good approximation of average costs, they cannot account for the confounding factors mentioned above. We therefore suggest that the calculated costs should be interpreted as an estimate rather than a highly accurate prediction. The estimate also allows a relative comparison of costs within the reference framework. Using the Relative Negative Impact (see Retzlaff et al. 2024b), we can determine whether a particular layout is likely to be more expensive than another, although the exact total costs should only be regarded as estimates.
Finally, we would also like to highlight the significant lateral yarding distances in the simulation, as well as the significant volume of timber allocated to each cable corridor. This is primarily because the simulation uses a clear-cut approach by default, allocating all trees to the selected cable corridors, even if they are further away than the usual 15 m. If users wish to restrict these allocations, we also allow selective cutting based on the A-value approach. With the A-value approach, competitors to central trees can be automatically selected for harvesting (see Retzlaff et al. 2024b for further information). Alternatively, users can exclude specific trees or areas from the optimization input table to achieve more realistic volume allocations.
5. Conclusion
This paper presents the development as well as the development and evaluation of a user interface designed to facilitate the optimization process of cable corridor layouts in forestry, which have the potential for cost savings as well as a reduction of manual labor workload and ecological impact. However, current optimization approaches for cable corridor layouts are often used based on imprecise satellite data, leading to less reliable results, and also often fail to consider trade-offs among different objective functions. The presented interface enhances the accessibility of our previous simulation (Retzlaff et al. 2024a) and multi-objective optimization (Retzlaff et al. 2024b). We emphasize the importance of integrating user insights into the design process. Suggestions such as the inclusion of specific metrics for cost analysis, tail anchor configuration details, and a 3D mesh visualization of the forest floor have significantly improved the functionality of the interface.
Despite efforts to make the user interface as accessible as possible, the complexity of the process required for the end user to begin working with the interface remains a significant barrier to its applicability. We recommend further work to streamline the various steps involved, such as LiDAR scanning, point cloud processing, cable corridor computation, as well as the application of optimization approaches. A second limitation lies in the multitude of factors influencing the time and cost intensity of harvesting operations, which reduces the accuracy of the estimated harvesting costs. However, the use of relative comparison allows users to understand how different layouts vary from each other.
We discussed the potential for adapting the presented interface as a tool for quickly generating documentation of the harvesting operation, with the aim of streamlining and automating the process of creating cable corridor layouts. This could lead to a significant reduction in the time and cost of manual documentation, and is a promising idea for increasing digitalization in forestry. Overall, this could facilitate the use of optimization methods in forestry, ultimately saving time and labour costs.
Conflicts of Interest
The authors declare no conflict of interest. This work has been funded by the Austrian Science Fund (FWF), Project: P-32554, explainable AI (XAI).
6. References
Acito, N., Diani, M., Corsini, G., 2022: PRISMA Spatial Resolution Enhancement by Fusion With Sentinel-2 Data. IEEE Journal of Selected Topics in Applied Earth Observations and Remote Sensing 15: 62–79. https://doi.org/10.1109/JSTARS.2021.3132135
Bisong, E., 2019: Google Colaboratory. In E. Bisong (Ed.), Building Machine Learning and Deep Learning Models on Google Cloud Platform: A Comprehensive Guide for Beginners, 59–64 p. https://doi.org/10.1007/97814842-4470-8 7
Bont, L.G., Church, R.L., 2018: Location set-covering inspired models for designing harvesting and cable road layouts. Eur. J. For. Res. 137(6): 771–792. https://doi.org/10.1007/s10342-018-1139-7
Bont, L.G., Maurer, S., Breschan, J.R., 2019: Automated Cable Road Layout and Harvesting Planning for Multiple Objectives in Steep Terrain. Forests 10(8): 687. https://doi.org/10.3390/f10080687
Branton, C., Ullmer, B., Wiggins, A., Rogge, L., Setty, N., Beck, S.D., Reeser, A., 2013: Toward rapid and iterative development of tangible, collaborative, distributed user interfaces. Proceedings of the 5th ACM SIGCHI symposium on Engineering interactive computing systems, 239–248 p. https://doi.org/10. 1145/2494603.2480312
Chung, W., Sessions, J., 2003: NETWORK 2000, a Program for Optimizing Large Fixed and Variable Cost Transportation Problems. In G.J. Arthaud & T.M. Barrett (Eds.), Systems Analysis in Forest Resources: Proceedings of the Eighth Symposium, held September 27–30, 2000, Snowmass Village, Colorado, U.S.A. Springer Netherlands, 109–120 p. https://doi.org/10.1007/978-94-017-0307-9
Chung, W., Sessions, J., Heinimann, H.R., 2004: An Application of a Heuristic Network Algorithm to Cable Logging Layout Design. Int. J. For. Eng. 15(1): 11–24. https://doi.org/10.1080/14942119.2004.10702485
Dykstra, D.P., Riggs, J.L., 1977: An Application of Facilities Location Theory to the Design of Forest Harvesting Areas. A I I E Transactions 9(3): 270–277. https://doi.org/10.1080/05695557708975155
Epstein, R., Weintraub, A., Sapunar, P., Nieto, E., Sessions, J.B., Sessions, J., Bustamante, F., Musante, H., 2006: A Combinatorial Heuristic Approach for Solving Real-Size Machinery Location and Road Design Problems in Forestry Planning. Oper. Res. 54(6): 1017–1027. https://doi.org/10.1287/opre.1060.0331
Gera, R., 2012: Bridging the gap in knowledge transfer between academia and practitioners. Int. J. Educ. Manag. 26(3): 252–273. https://doi.org/10.1108/09513541211213336
Ghaffariyan, M.R., Stampfer, K., Sessions, J., 2009: Production Equations for Tower Yarders in Austria. Int. J. For. Eng. 20(1): 17–21. https://doi.org/10.1080/14942119.2009.10702571
Holzinger, A., Saranti, A., Angerschmid, A., Retzlaff, C.O., Gronauer, A., Pejakovic, V., Medel, F., Krexner, T., Gollob, C., Stampfer, K., 2022: Digital transformation in smart farm and forest operations needs human-centered ai: Challenges and future directions. Sensors 22(8): 3043. https://doi.org/10. 3390/s22083043
Holzinger, A., Schweier, J., Gollob, C., Nothdurft, A., Hasenauer, H., Kirisits, T., Häggström, C., Visser, R., Cavalli, R., Spinelli, R. Stampfer, K., 2024: From Industry 5.0 to Forestry 5.0: Bridging the gap with Human-Centered Artificial Intelligence. Curr. For. Rep. 10: 442–455. https://doi.org/10.1007/s40725-024-00231-7
Jupyter-widgets/ipywidgets [original-date: 2015-04-17T20:29:25Z]. Available at: https://github.com/jupyterwidgets/ipywidgets (Accessed on March 7, 2024)
Kluyver, T., Ragan-Kelley, B., Rez, F., Granger, B., Bussonnier, M., Frederic, J., Kelley, K., Hamrick, J., Grout, J., Corlay, S., Ivanov, P., Avila, D., Abdalla, S., Willing, C., Team, J.D., 2016: Jupyter Notebooks – a publishing format for reproducible computational workflows. In Positioning and Power in Academic Publishing: Players, Agents and Agendas, IOS Press: 87–90. https://doi.org/10.3233/978-1-61499-649-1-87
Mao, J.-Y., Vredenburg, K., Smith, P.W., Carey, T., 2005: The state of usercentered design practice. Commun. ACM 48 (3): 105–109. https://doi.org/10.1145/1047671.1047677
Mavrotas, G., Florios, K., 2013: AUGMECON2: A novel version of the epsilonconstraint method for finding the exact Pareto set in Multi-Objective Integer Programming problems. Appl. Math. Comput. 219(18): 9652–9669.
Merkel, D., 2014: Docker: Lightweight Linux containers for consistent development and deployment. Linux J. 2014(239): 1–2.
Nacheva, R., 2017: Prototyping approach in user interface development. Second Conference on Innovative Teaching Methods (ITM 2017), 28–29 June, Varna, 78 p.
Nielsen, J., 1994: Enhancing the explanatory power of usability heuristics. Proceedings of the SIGCHI conference on Human Factors in Computing Systems, 152–158 p.
Pestal, E., 1961: Cableways and skyline cranes for the transport of wood and materials. Cableways and skyline cranes for the transport of wood and materials. Georg Fromme & Co. Available at: https://www.cabdirect.org/cabdirect/abstract/19610603168 (Accessed on March 21, 2023)
Popescu, S.C., Wynne, R.H., 2004: Seeing the Trees in the Forest. Photogramm. Eng. Remote Sens. 70(5): 589–604. https://doi.org/10. 14358/PERS.70.5.589
Ramstein, L., Bont, L.G., Ginzler, C., Schweier, J., 2022: Comparison of single tree detection methods to extract support trees for cable road planning. Eur. J. For. Res. 141(6): 1121–1138. https://doi.org/10.1007/s10342-022-01495-z
Retzlaff, C.O., 2023: Multi-Objective Optimization of Cable Roads. Available at: https://github.com/werzum/MultiObjectOptimizationCableYarding (Accessed on April 12, 2023)
Retzlaff, C.O., Gollob, C., Nothdurft, A., Stampfer, K., Holzinger, A., 2024a: Simulating cable corridors based on terrestrial LiDAR data. Eur. J. For. Res. 43: 1083–1095. https://doi.org/10.1007/s10342-024-01673-1
Retzlaff, C.O., Gollob, C., Nothdurft, A., Stampfer, K., Holzinger, A., 2024b: Multi-Objective Optimization of Cable Road Layouts in Smart Forestry. Int. J. For. Eng. 35(3): 444–455. https://doi.org/10.1080/14942119.2024.2380229
Schweier, J., Klein, M.-L., Kirsten, H., Jaeger, D., Brieger, F., Sauter, U.H., 2020: Productivity and cost analysis of tower yarder systems using the Koller 507 and the Valentini 400 in southwest Germany. Int. J. For. Eng. 31(3): 172–183. https://doi.org/ 10.1080/14942119.2020.1761746
Sessions, J., 1992: Solving for Habitat Connections as a Steiner Network Problem. For. Sci. 38(1): 203–207. https://doi.org/10.1093/forestscience/38.1.203
Stampfer, K., Visser, R., Kanzian, C., 2013: Cable Corridor Installation Times for European Yarders. Int. J. For. Eng. 17(2): 71–77. https://doi.org/10.1080/14942119.2006.10702536
Wang, B., Xie, H., Xia, X., Zhang, X., 2019: A NSGA-II Algorithm Hybridizing Local Simulated-Annealing Operators for a Bi-Criteria Robust Job-Shop Scheduling Problem Under Scenarios. IEEE Trans. Fuzzy Syst. 27(5): 1075–1084. https://doi.org/10.1109/TFUZZ.2018.2879789
© 2025 by the authors. Submitted for possible open access publication under the
terms and conditions of the Creative Commons Attribution (CC BY) license (http://creativecommons.org/licenses/by/4.0/).
Carl Orge Retzlaff, MSc *
e-mail: carl.retzlaff@boku.ac.at
Prof. Karl Stampfer, PhD
e-mail: karl.stampfer@boku.ac.at
Prof. Andreas Holzinger, PhD
e-mail: andreas.holzinger@boku.ac.at
University of Natural Resources and Life Sciences
Institute of Forest Engineering
Department of Forest and Soil Sciences
Peter-Jordan-Strasse 82
1190 Vienna
AUSTRIA
Christoph Gollob, PhD
e-mail: christoph.gollob@boku.ac.at
Prof. Arne Nothdurft, PhD
e-mail: arne.nothdurft@boku.ac.at
University of Natural Resources and Life Sciences
Institute of Forest Growth
Department of Forest and Soil Sciences
Peter-Jordan-Strasse 82
1190 Vienna
AUSTRIA
* Corresponding author
Received: June 24, 2024
Accepted: October 28, 2024
Original scientific paper
11