Using UWB Sensors to Monitor the Danger Zone of Motor–Manual Timber Harvesting Operations
doi: https://doi.org/10.5552/crojfe.2025.4039
volume: 46, issue: 2
pp: 13
- Author(s):
-
- Hönigsberger Ferdinand
- Winkler Jakob
- Knapp Stephan
- Sarkleti Valentin
- Gollob Christoph
- Stampfer Karl
- Article category:
- Original scientific paper
- Keywords:
- occupational safety, hazard detection, fild testing
Abstract
HTML
Sensor technologies for monitoring danger zones during harvesting operations are not yet widely adopted, despite their potential to significantly enhance occupational safety. The objective of this study was to evaluate the performance of an ultra–wideband (UWB) sensor for detecting people in the danger zones of motor–manual harvesting operations. This was done to determine whether the system performance in practical use matches the results of a prior prototype test. The UWB sensor was deployed during three types of forest operations: thinning, clear-cutting, and overstory removal. Danger zones were defined as a circle with a radius of 1.5 times the top height of the stands: 21.00 m danger zone for thinning, 42.00 m for clear-cutting, and 46.50 m for overstory removal. Key metrics analyzed included detection distances, detection rates, interruptions in signal reception, and optimal sensor configuration. The results indicated mean detection distances of 19.80 m (90% Interval: 15.80–21.00 m) for thinning, 36.80 m (90% Interval: 23.70–42.00 m) for clear-cutting, and 39.00 m (90% Interval: 30.60–46.50 m) for overstory removal, with detection rates remaining stable across operations. The sensor system demonstrated its potential as a valuable tool for improving occupational safety.
Using UWB Sensors to Monitor the Danger Zone of Motor–Manual Timber Harvesting Operations
Ferdinand Hönigsberger, Jakob Winkler, Stephan Knapp, Valentin Sarkleti, Christoph Gollob, Karl Stampfer
https://doi.org/10.5552/crojfe.2025.4039
Abstract
Sensor technologies for monitoring danger zones during harvesting operations are not yet widely adopted, despite their potential to significantly enhance occupational safety. The objective of this study was to evaluate the performance of an ultra–wideband (UWB) sensor for detecting people in the danger zones of motor–manual harvesting operations. This was done to determine whether the system performance in practical use matches the results of a prior prototype test. The UWB sensor was deployed during three types of forest operations: thinning, clear-cutting, and overstory removal. Danger zones were defined as a circle with a radius of 1.5 times the top height of the stands: 21.00 m danger zone for thinning, 42.00 m for clear-cutting, and 46.50 m for overstory removal. Key metrics analyzed included detection distances, detection rates, interruptions in signal reception, and optimal sensor configuration. The results indicated mean detection distances of 19.80 m (90% Interval: 15.80–21.00 m) for thinning, 36.80 m (90% Interval: 23.70–42.00 m) for clear-cutting, and 39.00 m (90% Interval: 30.60–46.50 m) for overstory removal, with detection rates remaining stable across operations. The sensor system demonstrated its potential as a valuable tool for improving occupational safety.
Keywords: occupational safety, hazard detection, fild testing
1. Introduction
Austrian forests are predominantly owned by small-scale private forest owners (Bundesforschungszentrum für Wald 2016). The challenging terrain, especially in mountainous regions, results in steep and difficult-to-manage forest stands. Climate change exacerbates these challenges, causing storm damage and bark beetle infestations. In 2023, approximately 47% of harvested timber was classified as damaged wood. Small-scale ownership and challenging terrain, often combined with damaged stands, frequently prevent a high degree of mechanization, with only about 21% of operations being fully mechanized using harvesters to fell and process trees (Holzeinschlagsmeldung über das Kalenderjahr 2023, 2024). The majority of felling operations are still conducted manually with chainsaws.
Austrian legislation mandates that during timber harvesting, a second person must be within calling distance to activate the rescue chain in case of an accident (§75 Abs 3 Land und forstwirtschaftliche Arbeitsmittelverordnung BGBl. II 377/2021), making timber harvesting a two-person task. Consequently, at least one more person must be near the felling site. Moreover, despite all safety measures, random visitors can accidentally enter in the danger zone. Hence, the feller must know the danger zone of the harvesting operation – defined by the legislator as 1.5 times the tree height, from the point in time of initialing the back cut until the tree has fallen (§75 Abs 5 z1 Land- und forstwirtschaftliche Arbeitsmittelverordnung BGBl. II 377/2021) and make sure that nobody is stationed there during felling. Underestimating and misjudging danger zones plays a significant role in the occurrence of forest accidents (Stampfer 2018). Furthermore, studies have shown that motor-manual timber harvesting causes the most fatal forest accidents (Allman et al. 2023). This is exacerbated by the fact that forest workers are often subjected to loud noise and vibrations during the felling process, which can impair their ability to perceive and respond to hazards (Gejdoš et al. 2022).
To enhance safety under these circumstances, research has focused on developing advanced sensor technologies for monitoring danger zones. These technologies aim to provide real-time data to felling operators to ensure that they are always aware of danger zone intrusion. However, the few attempts and pilot applications of such technologies have mostly relied on geofencing using Global Navigation Satellite System (GNSS) data (Wempe and Keefe 2017, König et al. 2024). Although GNSS-based systems can be effective, they encounter challenges in environments where GNSS signals are unreliable, such as dense forest canopies. Issues such as multipath errors, where signals are reflected off objects, can significantly reduce their accuracy (Lee et al. 2023).
Beyond GNSS, other technologies could also be suitable for monitoring danger zones in forestry (Keefe et al. 2019). One technology that stands out because of its suitability for distance measurement in rugged terrains with forest coverage is ultra-wideband (UWB). UWB is a low cost technology, has minimal technical requirements, and is independent from mobile networks (Hönigsberger et al. 2024, König et al. 2024). Additionally, UWB is already integrated into most modern smartphones, making it a promising technology for the future. In forestry, UWB has been utilized for various applications such as collecting forest growth parameters (Li et al. 2021, Zhao et al. 2022) or real time location and obstacle detection for autonomous vehicles, particularly in environments with obstructed GNSS signals (Zamora-Cadenas et al. 2021), such as dense forest settings. These applications demonstrate the possibility of using UWB in forests, where other technologies may struggle.
For monitoring danger zones, Hönigsberger et al. (2024) demonstrated that their UWB sensor system provides precise and accurate distance measurements (Bias: 0.44 m; RMSE: 1.52 m) within danger zones up to 50 m. The system achieved a mean detection distance of 28.4 m (90% Interval: 22.33–30.00 m) for a 30 m danger zone and 43.9 m (90% Interval: 36.81–49.63 m) for a 50 m danger zone. The longest detection distance recorded during the test series was 85.00 m.
The objective of the present study was to evaluate the sensor system performance in real-world forestry operations, focusing on key performance metrics such as detection distance, detection rate as well as signal interruptions. To this end, the sensor system was deployed during three timber harvesting operations: thinning, clear-cutting, and overstory removal and its performance was systematically analyzed. The feller carried the basestation of the UWB sensor system, while other individuals involved in the harvesting process were equiped with tags. Using smartphones as tags, which could be particularly interesting for including uninvolved recreational visitors, was not considered in this study. While this is theoretically possible, the UWB performance of most smartphones is still too low for reliable detection (Hönigsberger et al. 2024). The study hypothesizes that the UWB sensor system can reliably detect people in the danger zone of different harvesting operations without hindering the forest workers.
The results represent a significant step toward determining whether the proposed sensors can perform effectively not only in standardized prototype tests but also in practical applications. By evaluating its detection performance in different operational settings, this research identifies the system strengths and areas for improvement. This study aims to lay the foundation for further practical applications of UWB in forestry and may encourage its broader adoption in the industry, providing a robust solution to one of the most pressing challenges in timber harvesting.
2. Materials and Methods
2.1 Study Layout and Data Acquisition
The field study was conducted in Salzburg, Austria. Clear-cutting and overstory removal operations were carried out in the Flachgau-Tennengau forest management unit, managed by the Austrian Federal Forests (ÖBf). Thinning operations took place in the agricultural and forestry management unit Sonnleitn. The sensor system used in the trials comprised a UWB base station and up to five UWB tags, as described by Hönigsberger et al. (2024). The feller was equipped with the base station making him the center of the danger zone. Other individuals involved in the harvesting process, such as additional forest workers or foresters, carried the tags and were tracked throughout the entire harvesting operation.
The base station was placed in a running vest worn by the feller (Fig. 1). This configuration was selected to optimize essential factors such as traceability, rechargeability, weather resistance, and social acceptability, while ensuring the device did not pose additional safety risks (Yadav et al. 2022). The tags were clipped onto the back waistbands of the workers.
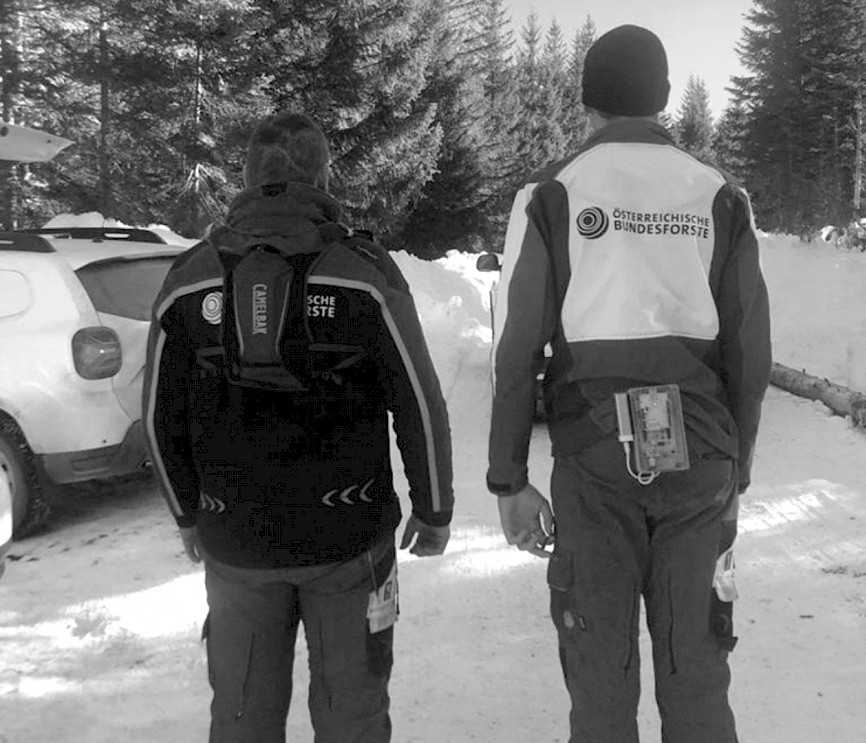
Fig. 1 Placement of base station (left) and tag (right)
The danger zone for each operation was defined as a circle with a radius of 1.5 times the top height of the stands. Whenever a connection between the base station and a tag was established, the distance and associated timestamp were recorded. To capture a wide range of data from tags both inside and outside the danger zone and to assess whether the sensor system detects reliably in this environment, data logging was conducted throughout all work phases rather thans being limited to the felling process. During periods of consistent connection, the maximum acquisition frequency was one measurement per second (Fig. 2).
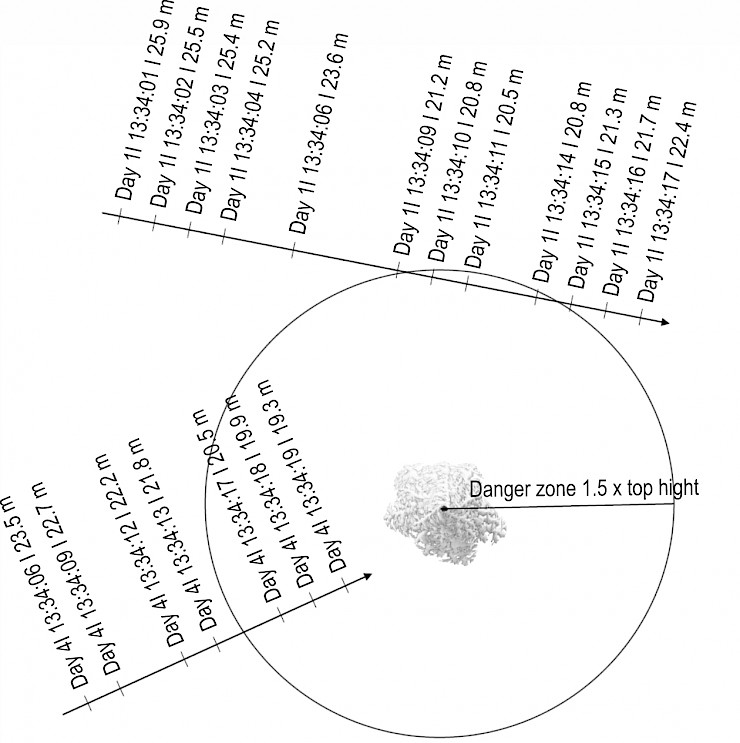
Fig. 2 Exemplary representation of study layout and recorded data
Data were logged and stored on a smartphone (Google Pixel 6) connected to the base station via USB-C cable. Using the Serial USB Terminal app, data were saved directly to the phone internal storage. At the end of each workday, the collected data were transferred to the cloud via Google Drive to ensure secure backup and accessibility for further analysis. To verify the detection of each approach, random checks were performed to confirm that logged data accurately displayed the detected approaches. In addition to sensor data, comprehensive information on harvesting operations and forest stands was collected. This included inventory data and operational records, providing a complete understanding of the context in which the sensor system was deployed.
Field tests were designed to represent different types of timber harvesting operations. To reflect the most common practices in even-aged forest management, tests were conducted at three sites, each focusing on a distinct operation: thinning, clear-cutting, and overstory removal. Thinning operations, characterized by relatively small danger zones due to lower stand heights, pose challenges for continuous danger zone monitoring because of dense canopy closures and low-hanging branches. In contrast, larger danger zones were encountered during clear-cutting and overstory removal, though differences in stand density and the presence of the regeneration layers were expected (Table 1).
Table 1 Description of forest stands within field test
|
Operation |
Age, years |
Tree species |
Growing stock, m3/ha |
Stocking level |
Top height, m |
Slope, % |
|
A – thinning |
20 |
spruce |
67 |
1.0 |
14 |
43 |
|
B – clear cut |
75 |
spruce |
370 |
0.8 |
28 |
46 |
|
75 |
fir |
|||||
|
C – overstory removal |
165 |
spruce |
197 |
0.4 |
31 |
9 |
|
10 |
beech |
|||||
|
10 |
spruce |
The thinning operation took place in a 20 year-old spruce stand established through artificial reforestation with a planting distance of 1×1 m, resulting in an exceptionally dense stand. Trees were felled and delimbed using a chainsaw, manually pre-skidded, and extracted with a skidder. Cross-cutting was conducted on the forest road. The clear-cut occurred in a 75 year-old spruce-fir stand. Timber harvesting involved felling and delimbing with a chainsaw, skidding using a specialized forestry tractor in a tree-length system, and subsequent cross-cutting at the roadside. The overstory removal was conducted in a 165 year-old spruce stand with a secondary stand layer comprising dense 10 year-old beech and spruce regeneration. As with the clear-cut operation, felling and delimbing were performed in the stand using a chainsaw, followed by skidding with a specialized forestry tractor and cross-cutting at the roadside.
2.2 Data Analysis
Data analysis was performed using the statistical computing language and environment R (v4.1.2; R Core Team 2021). In the initial step of analysis, measurement pairs were generated from the individual measurements for each tag. Each pair consisted of a start timestamp and start distance, as well as an end timestamp and end distance. For the subsequent measurement pair, the end timestamp and end distance of the previous pair were used as the start timestamp and start distance, respectively. This measurement pair thus represents the time span between two individual measurements. To determine detection distances, sensor data were analyzed for instances where the recorded danger zone was either entered or exited. The detection distance was defined as the point where one measurement fell outside the danger zone and the subsequent measurement fell within it, or vice versa. Accuracy was assessed using the root-mean-squared error (RMSE) as a measure (Eqn. 1):
 (1)
(1)
Where:
ddanger is the radius of danger zone
drec is the recorded detection distance, both expressed in meters.
Precision was evaluated using bias as a measure (Eqn. 2):
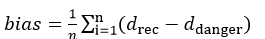 (2)
(2)
Detection rates (dr) were also analyzed (Eqn. 3). For a given distance, the detection rate was calculated as follows:
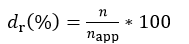 (3)
(3)
Where:
napp is the total number of times the specific danger zone was either entered or exited
n is the number of detections that occurred at a specific distance.
The duration of each measurement pair was calculated using the start and end timestamps. Since the base station recorded data at a maximum frequency of one measurement per second (s), any duration of two s or longer was classified as an interruption. Interruptions lasting longer than 180 s were assumed to result from either the tag being turned off or moving out of range for an extended period. These long interruptions were excluded from the study.
As data were recorded continuously throughout the operation, regardless of whether the tags were inside or outside the danger zone, it was possible to evaluate the optimal configuration of the sensor system. The triggering distance, defined as the distance at which the sensor activates acoustic and visual alarms, was optimized to minimize the bias (Eqn. 2) between the detection distance and the danger zone, as the RMSE originates from the sensor hardware itself and cannot be influenced directly. The optimal triggering distance was determined by calculating the bias for triggering distances ranging from the danger zone up to 1.15 times the danger zone, at increments of 0.1 m. This approach was designed to ensure that entries into the danger zone were detected as early as possible to maintain safety, while also avoiding false detections outside the actual danger zone that could disrupt forest operations. Finally, the results were compared with the findings of the prototype test conducted by Hönigsberger et al. (2024). For consistency, all data collected during these tests were aggregated and analyzed using the danger zones defined in the prototype test (30, 50, and 70 m). The same approach was applied to determine the detection distance.
3. Results
This study aimed to assess the performance of the UWB sensor system across various timber harvesting operations. The total recording time across all operations was 16 h and 26 min, with a maximum recorded distance of 89.8 m. A total of 9353 measurements were recorded throughout the study. The sensor system was tested during thinning operations lasting 3 h and 11 min and achieving a maximum recorded distance of 49.5 m. A total of 2057 individual measurements were recorded. During the clear-cut operation, the sensor system achieved a maximum distance of 89.8 m, representing the furthest distance recorded in the study. This operation lasted 5 h and 57 min and 2515 measurements were logged. Overstory removal represented the longest recording time, lasting 7 h and 18 min. During this operation, the maximum detection distance was 60.9 m, and the sensor system logged 4781 measurements.
3.1 Detection Distance and Detection Rate
The initial analysis of the recorded data focused on the detection distance (Fig. 3). For the thinning operation, the danger zone was set at 21.0 m, corresponding to 1.5 times the top height of the stand of 14.0 m (Table 1). The mean detection distance recorded was 19.8 m, with a 90% interval ranging from 15.8 m (5th percentile) to 21.0 m (95th percentile). The bias was 1.20 m, and the RMSE was 2.1 m. For the clear-cut operation, the danger zone was set at 42.0 m, corresponding to 1.5 times the stand height of 28.0 m (Table 1). The mean detection distance was 36.8 m, with a 90% interval ranging from 23.7 m to 42.0 m. The bias was 5.2 m, and the RMSE was 8.2 m. In the overstory removal operation, the danger zone was set at 46.5 m, corresponding to 1.5 times the stand height of 31.0 m (Table 1). The mean detection distance recorded using the sensor system was 39.0 m. The 90% interval ranged from 30.6 m to 46.5 m, with a bias of 7.5 m and an RMSE of 10.4 m.
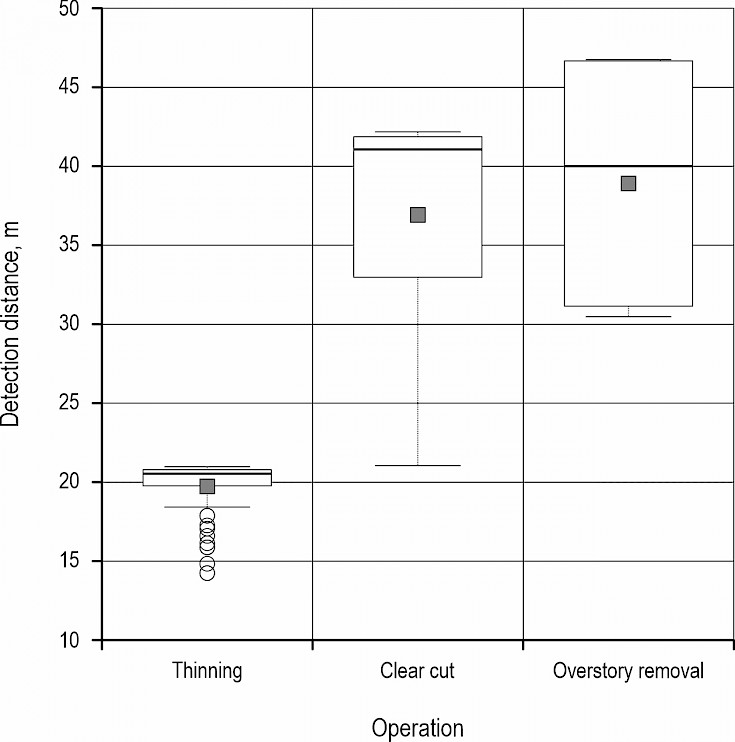
Fig. 3 Detection distances for various harvesting operations
Based on the detection distances, the trend of detection rates within the danger zones can be analyzed. Upon entering the danger zones, a sharp increase in detection rates was observed across all harvesting operations (Fig. 4). In the thinning operation, 50% of the approaches were detected at a deviation of 0.5 m from the danger zone (20.5 m from the base station), meaning just 50 cm after fully entering the danger zone. For the clear-cut operation, this 50% detection rate was reached 1.5 m after entering the danger zone (40.5 m from the base station). In contrast, during the overstory removal operation, a 50% detection rate was achieved at a deviation of 2.5 m from the danger zone entrance (44.0 m from the base station).
Three-quarters of the approaches (75%) during the thinning operation were detected 1.5 m after entering the danger zone. In the clear-cut operation, it took 9.5 m to reach a 75% detection rate, while during overstory removal, this detection rate was achieved 15.5 m into the danger zone. As the distance to the sensor decreased further, the detection rate continued to increase. In the thinning operation, a 90% detection rate was reached at a deviation of 6.0 m from the danger zone entrance (15.0 m from the base station). For the clear-cut operation, 90% of approaches were detected 16.0 m into the danger zone (26.0 m from the base station), and during overstory removal, the system achieved a 90% detection rate at a deviation of 16.5 m from the danger zone entrance (30.0 m from the base station).
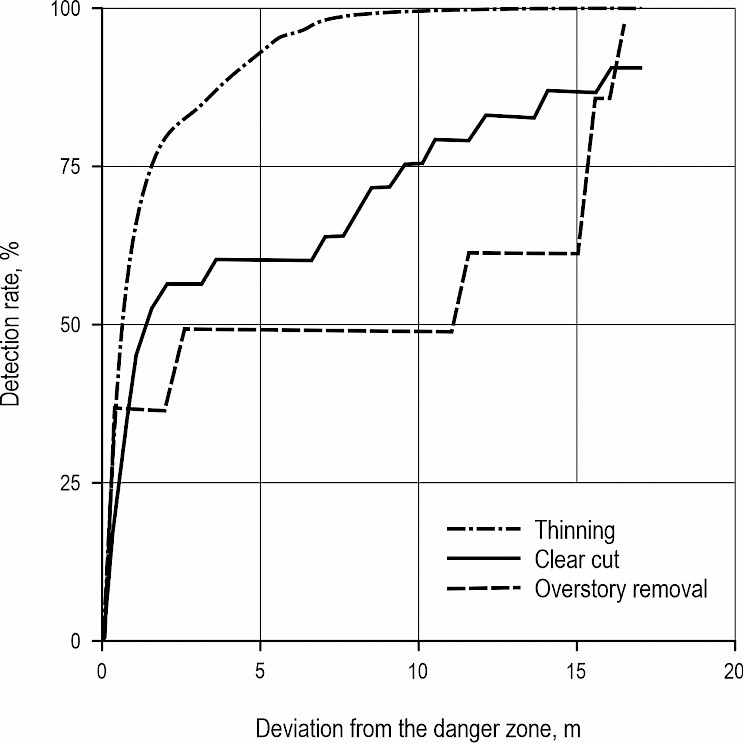
Fig. 4 Detection rates for different harvesting operations
3.1.1 Interruptions
An important metric is not only where an approach was detected but also where interruptions between detections occurred within the danger zones and how long these interruptions lasted. Interruptions were defined as all pairs of recordings with timestamps at least 2 s apart. The data shows that the mean interruption duration was 5 s. Additionally, 90% of interruptions were shorter than or equal to 7 s, and 95% were shorter than or equal to 14 s. Most interruptions were brief, with 70.5% lasting no more than 2 s.
Although this general trend held across all timber harvesting operations, notable differences were observed. The shortest interruptions occurred during the clear-cut operation, with 90% lasting no more than 4 s and 95% no more than 11 s, resulting in an average interruption length of 4 s. The overstory removal operation followed, with an average interruption length of 5 s. Here, 90% of interruptions lasted no more than 6 s, and 95% no more than 13 s. The longest interruptions were recorded during thinning operations, where the average duration was 5 s. In this case, 90% of interruptions were shorter than 10 s, and 95% were shorter than 17 s.
These differences, combined with the varying proportions of interruptions relative to the total recording time, created a nuanced picture of the recording time composition across different timber harvesting operations (Fig. 5).
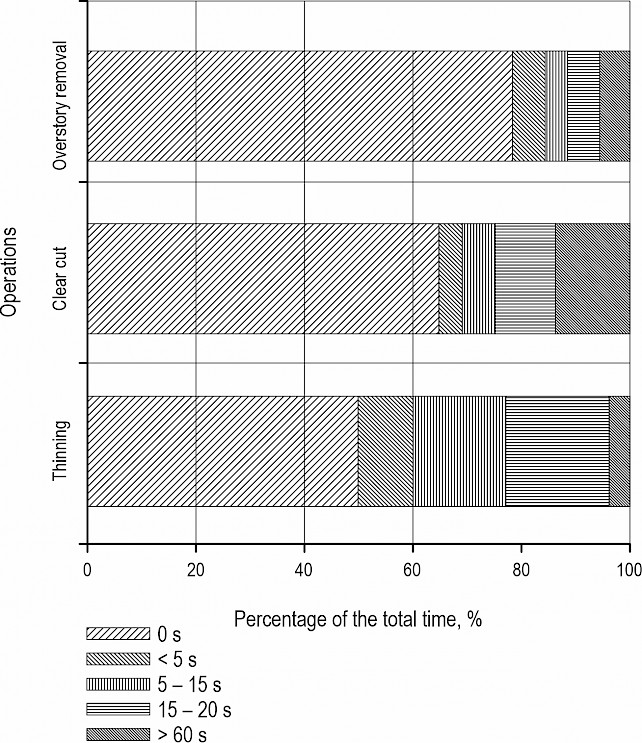
Fig. 5 Interruptions of varying lengths relative to total recording time for different harvesting operations
During the thinning operation, 50% of the total recorded time was free of interruptions. Short interruptions lasting less than 5 s accounted for 10% of the time, suggesting that such interruptions, while present, were relatively infrequent. Medium interruptions (5–15 s) were more common, representing 17% of the total recording time. Longer interruptions (15–60 s) occurred more frequently, accounting for 19%, while interruptions exceeding 60 s were rare, comprising only 4% of the time.
The final felling operation exhibited a different pattern, with 65% of the recording time being uninterrupted, indicating a higher level of continuous detection compared to thinning. Short interruptions of less than 5 s were less common, representing 4% of the time. Medium interruptions (5–15 s) accounted for 6%, while longer interruptions (15–60 s) made up 11% of the time. Interruptions exceeding 60 s were more frequent in this operation, representing 14% of the total recording time.
Overstory removal showed the highest proportion of uninterrupted recording time, with 78% of the total time free of interruptions. Short interruptions of less than 5 s accounted for 6%, similar to the final felling. Medium interruptions (5–15 s) were less frequent, at 4%, and longer interruptions (15–60 s) comprised 6% of the total time. Interruptions exceeding 60 s were relatively rare, accounting for 6% of the time.
3.3 Triggering Distance Optimization
Across all danger zones, earlier triggering – before entering the danger zone – resulted in improved sensor performance by reducing the bias between the designated danger zone and the actual detection. The distance at which this bias was minimized was considered the ideal detection point. In cases where multiple distances exhibited the same bias, the smaller distance was deemed the ideal detection point (Fig. 6a).
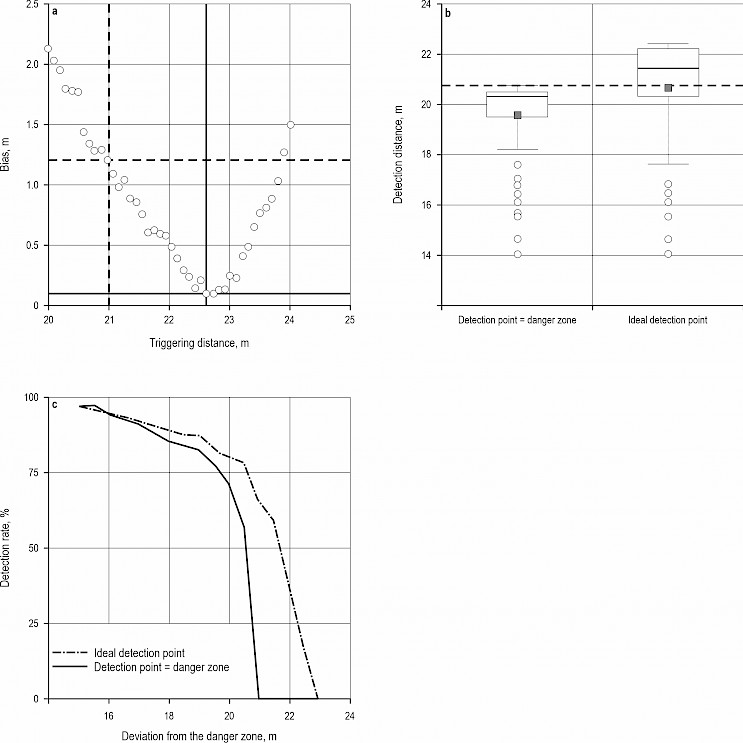
Fig. 6 Optimizing the configuration of sensor system for thinning operation. Identifying the distance with minimal bias between mean detection distance and danger zone distance (a), comparing the detection distance (b) and detection rate (c) between triggering point equal to danger zone distance and ideal triggering point
Using this ideal detection point of 22.8 m for the thinning operation, a new mean detection distance was calculated (Fig. 6b). For thinning, the new mean detection distance was 20.9 m, with the 90% interval ranging from 15.9 m (5th percentile) to 22.7 m (95th percentile). The bias was reduced to 0.1 m, and the RMSE was 2.2 m. This adjustment also resulted in an increased detection rate (Table 2), with 64.6% of the approaches being detected upon entering the danger zone at 21.0 m (Fig. 6c).
Table 2 Comparing UWB sensor systems performance before and after optimizing the configuration
|
Operation |
Danger zone, m |
Triggering distance, m |
Mean, m |
Median, m |
90% Interval, m |
Mias, m (%) |
RSME, m (%) |
|
|
5% |
95% |
|||||||
|
A–thinning |
21.0 |
21.0 |
19.8 |
20.6 |
15.8 |
21.0 |
1.2 (6.1) |
2.1 (10.5) |
|
A–thinning (ideal detection point) |
21.0 |
22.8 (+1.8) |
20.9 |
21.7 |
15.9 |
22.7 |
0.1 (0.3) |
2.2 (10.3) |
|
B–clear cut |
42.0 |
42.0 |
36.8 |
40.9 |
23.7 |
42.0 |
5.2 (14.1) |
8.2 (22.4) |
|
B–clear cut (ideal detection point) |
42.0 |
47.3 (+5.3) |
41.2 |
44.3 |
25.9 |
47.3 |
0.87 (2.1) |
7.7 (18.6) |
|
C–overstory removal |
46.5 |
46.5 |
39.0 |
39.8 |
30.6 |
46.5 |
7.5 (19.3) |
10.4 (26.7) |
|
C–overstory removal (ideal detection point) |
46.5 |
52.7 (+6.2) |
41.7 |
42.3 |
30.7 |
52.6 |
4.8 (10.3) |
11.0 (23.6) |
Similar improvements were observed in the clear-cut (Appendix Fig_1A) and overstory removal (Appendix Fig_2A) operations. For the clear-cut operation, triggering at the ideal detection point of 47.3 m resulted in a new mean detection distance of 41.2 m. In the overstory removal operation, the optimal triggering point of 52.7 m achieved a mean detection distance of 41.7 m (Table 2). These shifts in detection distances allow for higher detection rates at an earlier stage, though at the cost of larger danger zones, which increases the likelihood of unnecessary interruptions. However, this trade-off ultimately enhances safety by enabling a greater number of approaches to be detected sooner.
3.4 Comparing Prototype and Field Testing
By combining the datasets from Hönigsberger et al. (2024) and the present study, a comparison between the prototype and field tests was conducted (Fig. 7). To enable this comparison, data from the field tests were consolidated and evaluated for danger zones of 30, 50, and 70 m. A comparison with the 90 m danger zone from the prototype test was not possible, as no detection at this distance was recorded during the field tests. For the 30 m danger zone, the prototype test recorded a mean detection distance of 28.1 m, with a bias of 1.1 m and an RMSE of 4.0 m. The field test showed a slightly lower mean detection distance of 27.2 m, with a higher bias of 2.8 m and an RMSE of 4.8 m. For the 50 m danger zone, the prototype test recorded a mean detection distance of 43.9 m, with a bias of 6.2 m and an RMSE of 8.1 m. In contrast, the field test achieved a mean detection distance of 47.0 m, reducing the bias to 3.0 m and the RMSE to 3.5 m. For the 70 m danger zone, the prototype test recorded a mean detection distance of 52.8 m, with a high bias of 17.2 m and an RMSE of 19.2 m. The field test showed a mean detection distance of 56.1 m, with a lower bias of 13.9 m but a higher RMSE of 20.8 m.
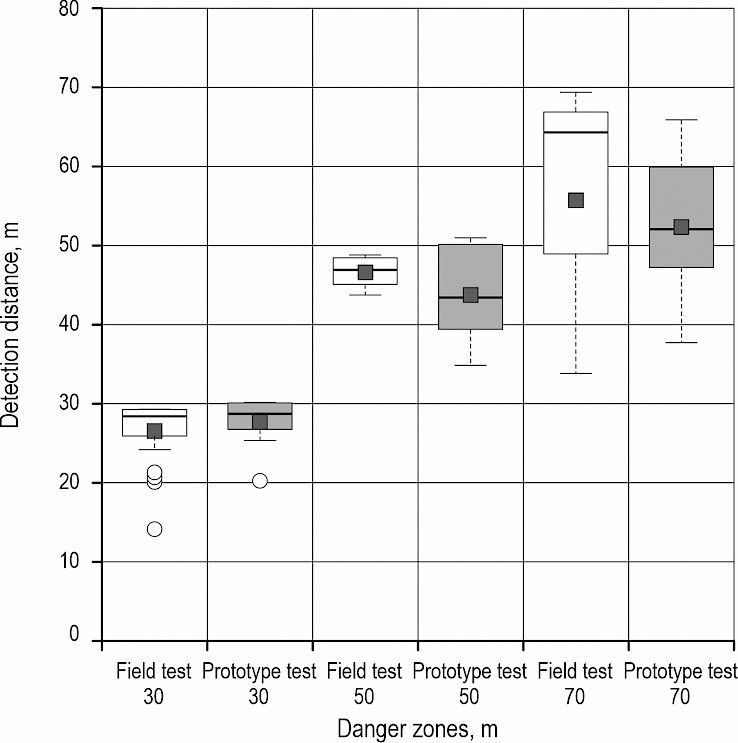
Fig. 7 Comparison of detection distance during prototype and field test
Welch's two-sample t-tests were conducted to compare the mean detection distances between the field and prototype tests for the 30 m, 50 m, and 70 m danger zones. The p-values for the 30 m, 50 m, and 70 m danger zones were 0.4, 0.3, and 0.8, respectively. All p-values were above the significance level of 0.05, indicating no statistically significant difference in the mean detection distances between the corresponding danger zones in the field and prototype tests.
4. Discussion
In this study, the performance of a UWB sensor system (Hönigsberger et al. 2024) was evaluated through field tests conducted during ongoing forest operations. The danger zones for each forest operation were defined based on the top height of the trees: 21.0 m for thinning, 42.0 m for clear-cutting, and 46.5 m for overstory removal. Sensor data were logged on a smartphone, transmitted to a cloud-based platform, and analyzed. Key metrics such as detection distances, detection rates, signal interruptions, optimal sensor configuration, and a comparison with prototype test results from Hönigsberger et al. (2024) were examined. The recorded mean detection distances were 19.8 m (90% Interval: 15.8–21.0 m) for thinning, 36.8 m (90% Interval: 23.7–42.0 m) for clear-cutting, and 39.0 m (90% Interval: 30.6–46.5 m) for overstory removal. Compared to the other operations, due to the smaller danger zones thinning showed a low scattering of detection distance.
These results, along with the detection rates, provided a detailed view of the sensor performance. In the thinning operation, which featured the smallest danger zone, most detections occurred immediately upon entering the danger zone, with 75% of detections achieved within 19.5 m (1.5 m after entering). In the clear-cut operation, initially dense forest conditions and a large danger zone created challenging conditions for the sensor. However, as the operation progressed and the area became more open, sensor performance improved. Notably, the farthest detection distance of 89.8 m w as recorded during clear-cutting. Overstory removal, which presented the largest danger zone among the tested operations, revealed unique challenges. Although the stocking level of the main stand was relatively low (0.4), the presence of regeneration made detection more difficult, as evidenced by the highest bias and RMSE. However, an analysis of signal reception interruptions revealed a contrasting perspective. During overstory removal, the average interruption duration was 5 s (95% Interval: <13 s), with the longest uninterrupted detection time (78.4%). This suggests that while detecting objects near the edge of the danger zone close to the sensor operational limit (50 m according to Hönigsberger et al. 2024) is challenging, detection within the danger zone itself was stable, likely due to the sparse main stand, resulting in fewer interruptions. Clear-cutting exhibited the shortest average interruption duration of 4 s (95% Interval: <11 s), with uninterrupted detection recorded 64.8% of the time. However, this operation experienced the highest number of long interruptions (>60 s), likely reflecting the transition from a densely stocked spruce forest to an open area as the operation progressed. In contrast, thinning had the fewest interruptions exceeding 60 s but showed the lowest proportion of continuous detection (49.9%). This may be attributed to the dense stand conditions but at the same time relatively small danger zone.
These findings underscore the distinct challenges posed by different harvesting operations for sensor systems. In scenarios where long interruptions are prevalent, increasing the sensor data acquisition frequency could enhance performance.
In practical applications, adjusting a sensor trigger distance to a point before entering the actual danger zone can improve the mean detection distance. For thinning, setting the trigger distance at 22.8 m (1.8 m before entering the danger zone) increased the mean detection distance from 19.8 m to 20.9 m (90% Interval: 15.9–22.7 m). During clear-cutting, setting the trigger distance at 47.3 m (5.3 m before the danger zone) improved the mean detection distance from 36.8 m to 41.2 m (90% Interval: 25.9–47.3 m). For overstory removal, setting the trigger distance at 52.7 m (6.2 m before the danger zone) increased the mean detection distance from 39.0 m to 41.7 m (90% Interval: 30.7–52.6 m). These results indicate that, for practical implementation, detection distances for thinning operations should be set approximately 2.0 m beyond the danger zone. For final yield operations, which involve larger danger zones, trigger distances of 5.0–6.0 m beyond the danger zone are recommended. This trade-off, between earlier detection of entries into the danger zone and false detections that could disrupt harvesting operations, ultimately enhances safety by enabling a greater number of approaches to be detected sooner.
A comparison of field test results with prototype tests carried out by Hönigsberger et al. (2024) revealed similar performance outcomes, with no statistically significant differences in detection performance across the 30-, 50, and 70 m danger zones. This suggests that the performance observed in the prototype test could also be replicated in the field test, demonstrating consistent sensor performance under both testing conditions. One notable advantage of the data collection method used in this study was that it required no modifications to the normal working process other than carrying the base station and tags, minimizing potential interference. However, this methodology introduces limitations, as certain detections – particularly tangential approaches at the edges of the danger zone – may not have been captured, even though all randomly conducted test approaches were detected. Additionally, detection distance and signal interruptions may vary depending on the direction of entry, as for example stocking level continuously change throughout the harvesting process. To address these limitations while preserving the benefits of the current methodology, future studies should integrate GNSS tracking for participants. Although not providing perfectly precise location data, GNSS tracking could enhance diversification of performance metrics within operations and allow a more detailed analysis of (micro-) topography and line-of-sight effects, which prior studies have shown to impact detection performance (Chen et al. 2022, Zhang et al. 2023, Hönigsberger et al. 2024).
5. Conclusions
This study tackled the challenge of improving safety during forest operations by testing a UWB sensor system designed to detect individuals within danger zones during motor–manual timber harvesting. The system performance was evaluated under real working conditions across various forest operations, including thinning, clear-cutting, and overstory removal. Data were collected in the field using a smartphone-based logging system and analyzed to assess detection distances, interruption rates, and the sensor system optimal configuration for practical use. The UWB sensor system demonstrated its effectiveness in real-world forest operations, validating the results of previous prototype tests. Detection distances and rates varied across thinning, clear-cutting, and overstory removal, reflecting the distinct challenges posed by each harvesting operation. In thinning, with its relatively small danger zone, most detections occurred shortly after entering the danger zone. In contrast, clear-cutting and overstory removal, characterized by larger danger zones, exhibited greater variability in detection performance. Adjusting the sensor trigger distance improved the mean detection distance, highlighting a practical optimization for field use. Despite its overall strong performance, areas for improvement remain, particularly regarding interruptions in signal reception. In summary, the sensor system performance was successfully validated through prototype testing. While the system is well-suited to support forest workers, it is essential to emphasize that it is not intended to replace human oversight. In fact, it serves as a supplemental tool to enhance occupational safety, fulfilling its intended purpose.
Acknowledgements
We would like to thank the Austrian Federal Forests management unit Flachgau-Tennengau for the support during testing.
This work was supported by the Federal Ministry of Agriculture, Forestry, Regions and Water Management as part of the research project »Innovative methods to increase work safety to improve ergonomics and to avoid dangerous situations in harvesting operations« (Safe forests).
Appendix
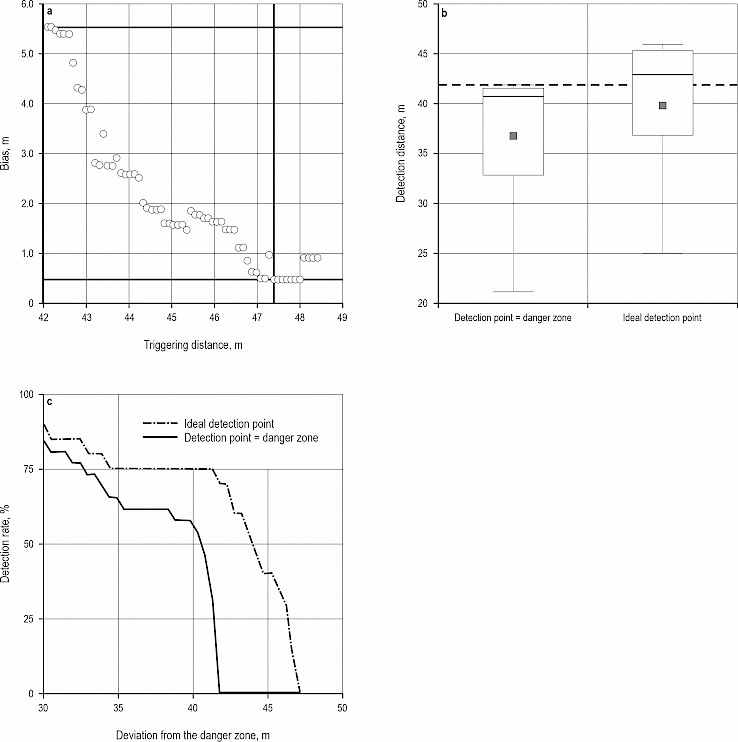
Fig. 1A Optimizing the configuration of sensor system for clear-cut operation. Identifying the distance with minimal bias between mean detection distance and danger zone distance (a), comparing the detection distance (b) and detection rate (c) between triggering point equal to danger zone distance and ideal triggering point
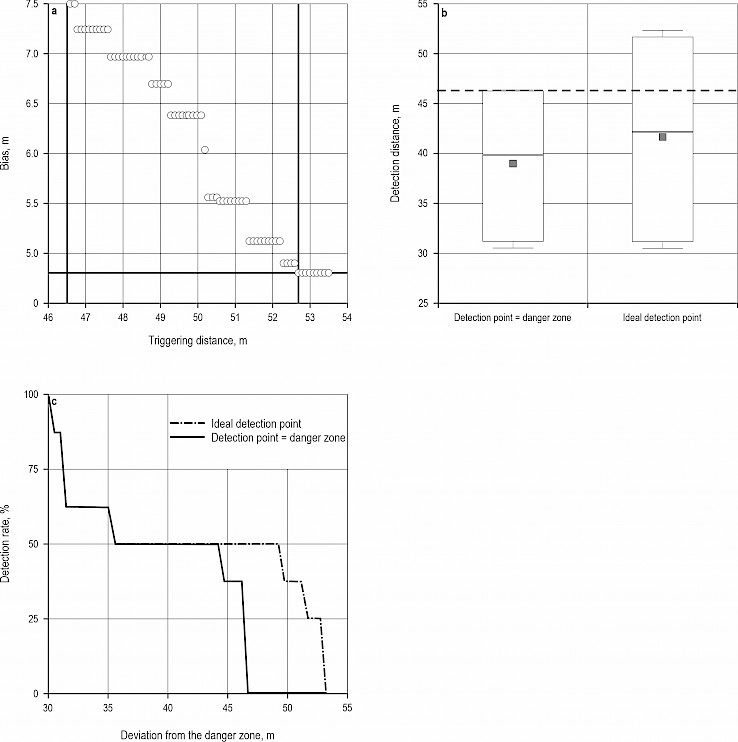
Fig. 2A Optimizing the configuration of the sensor system for the overstory removal operation. Identifying the distance with minimal bias between mean detection distance and danger zone distance (a), comparing the detection distance (b) and detection rate (c) between triggering point equal to danger zone distance and ideal triggering point
6. References
Allman, M., Dudáková, Z., Jankovský, M., 2023: Long-term temporal analysis of fatal and severe occupational accidents in Central European forests of the Slovak Republic. J. Safety Res. 87: 488–495. https://doi.org/10.1016/j.jsr.2023.09.002
Bundesforschungszentrum für Wald, 2016: Wem gehört Österreichs Wald? Available online: https://www.bfw.gv.at/wp-content/uploads/folder_wem_gehoert_oesterreichs_wald_end.pdf. (accessed 26 July 2024).
Bundesministerium für Land- und Forstwirtschaft, Regionen und Wasserwirtschaft, 2024: Holzeinschlagsmeldung über das Kalenderjahr 2023. Available online: https://info.bml.gv.at/dam/jcr:d018581b-0ccb-4369-a07a-9505dc19a8fc/Holzeinschlagsmeldung%202023.pdf
Chen, Z., Xu, A., Sui, X., Hao, Y., Zhang, C., Shi, Z., 2022: NLOS Identification- and Correction-Focused Fusion of UWB and LiDAR-SLAM Based on Factor Graph Optimization for High-Precision Positioning with Reduced Drift. Remote Sens. 14(17): 4258. https://doi.org/10.3390/rs14174258
Gejdoš, M., Hitka, M., Kampf, R., 2022: Anthropometrics Parameters of the Adult Population as Ergonomics Modifier for the Chainsaw Handle. Forests 13(5): 645. https://doi.org/10.3390/f13050645
Hönigsberger, F., Gollob, C., Varch, T., Waldhäusl, D., Holzinger, A., Stampfer, K., 2024: Use of Bluetooth low energy and ultra-wideband sensor systems to detect people in forest operations danger zones. Int. J. Forest Eng. 36(2): 103–115. https://doi.org/10.1080/14942119.2024.2438512
Keefe, R.F., Wempe, A.M., Becker, R.M., Zimbelman, E.G., Nagler, E.S., Gilbert, S.L., Caudill, C.C., 2019: Positioning methods and the use of location and activity data in forests. Forests 10(5): 458. https://doi.org/10.3390/f10050458
König, J.L., Bowen, J., Hinze, A., Exton, D., 2024: IoT in forestry: Human-focused assistive safety technology. Saf. Sci. 176: 106525. https://doi.org/10.1016/j.ssci.2024.106525
Lee, T., Bettinger, P., Merry, K., Cieszewski, C., 2023: The effects of nearby trees on the positional accuracy of GNSS receivers in a forest environment. PLOS One 18(3): e0283090. https://doi.org/10.1371/journal.pone.0283090
Li, J., Larsen, C., Rodriguez–Morales, F., Arnold, E., Leuschen, C., Paden, J., Shang, J., Gomez–Garcia, D., 2021: Comparison of Coincident Forest Canopy Measurements from Airborne Lidar and Ultra- Wideband Microwave Radar. In: 2021 IEEE International Geoscience and Remote Sensing Symposium IGARSS. Brussels, Belgium: IEEE, 6064–6067 p. Available online: https://ieeexplore.ieee.org/document/9554932/ (accessed 22 August 2024).
R Core Team, 2021: R: A Language and Environment for Statistical Computing. Available online: https://www.R-project.org
Stampfer, K., 2018: Gefahrenbereiche beachten rettet Leben. Waldverband Aktuell 2018(3): 14–5. Available online: https://www.waldverband.at/ueber-uns/zeitung-waldverband-aktuell/
Wempe, A.M., Keefe, R.F., 2017: Characterizing Rigging Crew Proximity to Hazards on Cable Logging Operations Using GNSS–RF: Effect of GNSS Positioning Error on Worker Safety Status. Forests 8(10): 357. https://doi.org/10.3390/f8100357
Zamora–Cadenas, L., Velez, I., Sierra–Garcia, J.E., 2021: UWB-Based Safety System for Autonomous Guided Vehicles Without Hardware on the Infrastructure. IEEE Access 9: 96430–96443. https://doi.org/10.1109/ACCESS.2021.3094279
Zhang, H., Wang, Q., Li, Z., Mi, J., Zhang, K., 2023: Research on High Precision Positioning Method for Pedestrians in Indoor Complex Environments Based on UWB/IMU. Remote Sens. 15(14): 3555. https://doi.org/10.3390/rs15143555
Zhao, Z., Feng, Z., Liu, J., Wang, Y., 2022: Development and Testing of a New UWB Positioning Measurement Tool to Assist in Forest Surveys. Sustainability 14(24): 17042. https://doi.org/10.3390/su142417042
© 2025 by the authors. Submitted for possible open access publication under the
terms and conditions of the Creative Commons Attribution (CC BY) license (http://creativecommons.org/licenses/by/4.0/).
Authors' addresses:
Ferdinand Hönigsberger, PhD *
e-mail: ferdinand.hoenigsberger@boku.ac.at
Jakob Winkler, BSc
e-mail: jakob.winkler@boku.ac.at
Stephan Knapp, MSc
e-mail: stephan.knapp@boku.ac.at
Prof. Karl Stampfer, PhD
e-mail: karl.stampfer@boku.ac.at
BOKU University
Department of Ecosystemmanagement, Klima and Biodiversity
Institut of Forest Engineering
Peter Jordanstrasse 82
1190 Vienna
AUSTRIA
Valentin Sarkleti, MSc
e-mail: valentin.sarkleti@boku.ac.at
Christoph Gollob, PhD
e-mail: christoph.gollob@boku.ac.at
BOKU University
Department of Ecosystemmanagement, Klima and Biodiversity
Institut of Forest Growth
Peter Jordanstrasse 82
1190 Vienna
AUSTRIA
* Corresponding author
Received: January 17, 2025
Accepted: February 20, 2025
Original scientific paper
11