
A Prototype for Automated Delimitation of Work Cycles from Machine Sensor Data in Cable Yarding Operations
doi: 10.5552/crojfe.2023.2248
volume: 44, issue:
pp: 10
- Author(s):
-
- Varch Thomas
- Malle Dennis
- Erber Gernot
- Gollob Christoph
- Spinelli Raffaele
- Visser Rien
- Holzinger Andreas
- Stampfer Karl
- Article category:
- Original scientific paper
- Keywords:
- steep terrain harvesting, cycle delimitation, cycle duration determination, machine sensor data, machine based data, automated time study
Abstract
HTML
The demand for increased efficiency in timber harvesting has traditionally been met by continuous technical improvements in machines and an increase in mechanisation. The use of active and passive sensors on machines enables improvements in aspects such as operational efficiency, fuel consumption and worker safety. Timber harvesting machine manufacturers have used these technologies to improve the maintenance and control of their machines, to select and optimise harvesting techniques and fuel consumption. To a more limited extent, it has also been used to evaluate the time taken to complete tasks. The systematic use of machine sensor data, in a central database or cloud solution is a more recent trend.
Machine data is recorded over long periods of time and at high resolution. This data therefore has considerable potential for scientific investigations. For mechanised timber harvesting operations, this could include a better understanding of the interaction between productivity and operational parameters, which first of all requires an efficient determination of cycle time.
This study was the first to automatically delimitate tower yarder cycle times from machine sensor data. In addition to machine sensor data, cycle times were collected through a traditional manual time and motion study, and cycle times from both studies were compared to a reference cycle time determined from video footage of the yarder in operation.
Based on three days of detailed time study, the total cycle time in the classic manual time (–1.3%) and in the machine sensor data (–1.2%) was only slightly shorter than in the reference study, and the average cycle time did not differ significantly (classic manual time study: –0.08±0.94 min, p=0.997; machine sensor data study: –0.08±0.26 min, p=0.997). However, the accuracy of the machine sensor approach (RMSE=0.92) was more than three times higher than that of the classic manual time study (RMSE=0.27).
With the integration of sensors on forestry machines now being commonplace, this study shows that machine sensor data can be reliably interpreted for time study purposes such as machine or system optimisation. This eliminates the need for manual time study, which can be both cumbersome and dependent on the experience of the observer, and allows long term data sets to be obtained and analysed with comparatively little effort. However, a truly automated time study needs to be supplemented with automated determination of and linkage to other operational parameters, such as yarding and lateral yarding distance or load volume.
A Prototype for Automated Delimitation of Work Cycles from Machine Sensor Data in Cable Yarding Operations
Thomas Varch, Dennis Malle, Gernot Erber, Christoph Gollob, Raffaele Spinelli, Rien Visser, Andreas Holzinger, Karl Stampfer
Abstract
The demand for increased efficiency in timber harvesting has traditionally been met by continuous technical improvements in machines and an increase in mechanisation. The use of active and passive sensors on machines enables improvements in aspects such as operational efficiency, fuel consumption and worker safety. Timber harvesting machine manufacturers have used these technologies to improve the maintenance and control of their machines, to select and optimise harvesting techniques and fuel consumption. To a more limited extent, it has also been used to evaluate the time taken to complete tasks. The systematic use of machine sensor data, in a central database or cloud solution is a more recent trend.
Machine data is recorded over long periods of time and at high resolution. This data therefore has considerable potential for scientific investigations. For mechanised timber harvesting operations, this could include a better understanding of the interaction between productivity and operational parameters, which first of all requires an efficient determination of cycle time.
This study was the first to automatically delimitate tower yarder cycle times from machine sensor data. In addition to machine sensor data, cycle times were collected through a traditional manual time and motion study, and cycle times from both studies were compared to a reference cycle time determined from video footage of the yarder in operation.
Based on three days of detailed time study, the total cycle time in the classic manual time (–1.3%) and in the machine sensor data (–1.2%) was only slightly shorter than in the reference study, and the average cycle time did not differ significantly (classic manual time study: –0.08±0.94 min, p=0.997; machine sensor data study: –0.08±0.26 min, p=0.997). However, the accuracy of the machine sensor approach (RMSE=0.92) was more than three times higher than that of the classic manual time study (RMSE=0.27).
With the integration of sensors on forestry machines now being commonplace, this study shows that machine sensor data can be reliably interpreted for time study purposes such as machine or system optimisation. This eliminates the need for manual time study, which can be both cumbersome and dependent on the experience of the observer, and allows long term data sets to be obtained and analysed with comparatively little effort. However, a truly automated time study needs to be supplemented with automated determination of and linkage to other operational parameters, such as yarding and lateral yarding distance or load volume.
Keywords: steep terrain harvesting, cycle delimitation, cycle duration determination, machine sensor data, machine based data, automated time study
1. Introduction
Time studies have been an integral part of the forest engineering research »toolbox« for over a century. The primary rationale for using scientific methods has always remained the same: to describe the relationship between input (e.g. time, but also consumables) and output (e.g. m³ of roundwood or industrial wood) and the factors that significantly influence this relationship, in order to derive practical adaptations to existing timber harvesting systems and harvesting methods that will increase their productivity and reduce unit costs (Brandstorm 1933, Magagnotti et al. 2012, Spinelli et al. 2021).
Over the years, the tools for time measurement, have changed considerably, starting with simple analogue clocks, to digital stopwatches to Windows OS or Android OS based mobile devices, and most recently GNSS-based time measurement (Essen 1936, Marrison 1948, Strandgard and Mitchell 2015, Eker and Kurt 2021, Gallo et al. 2021, Borz et al. 2022a). The quality and quantity of recorded data has changed along with measurement of time. Initially, human observation and handwritten records were the limiting factors for data collection in time studies. These have been partially overcome with the advent of digital recording methods. Traditionally, researchers have had to make a trade-off between the level of detail and the temporal scope of time studies – i.e. either conduct labour-intensive classic time-motion studies over short periods of time or resort to less detailed shift- and plot-level studies that can cover longer periods of time (Magagnotti et al. 2012).
In cable yarding, time consumption and productivity are a function of various operational parameters, such as tree dimensions, harvesting intensity, extraction and lateral yarding distances as well as the degree of mechanisation and proficiency of the yarding crew (Lindroos and Cavalli 2016). In recent years, a number of studies have investigated alternative approaches using different sensor technologies. These include global positioning systems (GNSS), or vibration or acoustic sensors to detect work cycle or work tasks (Cheta et al. 2011, Lee et al. 2018, Pierzchala et al. 2018, Proto et al. 2018, Tolsana et al. 2018, Baek et al. 2020, Picchio et al. 2020, Gallo et al. 2021, Borz et al. 2022a, Murata Manufacturing 2022, Neri et al. 2022, Yilmaz et al. 2022). A common drawback of many of these sensor-based approaches is the need to resort to customised sensor equipment.
Machine sensor data is collected by on-board-dataloggers. This data can be accessed via the machine Controller Area Network (CAN) system. CAN systems are installed in a wide range of machines and were originally designed to facilitate communication between control units (e.g. engine control unit, transmission control unit) within a vehicle using a common protocol, allowing hard wiring to be replaced by software, thereby significantly reducing the weight of the vehicle (CAN in automation 2011).
With machine sensor data in a standardised format, the CAN is considered to have considerable potential for time studies (Bruckmayer 2009, Rohrer et al. 2019) and represents a significant leap not only in terms of data quality and quantity, but also because it allows extending data collection to periods not realistic in classic time studies. Furthermore, due to the high resolution and density of machine sensor data, this technology offers considerable potential for improving model quality, but also enables novel approaches, such as data mining, to cope with exponentially larger datasets (Witten and Frank 2005, Manner 2015, Brewer et al. 2018, Sung 2018, Rossit et al. 2019, Borz et al. 2022a). Machine sensor data offers a number of advantages over data collected during classic time studies, most notably the ability to collect much larger datasets of highly accurate, standardised and detailed data at low cost (Palander et al. 2012, Nuutinen et al. 2008). Furthermore, by eliminating the need for an observer, one can avoid bias due to the so-called »Hawthorne effect«, i.e. the change in one’s behaviour when one is aware of being observed (Merrett 2006, Magagnotti et al. 2012, Strandgard and Mitchell 2015).
Konrad Forsttechnik GmbH was one of the first manufacturers of cable yarding equipment to store machine sensor data collected by data loggers installed in their tower yarder models in a structured manner. Varch et al. (2020) used this data in their investigation of the effect of carriage type on the fuel consumption of an integrated tower yarder in uphill whole-tree yarding. In contrast, the cycle times were determined by a classic manual time-motion study and then synchronised with machine sensor data to reconcile fuel consumption information with cycle data. A truly automated time study, on the other hand, would automatically delimit work cycles based on machine sensor data.
Accordingly, the objective of this study was to investigate how reliably and accurately cycle times can be determined from machine sensor data collected by standard data loggers installed in an integrated tower yarder using a novel delimitation algorithm. To this end, cycle times were collected simultaneously by three methods: automated machine sensor data, manual time study in the field and time study performed in the office from video footage.
2. Materials and Methods
2.1 Study Site and Operation
The study area was located in the district of St. Veit (47°01’56" N 14°13’03" E), province of Carinthia, Austria. The compartment measured approximately 1.2 ha in size, at an elevation of 1400 m above sea level on a NE slope. The terrain was fairly steep (slope ranging from 50 to 70%). The site was covered by a mixed mature stand of Norway spruce (Picea abies Karst.) and European larch (Larix decidua Mill.) originating from natural regeneration. Soil types encountered included leptosols, cambisols and podzolic cambisols.
A secondary felling treatment was carried out during the study, and it consisted of a selection cut using the single tree-selection method. The trees were felled, roughly delimbed and topped by chainsaw and extracted by tower yarder on two corridors. The yarding corridors were 32 m apart at the unloading point and converged as the corridor length increased due to the terrain. Span lengths were 180 and 220 m. Trees were yarded as stem lengths or stem sections, if excessive tree size required crosscutting at some point. On both corridors, the tailholds were large, healthy spruce trees. The average skyline clearance was 12 m and the slope profile allowed operation without intermediate supports. The rigging was a classic shotgun (two-cable) configuration; a standing skyline with the carriage being pulled towards the yarder by the mainline and returned to the loading site by gravity. On the forest road, the trees or tree sections were delimbed, cut into commercial assortments and stacked.
The yarder was a Konrad Forsttechnik Mounty 3000 integrated tower yarder model on a Mercedes Benz Arocs AK3342 6x6 truck. The machine had a maximum skyline capacity of 500 m and was equipped with three hydraulically powered winch drums, for the skyline, mainline (500 m) and haulbackline (1100 m). The mainline and haulbackline drums were equipped with a hydraulic interlock. Additional drums were available for the guylines. The tower could be telescoped up to 13.0 m and was fully extended during the study. The yarder was powered by the truck 309 kW diesel engine. The skyline, mainline, haulbackline and guylines had diameters of 18 mm, 11 mm, 10 mm and 18 mm, respectively. All cables were wire rope core, swaged, ordinary lay. The skyline pre-tension could be set to a maximum of 100 kN, depending on working conditions. The carriage was a Mayr-Melnhof PRISYS H3 (formerly PRISYS Cable Car 30) with a capacity of 3 tonnes, equipped with an energy recuperating system for slack-pulling and weighing 580 kg. At the loading site, it was clamped to the skyline with a hydraulic clamp and the mainline was used for slack-pulling. Loads were hooked to the mainline by one end and were yarded semi-suspended or dangling from the carriage when contact with the slope profile was interrupted. For processing, the yarder was equipped with a Konrad Woody H60 processor head mounted on a KFT MT 22 crane with a maximum reach of 9.6 m.
The yarding crew consisted of four workers: two at the loading point (chainsaw operator and choker setter) and two at the unloading point (processor operator and chaser). The processor operator sat inside the cab of the yarder and cut the incoming trees and tree sections into commercial assortments, while the chaser manually removed the chokers from the trees. Both the processor operator at the unloading point and the choker setter at the loading point had remote controls to manage the yarder, allowing them to operate it independently when the carriage was in their own work zone. The remote controls were mutually exclusive, so that operators could not interfere with the carriage movements when the carriage was outside their defined working zone. All operators were experienced and had the appropriate formal qualifications.
2.2 Study Layout
The experiment involved three concurrent studies, each representing a different approach to cycle time measurement. In the first study, cycle time was recorded by a researcher conducting a classic time-and-motion study based on real-time visual observation of the work (OCU). In the second study, the cycle time was determined from machine data (MAC) obtained from standard data loggers installed in the cable yarder, using a novel algorithm to automatically delimitate work cycles. In the third study, the cycle time was derived from video footage (VID) of the harvesting operation taken with action cameras and processed back in the office. The VID study was considered to be the »true« cycle time or »ground-truth« because it had several advantages over the OCU and MAC studies. First, the exact cycle time could be determined by slow-motion and the recording could be replayed in case of doubt, thus eliminating potential human error in cycle evaluation that could occur in the OCU study. Second, VID did not lack the reference to stem IDs that the MAC study lacked. As the same cycles were evaluated in all three studies, the cycle time accuracy and precision achieved in the OCU and MAC studies could be determined by benchmarking against the VID reference. All studies used the same cycle separation point (»break point«), which was the moment when the carriage began to move from the unloading point to the loading point (start of outhaul).
2.3 Field Study
Prior to harvesting, all trees to be felled were marked with spray paint by a forester. A total of 262 trees had been selected for removal along the two study corridors. For identification during the time study, each of these trees was provided with a unique ID in the form of a sequential number applied with spray paint.
The time study took place over three consecutive days (November 09th to November 11th 2020) under natural light conditions. The yarder extracted 291 trees with a total volume of 239.0 m³. The lateral yarding distance was 10.6±10.0 m and the yarding distance was 104.2±71.8 m. A load consisted of 1.6±0.9 pieces and had a volume of 1.33±0.64 m³.
In the OCU study, cycle time was manually recorded using RC5 time study software (version 1.0) on a handheld computer (Algiz 7) by a researcher stationed at a point close to the yarder with an unobstructed view of the corridor. For each yarding cycle, time spent was recorded together with the IDs of the trees yarded in the same cycle.
For the MAC study, machine data was obtained from a system of three data loggers installed as standard on the integrated tower yarder. These data loggers are connected to the machine CAN system and record data from the engine, transmission and radio remote controls, as well as any other analogue or digital sensors installed on the yarder or carriage. They can store up to 30 days of data in binary format. Data logger timestamps are synchronised via an integrated GPS unit and data is recorded at intervals of 50±5 to 1000±100 ms, depending on the sensor and signal type. Data can be viewed in real-time on a mobile device via a Wi-Fi connection during the operation and retrieved during or after the operation via wireless access or by connecting the data loggers to a PC, smartphone or tablet. To initiate a new recording file, the machine main power supply switch must be operated. The reason is that the data loggers used generate a new series of data files based on the sensor signals every moment they are de-energised. Therefore, this was done at the beginning of the study to ensure consistent quality of information for the time stamp and to establish an imaginary zero point for the data series, and data recording continued uninterrupted until the end of the study.
A number of sensors and signals, such as the converted binary code from the radio remote control, signals from the electro-hydraulic valves of the mainline drum or the Hall magnetic sensor of the mainline drum, were considered prior to the study in order to obtain cycle time information. It was also considered to install an additional Hall magnetic sensor on the infeed pulley of the mainline at the top of the tower, which would have allowed access to the mainline movement without slippage, on the one hand, and where the spooled-out length could have been measured with very high accuracy, on the other hand. Since the aim of the present study was to automatically delimit work cycles from standard sensor data and the break point between cycles is linked to the start of carriage movement at a particular point along the skyline, a standard sensor was chosen that can deliver exactly this data, namely the Hall magnetic sensor attached to the mainline drum. In detail, the sensor provides the magnitude and direction of rotation of the mainline drum over time and allows the position of the carriage along the corridor to be estimated. As the Hall magnetic sensor had shown promise in test data trials, it was also used in the full-scale study.
In the VID study, an action camera (GoPro HERO7 black) was mounted on a tripod close to the yarder so that the camera angle covered the entire processing zone. Uninterrupted power supply was ensured by using several of the largest commercially available batteries for the action camera model, which were changed in the morning and at lunchtime. Recordings were stored on SD memory cards, allowing a full day recording to be made and transferred to a PC at the end of each day. The purpose of the recordings was to later establish cycle time in the office and to re-check tree ID recordings from OCU study.
2.4 Data Analysis
OCU work task level data was downloaded from the handheld computer and checked for completeness, consistency and plausibility. Cycle level data was then organised by cycle number in a Microsoft Excel spreadsheet.
The analysis in VID was carried out by the same researcher and the videos were first screened for coverage using a standard video player software. Due to a technical problem during the field study, video footage did not cover all OCU cycles and the total recorded cycle time was therefore shorter in VID. Partially covered cycles were excluded from the analysis. Cycle time was established by calculating differences between break points based on video runtime. Cycle number was determined by matching tree IDs in the videos to recordings in OCU. Finally, the VID cycle time data was linked to the OCU data by cycle number in the Microsoft Excel spreadsheet mentioned above.
The raw MAC data consisted of a number of binary format (ASCII code) packages for each data logger and day. In order to actually work with this data, the files had to be converted to hexadecimal format. Only in this format was it possible to locate the desired information, or rather the delivering sensor, by means of specific manufacturer-coded identifiers provided by Konrad Forsttechik GmbH (Konrad Forsttechnik 2022). The software UltraEdit (IDM Computer Solutions, Inc., version 2022.1) was used for the conversion and the files were saved as .txt files. The original file names consisted partly of a timestamp referring to the time of file creation and were therefore retained for later chronological arrangement.
Further processing was done in R statistical software (R Core Team 2022). The entirety of the converted .txt files formed the initial dataset. Once the files were imported into the software, they were checked for correct data class assignment, completeness, consistency and plausibility. The next step was to extract the desired information from each file individually. Once the data associated with the Hall magnetic sensor had been located using the sensor-specific identifier, a conversion factor had to be applied to obtain the length of the spooled-out mainline in meters and thus the distance of the carriage from the base machine over time. Finally, individual file data consisting of timestamp and converted Hall magnetic sensor information were merged into one file per day and arranged chronologically according to timestamps from the file names.
The »findpeaks« function from the R-package »pracma« (version 2.4.2, Borchers 2022) was used to automatically determine the cycle break points. This is a general function for identifying peaks in time series, offering extensive options for specifying peak characteristics, such as minimum number of increasing/decreasing steps before or after a point, minimum peak height or minimum distance between two peaks. To identify the break point between cycles – the start of outhaul – the data was searched for peaks/positions as close as possible to the base machine, preceded by a plateau in the carriage movement and followed by an extended series of increasingly distant positions (Fig. 1). Appropriate parameter settings had to be established iteratively by visually checking for correct peak assignment and verifying that the total number of cycles matched the OCU recordings. Cycle time was determined by calculating the differences between peak/break point timestamps (Fig. 1). The daily cycle time data was then consolidated into a file and a cycle number was assigned according to the chronological order of the cycles. Finally, data was linked to OCU and VID data by cycle number in the Microsoft Excel spreadsheet.
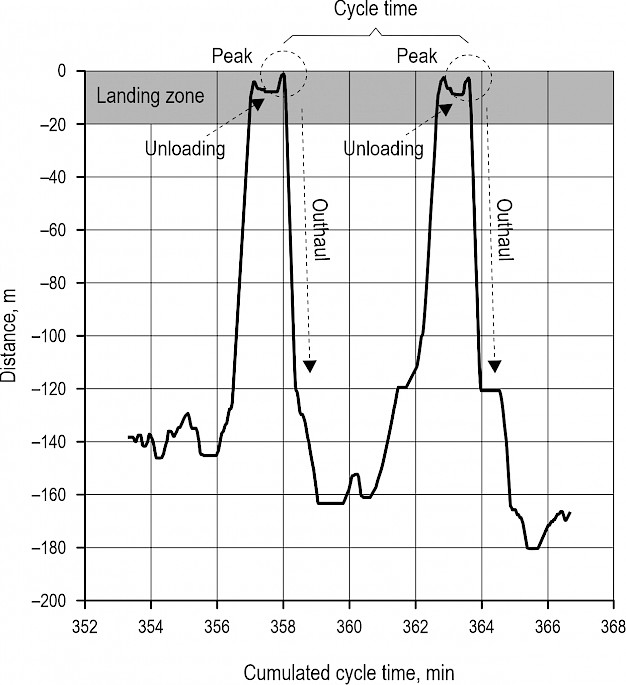
Fig 1. In MAC, a general function for identifying peaks in time series was used to identify break points between work cycles, based on the carriage position on the corridor over time, using information obtained from the Hall magnetic sensor installed on the mainline drum. A peak was considered a break point if 1) the carriage was within the landing zone, 2) it followed a period of stable carriage position and 3) it was followed by a long sequence of increasingly distant points. Cycle time was then calculated as the difference between successive peaks
To compare study methods, a final dataset was established by filtering OCU, MAC and VID cycle times compiled in the Microsoft Excel spreadsheet for cycles covered in all three studies. Analyses were performed in R statistical software (R Core Team 2022). The Tukey HSD (Honest Significant Difference) test and RMSE were used to determine whether, and to what extent, cycle time differed significantly between studies at operation and day levels and how potential deviations affected efficiency and productivity metrics. For all analyses, the chosen significance level was α<0.05.
3. Results
3.1 Cycle Coverage by Method
A total of 182 cycles were included in the studies, but none of the studies included all cycles. The highest coverage rate was observed in the OCU study (181; 99.5%), followed by MAC (178; 97.8%) and VID studies (172; 94.5%), and total recorded cycle time ranged from 1076.2 min (VID) to 1115.6 min (OCU) (Table 1). From this initial dataset, a number of cycles were removed due to lack of coverage or failure to pass plausibility checks. On day 1, these amounted to four and eight cycles covered by the OCU study but not by the MAC and VID studies, respectively, due to recording errors and technical problems with the camera, reducing the total number of cycles from 69 initially to 58 in the consolidated dataset. The recordings covered all (MAC; 40) or all but one (OCU, VID; 39) cycles on the second day. In MAC, however, the cycle time results did not meet plausibility check criteria, such as differences between time stamps for work periods in the morning, between the lunchbreak and the relocation to corridor 2 or after the relocation, and especially with respect to cycle time patterns in comparison to OCU and VID studies. A thorough review of the analysis algorithm did not reveal any technical errors in the analysis, so it had to be assumed that the source of the error was located in the raw machine data files. Therefore, comparability could not be ensured and the data was therefore excluded from further analysis. On the third day, the cycles (73) were fully covered in all studies. The final, consolidated dataset then consisted of 131 cycles (72.0% of the total observed cycles), and total cycle times corresponded to 75.2%, 75.7% of and 79.0% of the recorded totals for OCU, VID and MAC studies, respectively.
Table 1 Cycle time coverage by study - initial (172 to 181 cycles), removed (39 to 50 cycles) and consolidated cycles (131 cycles). Day 2 data had to be removed entirely due to a lack of MAC data to pass the plausibility check. Numbers in parentheses represent the respective proportion in initial cycle time
|
Study |
Initial cycle time, min |
Removed cycle time, min |
Consolidated cycle time, min |
|||||||||
|
|
Total |
Day |
Total |
Day |
Total |
Day |
||||||
|
|
|
1 |
2 |
3 |
|
1 |
2 |
3 |
|
1 |
2 |
3 |
|
OCU |
1115.6 |
436.8 |
231.3 |
447.5 |
276.4 |
45.1 |
231.3 |
0.0 |
839.2 |
391.7 |
0.0 |
447.5 |
|
|
100.0% |
100.0% |
100.0% |
100.0% |
24.8% |
10.3% |
100.0% |
0.0% |
75.2% |
89.7% |
0.0% |
100.0% |
|
MAC |
1110.5 |
420.0 |
244.5 |
446.0 |
270.2 |
25.7 |
244.5 |
0.0 |
840.3 |
394.3 |
0.0 |
446.0 |
|
|
100.0% |
100.0% |
100.0% |
100.0% |
24.3% |
6.1% |
100.0% |
0.0% |
75.7% |
93.9% |
0.0% |
100.0% |
|
VID |
1076.2 |
404.2 |
217.1 |
455.0 |
225.8 |
8.8 |
217.1 |
0.0 |
850.4 |
395.4 |
0.0 |
455.0 |
|
|
100.0% |
100.0% |
100.0% |
100.0% |
21.0% |
2.2% |
100.0% |
0.0% |
79.0% |
97.8% |
0.0% |
100.0% |
3.2 Cycle Time Accuracy
Total cycle time was slightly shorter in OCU (–11.2 min; –1.3%) and MAC (–10.1 min; –1.2%) than in the reference study (VID), mainly due to differences on day 3 (OCU: 7.5 min, 1.6%; MAC: 9.0 min, 2.0%) (Table 2). However, the mean cycle times did not differ significantly between OCU and MAC studies and the VID study (OCU vs. VID: p=0.997; MAC vs. VID: p=0.997) or between OCU and MAC (p=0.999), neither on operation level, nor on day 1 (OCU vs. VID: p=0.994; MAC vs. VID: p=0.999; OCU vs. MAC: p=0.997) or day 3 (OCU vs. VID: p=0.968; MAC vs. VID: p=0.954; OCU vs. MAC: p=0.999) level. The similarity of all other statistical parameters to the reference variant also suggested that the cycle times in both the MAC and OCU studies were accurately measured.
Table 2 Comparison of time consumption on operation and day level: mean, standard deviation, Min, Max and median by study
|
Study |
Observational unit |
Cycles, N |
Total, min |
Mean, min |
SD, min |
Min, min |
Max, min |
Median, min |
|
OCU |
All cycles |
131 |
839.2 |
6.4 |
2.9 |
1.3 |
17.5 |
5.9 |
|
|
Day 1 |
58 |
391.7 |
6.8 |
3.3 |
1.3 |
17.5 |
6.0 |
|
|
Day 3 |
73 |
447.5 |
6.1 |
2.5 |
1.9 |
14.8 |
5.8 |
|
MAC |
All cycles |
131 |
840.3 |
6.4 |
2.9 |
1.5 |
18.0 |
5.9 |
|
|
Day 1 |
58 |
394.3 |
6.8 |
3.3 |
1.5 |
18.0 |
6.1 |
|
|
Day 3 |
73 |
446.0 |
6.1 |
2.5 |
2.0 |
14.8 |
5.7 |
|
VID |
All cycles |
131 |
850.4 |
6.5 |
2.9 |
1.4 |
17.9 |
6.0 |
|
|
Day 1 |
58 |
395.4 |
6.8 |
3.3 |
1.4 |
17.9 |
6.1 |
|
|
Day 3 |
73 |
455.0 |
6.2 |
2.6 |
2.0 |
15.1 |
5.9 |
While the average cycle time deviations of MAC and OCU from VID did not differ statistically significant (p=0.926), the RMSE was more than three times (340.7%) greater in OCU study than in MAC study on operation level, indicating that cycle times could be more accurately determined from machine data than from field observation (Table 3). A closer look revealed that the performance of the OCU study improved significantly from day 1 (409.1%) to day 3 (185.7%), but could not reach the accuracy levels of MAC. This is further confirmed by the wider range of standard deviation, minimum and maximum values on day 1.
Table 3 Deviation of OCU and MAC cycle time from the reference study (VID) on operation and day level: mean, standard deviation, Min, Max, median and RMSE
|
Study |
Observational unit |
Cycles, N |
Mean |
SD, min |
Min, min |
Max, min |
Median, min |
RMSE |
|
OCU |
All cycles |
131 |
–0.08 |
0.94 |
–5.68 |
5.30 |
–0.12 |
0.92 |
|
|
Day 1 |
58 |
–0.06 |
1.36 |
–5.68 |
5.30 |
–0.14 |
1.35 |
|
|
Day 3 |
73 |
–0.10 |
0.39 |
–0.73 |
2.94 |
–0.12 |
0.39 |
|
MAC |
All cycles |
131 |
–0.08 |
0.26 |
–0.76 |
1.84 |
–0.10 |
0.27 |
|
|
Day 1 |
58 |
–0.02 |
0.33 |
–0.69 |
1.84 |
–0.05 |
0.33 |
|
|
Day 3 |
73 |
–0.12 |
0.17 |
–0.76 |
0.42 |
–0.13 |
0.21 |
4. Discussion
The rapid evolution of IT hardware and increasing customer demand for services based on machine sensor data has led to a significant increase in the availability of structured machine sensor data for cable yarding equipment. This opens up great opportunities for scientific investigations, by making available a wide range of robust data that was previously impossible or difficult to obtain (Spencer et al. 2021). This is particularly true for time studies, which have been an integral part of the forest engineering research toolbox for over a century. Here, machine sensor data could help to overcome the traditional trade-off between level of detail and temporal scope of time studies, as long-term data are now available with minimal resource input and at a level of detail that previously could only be achieved through labour-intensive cycle-level time studies. A crucial element is the determination of cycle time, which is the essential basis for investigating work efficiency.
The present study was the first to develop an algorithm to delimitate work cycles time from the standard machine sensor data of an integrated tower yarder and to evaluate the accuracy of automated delimitation by comparing its results with those obtained from video footage (the most accurate reference method). The study achieved its objective of developing an algorithm that can reliably delimit work cycles and that can do so with greater accuracy than its human counterpart can do with a classic manual time study. However, the algorithm developed in this study has some weaknesses. First, for a generic function to identify peaks in a time series, a certain degree of heterogeneity in the parameter under consideration is required, which is an inherent weakness when yarding over short distance, when the carriage does not leave the landing zone and the lateral yarding distance is short. In that case, the algorithm may struggle to identify unambiguous »peaks«. Second, the algorithm requires the pre-setting of peak characteristic parameters, which are usually unknown without some previous knowledge of the actual operation. In the present study, these had to be iteratively determined and adjusted whenever interrupting events affected the machine data acquisition (e.g. machine relocation or actuation of the machine main power supply switch). That is especially important when analysing longer time periods (e.g. half-shift level, shift level), and it is not yet certain whether this process can also be automated, which would be a crucial prerequisite for truly automated delimitation.
Regarding the deviations of the daily and total cycle times of the OCU and MAC studies from the video reference, it must be pointed out that they were within a very narrow range of about 11 minutes (1.3%) of the total cycle time recorded in VID study, or about 5 seconds per cycle. There are several potential sources of error that could have caused this deviation. First, in both OCU and VID studies, cycle time was determined by humans, thus error size was largely dependent on the skill and practice of the researcher (Nuutinen et al. 2008). In this respect, the results of the VID study can be considered more accurate than those of the OCU study, as the time pressure of recording cycle times during the actual operation was removed from the task (Palander et al. 2012). The cumulative effect of those marginal differences in delimitation between studies may have introduced some error. However, given the general similarity of total cycle times in VID and OCU, it is reasonable to assume that data from the reference study were generally valid. Nevertheless, data from day 2 were excluded from further analysis, even if it was not possible to establish conclusively why those data were incorrect, plausible as they were. Such an event does highlight the importance of always validating machine data.
There are a number of lessons that can be learnt from this study for future studies involving cycle time determination from tower yarder machine sensor data. First, it is necessary to have a detailed understanding of the content and structure of the data, as well as of the underlying machine mechanisms that affect it. In this study, one needed to actuate the machine main power supply switch to initiate the creation of a new set of machine sensor data files, and to correctly identify the zero position of the mainline (the closest position of the carriage to the tower); otherwise that has to be manually corrected during data processing, which precludes full automation of the process. Second, combinations of different sensor data are required to correctly deliminate cycles when operating close to the machine and to allow work task delimination. To that end, mainline drum data from the Hall sensor could be supplemented with remote control or hydraulic system sensor data. In addition, remote control data from the two mutually exclusive devices operated by the choker setter at the loading site and the operator in the yarder cab at the unloading site could provide a more accurate alternative to the current peak location approach, as it would allow the initiation of outhaul, as well as any other remotely controlled action to be determined directly without having to rely on a generic function such as the mainline operation task used in this study. However, there may be a time lag between the remote button being pressed, the hydraulics responding and the actual action being taken, which may require break point adjustment. Alternatively, hydraulic system control data (electronic signal data from solenoid valve actuation) could be used for this task.
Future promising research directions lie in the fusion of different sensor data (Pierzchala et al. 2018), with the specific goal of integrating into the time study additional information, such as yarding and lateral yarding distance or load volume. The dataset used in this study would have allowed the determination of both yarding and lateral yarding distance, which could be obtained by combining Hall sensor data with remote control or hydraulic system control data. At the same time, piece volume data could be easily obtained from the machine on-board computer (OBC), which receives that information from the processor head. However, it is very difficult to associate a specific turn volume to each cycle, because of the time lag between the unloading of a turn and its processing. In addition, the processing of trees (or pieces) may not follow the order in which they are delivered. This could be overcome by novel solutions such as built-in load cells and photogrammetric methods, which are currently being tested (Borz et al. 2022b), but all of which require the installation of additional sensors. If one wants to use the standard data made available by the machine OBC, then it could be possible to implement sophisticated artificial intelligence methods, which could also enable experts to better understand why a particular result was achieved and thus gain additional insights into the complex processes of timber harvesting. This would also allow for the formulation of previously unknown »what-if« scenarios (counter-factuals), and a further assessment of the potential for optimisation (Borz et al. 2022a, Holzinger et al. 2022).
5. Conclusion
This study was conducted as a follow-up study to the study by Varch et al. (2020), which was the first to use machine sensor data from an integrated tower yarder to determine fuel consumption in a classic time study. The aim of the present study was to determine the number and duration of work cycles using machine sensor data, and to evaluate its accuracy by comparing it with a video based reference and a classic manual time study. It was shown that cable yarding work cycles can be reliably and accurately delimitated based on machine sensor data derived from the machine CAN system.The results also showed that the accuracy is higher than that of a classic manual time study. However, the need to exclude some of the recorded data from the analysis in the present study showed that special attention must be paid to plausibility checks of both machine and reference data in comparative studies of this type. The current, semi-automated approach can be considered a temporary solution at best and it will require substantial refinement in data transfer, processing and reporting to allow truly automated cycle or work task time determination. For automated time studies, it will also need to be supplemented with automated determination and linkage to other operational parameters, such as yarding and lateral yarding distance or load volume.
Acknowledgments
This study was supported by the project Digi4 + and was financed by the Austrian Federal Ministry of Agriculture, Regions and Tourism under project number 101470. The Authors thank Mr. Markus Konrad and Mr. Mario Krusch, both Konrad Forsttechnik GmbH for giving access to their machines sensor data, as well as logistical and technical support of the study. Further thanks to Josipovic company for allowing access to their operation and offering full support to the experiment.
6. References
Baek, S., Cho, K., Lee, E., 2020: Performance Comparison for Two Cable Extraction Machines in a Larix kaempferi (Lamb.) Carr. Plantation. Sustainability 12(21): 8864. https://doi.org/10.3390/su12218864
Borz, S.A., Cheta, M., Birda, M., Proto, A.R., 2022a: Classifing operational events in cable yarding by a machine learning application to GNSS-collected data: A case study on gravity-assisted downhill yarding. Bulletin of the Transilvania University of Brasov. Series II: Wood Industry, Agricultural Food Engineering 15(64): 13–32. https://doi.org/10.31926/but.fwiafe.2022.15.64.1.2
Borz, S.A., Morocho Toaza, J.M., Forkuo, G.O., Marcu, M.V., 2022b: Potential of Measure App in Estimating Log Biometrics: A Comparison with Conventional Log Measurement. Forests 13(7): 1028. https://doi.org/10.3390/f13071028
Brandstorm, A.J.F., 1933: Analysis of logging cost and operating methods in the douglas fir region. Charles Lathrop Pack Forestry Foundation. West Coast Lumberman´s Association. Pacific Northwest Forest Experimental Station. United States Department of Agriculture, 117 p.
Brewer, J., Talbot, B., Belbo, H., Ackerman, P., Ackerman, S., 2018: A comparison of two methods of data collection for modelling productivity of harvesters: manual time study and follow-up study using on-board-computer stem records. Annals of Forest Research. 61(1): 109–124. https://doi.org/10.15287/afr.2018.962
Bruckmayer, T., 2009: Development of a Web Application for the Worldwide Management of Fire Trucks CAN Data. Master Thesis. Vienna University of Technology. Vienna.
Câmpu V.R., Ciubotaru A., 2017: Time consumption and productivity in manual tree felling with a chainsaw – a case study of resinous stands from mountainous areas. Silva Fennica. 51(2). article id 1657. https://doi.org/10.14214/sf.1657
CAN in automation 2011: CAN history. Available online: https://www.can-cia.org/can-knowledge/can/can-history/ (accessed 26th August 2022)
Cheta, M., Borz, S.A., 2017: Automating Data Extraction from GPS File and Sound Pressure Level Sensors with Application in Cable Yarding Time and Motion Studies. Bulletin of the Transylvanian University of Brasov. Series II: Forestry, Wood Industry, Agricultural Food Engineering 10(59) No. 1: 10 p.
Eker, M., Kurt, Y., 2021: Comparison of time measurement and recording tools with each other and stopwatch in terms of data sensitivity. Turkish Journal of Forestry 22(4): 375–385. https://doi.org/10.18182/tjf.1010148
Essen, L., 1936: The Dye Quartz Ring Oscillator as a Standard of Frequency and Time. National Physical Laboratory: 498–519. https://royalsocietypublishing.org/ (accessed 26 th August 2022)
Gallo, R., Visser, R., Mazzetto, F., 2021: Developing an Automated Monitoring System for Cable Yarding Systems. Croat. J. For. Eng. 42(2): 213–225. https://doi.org/10.5552/crojfe.2021.768
Holzinger, A., Saranti, A., Angerschmid, A., Retzlaff, C.O., Gronauer, A., Pejakovic, V., Medel, F., Krexner, T., Gollob, C., Stampfer, K., 2022: Digital Transformation in Smart Farm and Forest Operations needs Human-Centered AI: Challenges and Future Directions. Sensors 22(8): 3043. https://doi.org/10.3390/s22083043
Holzinger, A., Stampfer, K., Nothdurft, A., Gollob, C., Kieseberg, P., 2022: Challenges in Artificial Intelligence for Smart Forestry. European Research Consortium for Informatics and Mathematics (ERCIM) News 130: 40–41.
Konrad, M., Krusch, M. (Konrad Forsttechnik, Preitenegg, Carinthia, Austria). Personal communication, 2022.
Lee, E., Im, S., Han, S., 2018: Productivity and cost of a small-scale cable yarder in an uphill and downhill area: a case study in South Korea. Forest Science and Technology 14(1): 16–22. https://doi.org/10.1080/21580103.2017.1409662
Lindroos, O., Cavalli, R., 2016: Cable yarding productivity models: a systematic review over the period 2000–2011. Int. J. For. Eng. 27(2): 79–94 https://doi.org/10.1080/14942119.2016.1198633
Magagnotti, N., Kanzian, K., Schulmeyer, F., Spinelli, R., 2013: A new guide for work studies in forestry. Int. J. For. Eng. 24(3): 249–253. https://doi.org/10.1080/14942119.2013.856613
Magagnotti, N., Spinelli, R., Acuna, M., Bigot, M., Guerra, S., Hartsough, B., Kanzian, C., Kärhä, K., Lindroos, O., Roux S., Talbot B., Tolosana, E., Zormaier, F., 2012: Good practice guidelines for biomass production studies. CNR IVALSA: Sesto Fiorentino, Italy, 52 p.
Manner, J., 2015: Automatic and Experimental Methods to Studying Forwarding Work. Doctoral thesis. Department of Forest Biomaterials and Technology, Umea, 71 p.
Marrison, W.A., 1948: The evolution of the quartz crystal clock. The Bell System Technical Journal 27(3): 510–588. https://doi.org/10.1002/j.1538-7305.1948.tb01343.x
Merrett, F., 2006: Reflections on the Hawthorne Effect. Educational Psychology 26(1): 143–146. https://doi.org/10.1080/01443410500341080
Murata Manufacturing, available online: https://www.murata.com/en-global/products/timingdevice (accessed 22nd September 2022)
Neri, F., Laschi, A., Marchi, E., Marra, E., Fabiano, F., Frassinelli, N., Foderi, C., 2022: Use of Battery- vs. Petrol-Powered Chainsaws in Forests: Comparing Performance on Cutting Time. Forests 2022 13(5): 683. https://doi.org/10.3390/f13050683
Nuutinen, Y., Väätäinen, K., Heinonen, J., Asikainen, A., Röser, D., 2008: The Accuracy of Manually Recorded Time Study Data for Harvester Operation Shown via Simulator Screen. Silva Fennica 42(1): article id 264. https://doi.org/10.14214/sf.264
Palander, T., Nuutinen, Y., Kariniemi, A., Väätäinen, K., 2012: Automatic Time Study Method for Recording Work Phase Times of Timber Harvesting. Forest Science 59(4): 472–483. http://dx.doi.org/10.5849/forsci.12-009
Picchio, R., Venanzi, R., Di Marzio, N., Tocci, D., Tavankar, F., 2020: A Comparative Analysis of Two Cable Yarder Technologies Performing Thinning Operations on a 33 Year Old Pine Plantation: A Potential Source of Wood for Energy. Energies 13(20): 5376. https://doi.org/10.3390/en13205376
Pierzchala, M., Kvaal, K., Stampfer, K., Talbot, B., 2018: Automatic recognition of work phases in cable yarding supported by sensor fusion. Int. J. For. Eng. 29(1): 12–20. https://doi.org/10.1080/14942119.2017.1373502
Proto, A.R., Marci, G., Visser, R., Harril, H., Russo, D., Zimbalatti, G., 2018: Factors affecting forwarder productivity. Eur. J. For. Res. 137: 143–151. https://doi.org/10.1007/s10342-017-1088-6
Rohrer, R.A., Pitla, S.K., Luck, J.D., 2019: Tractor CAN bus interface tools and application development for real-time data analysis. Computers and Electronics in Agriculture 163: 104847.
Rossit, D.R., Olivera, A., Céspedes, V.V., Broz, D., 2019: A Big Data approach to forestry harvesting productivity. Computers and Electronics in Agriculture 161: 29–52. https://doi.org/10.1016/j.compag.2019.02.029
Spencer, G., Mateus, F., Torres, P., Dionisio, R., Martins, R, 2021: Design of CAN Bus Communication for Forestry Machines. Computers 10(11): 144. https://doi.org/10.3390/computers10110144
Spinelli, R., Magagnotti, N., Cosola, G., Labelle, E., Visser, R., Erber, G., 2021: The Effect of Yarding Technique on Yarding Productivity and Cost: Conventional Single-Hitch Suspension vs. Horizontal Double-Hitch Suspension. Croat. J. For. Eng. 42(3): 369–380. https://doi.org/10.5552/crojfe.2021.886
Strandgard, M., Mitchell, R., 2015: Automated Time Study of Forwarders using GPS and a vibration sensor. Croat. J. For. Eng. 36(2): 175–184.
Sung, J., 2018: The Fourth Industrial Revolution and Precision Agriculture. Automation in Agriculture – Securing Food Supplies for Future Generations. IntechOpen. London, 15 p. http://dx.doi.org/10.5772/intechopen.71582
Tolsana, E., Spinelli, R., Aminiti, G., Laina, R., Lopez-Vicens, I., 2018: Productivity, Efficiency and Environmental Effects of Whole-Tree Harvesting in Spanish Coppice Stands Using a Drive-to-Tree Disc Saw Feller-Buncher. Croat. J. For. Eng. 39(2): 163–172.
Van Tassel, J., Bluestone, D.W., 1940: Mechanization in the lumber industry. National Research Project. Report No. M-5, Philadelphia, Pennsylvania, 201 p.
Varch, T., Erber, G., Spinelli, R., Magagnotti, N., Stampfer, K., 2021: Productivity, fuel consumption and cost in whole tree cable yarding: conventional diesel carriage versus electrical energy-recuperating carriage. Int. J. For. Eng. 32(1): 20–30. https://doi.org/10.1080/14942119.2020.1848178
Waterhouse, J.D., 1942: The Advantages and Problems of Torque Converters as Used on Logging Equipment on the Pacific Coast. Bachelor Thesis, Oregon State College, Oregon, 26 p.
Witten, I.H., Frank, E., 2005: Data Mining – Practical Machine Learning Tools and Techniques, 2nd Edition, University of Waikato, Morgan Kaufmann Publishers: Burlington, Massachusetts, 525 p.
Yilmaz, R., Acar, M., Öztürk, T., 2022: Productivity of Hauling by Tajfun MOZ 500 GR Cable Yarder in Turkey. Forestist 72(3): 313–319. https://doi.org/10.5152/forestist.2022.22011
© 2023 by the authors. Submitted for possible open access publication under the
terms and conditions of the Creative Commons Attribution (CC BY) license (http://creativecommons.org/licenses/by/4.0/).
Authors' addresses:
Thomas Varch, MSc *
e-mail: thomas.varch@boku.ac.at
Dennis Malle, BSc
e-mail: dennis.malle@students.boku.ac.at
Gernot Erber, PhD
e-mail: gernot.erber@boku.ac.at
Prof. Andreas Holzinger, PhD
e-mail: andreas.holzinger@boku.ac.at
Prof. Karl Stampfer, PhD
e-mail: karl.stampfer@boku.ac.at
University of Natural Resources and Life Sciences, Vienna
Department of Forest and Soil Sciences
Institute of Forest Engineering
Peter Jordan Strasse 82
1190, Vienna
AUSTRIA
Christoph Gollob, PhD
e-mail: christoph.gollob@boku.ac.at
University of Natural Resources and Life Sciences, Vienna
Department of Forest and Soil Sciences
Institute of Forest Growth
Peter Jordan Strasse 82
1190, Vienna
AUSTRIA
Raffaele Spinelli, PhD
e-mail: raffaele.spinelli@ibe.cnr.it
CNR-IBE Consiglio Nazionale delle Ricerche – Istituto per la BioEconomia
Via Madonna del Piano 10
50019, Sesto Fiorentino (FI)
ITALY
Rien Visser, PhD
e-mail: rien.visser@canterbury.ac.nz
School of Forestry, University of Canterbury
Private Bag 4800
8140 Christchurch
NEW ZEALAND
* Corresponding author
Received: November 28, 2022
Accepted: March 05, 2023
Original scientific paper