
Evaluation of Light Falling Weight Deflectometer for In Situ Measurement of Secondary Deformation Modulus of Various Forest Road Pavements
doi: 10.5552/crojfe.2023.2125
volume: 44, issue:
pp: 14
- Author(s):
-
- Grajewski Sylwester M.
- Article category:
- Original scientific paper
- Keywords:
- bearing capacity of forest road, static plate load test, PLT, VSS, LWD, LFWD, PFWD
Abstract
HTML
Roads in forests are necessary for proper forest management and active protection of the natural environment. They facilitate tourism and recreation and have a very important function in firefighting. The cost of building roads in forest areas is considerable, even when relatively cheap materials such as aggregates of natural or anthropogenic origin are used. Therefore, any road investment must be well prepared and executed. Bearing capacity and compaction are among the most important and frequently used geotechnical parameters in road construction. The aim of this study was to determine the possibility of predicting the value of the secondary deformation modulus E2 (obtained from measurements with a static plate load test – PLT) based on measurements with a light falling weight deflectometer (LFWD) Zorn, type ZFG 3000 GPS with a drop weight of 10 kg. The regression analysis included 245 results of bearing capacity measurements carried out on 46 forest road sections with various road pavements. Different regression models were tested: linear, logarithmic, polynomial, exponential and power models, excluding polynomials of fourth and higher degree. Prediction of E2 (PLT) values from dynamic deformation modulus Evd (LFWD) values is possible. However, the reported unsatisfactory strength of the relationship between the two parameters is associated with a high risk of error (r=0.73, R2=0.54, Se=80.37 MN·m-2). Neither the use of more complex non-linear regression models nor the use of multiple regression by introducing an additional estimator in the form of the s/v ratio significantly improved the estimation results. The quality of the prediction of E2 values is not constant. It varies depending on the type of forest road pavements, the use of geosynthetic pavement reinforcements and the type of road subgrade. The study also found that the quality of E2 prediction can be improved by limiting the range of tested Evd values upwards. It is advisable to continue this type of research, as the results obtained could be the basis for developing national standards for the application of LFWD to control the bearing capacity and compaction of forest road surfaces in the future.
Evaluation of Light Falling Weight Deflectometer for In Situ Measurement of Secondary Deformation Modulus of Various Forest Road Pavements
Sylwester M. Grajewski
Abstract
Roads in forests are necessary for proper forest management and active protection of the natural environment. They facilitate tourism and recreation and have a very important function in firefighting. The cost of building roads in forest areas is considerable, even when relatively cheap materials such as aggregates of natural or anthropogenic origin are used. Therefore, any road investment must be well prepared and executed. Bearing capacity and compaction are among the most important and frequently used geotechnical parameters in road construction. The aim of this study was to determine the possibility of predicting the value of the secondary deformation modulus E2 (obtained from measurements with a static plate load test – PLT) based on measurements with a light falling weight deflectometer (LFWD) Zorn, type ZFG 3000 GPS with a drop weight of 10 kg. The regression analysis included 245 results of bearing capacity measurements carried out on 46 forest road sections with various road pavements. Different regression models were tested: linear, logarithmic, polynomial, exponential and power models, excluding polynomials of fourth and higher degree. Prediction of E2 (PLT) values from dynamic deformation modulus Evd (LFWD) values is possible. However, the reported unsatisfactory strength of the relationship between the two parameters is associated with a high risk of error (r=0.73, R2=0.54, Se=80.37 MN·m-2). Neither the use of more complex non-linear regression models nor the use of multiple regression by introducing an additional estimator in the form of the s/v ratio significantly improved the estimation results. The quality of the prediction of E2 values is not constant. It varies depending on the type of forest road pavements, the use of geosynthetic pavement reinforcements and the type of road subgrade. The study also found that the quality of E2 prediction can be improved by limiting the range of tested Evd values upwards. It is advisable to continue this type of research, as the results obtained could be the basis for developing national standards for the application of LFWD to control the bearing capacity and compaction of forest road surfaces in the future.
Keywords: bearing capacity of forest road, static plate load test, PLT, VSS, LWD, LFWD, PFWD
1. Introduction
Roads in forests are essential for proper forest management and active protection of the natural environment (Kaakkurivaara et al. 2015). Forest roads also facilitate tourism and recreation and have a very important function in fire prevention (Queen et al. 1997, Suzuki et al. 1998, Gumus et al. 2008, Termansen et al. 2008, 2013, Santiago and Loomis 2009, Keramati et al. 2020). Sustainable forest management is therefore not possible without an adequate network of forest roads classified as Low Volume Roads (LVR) (Uusitalo 2010, Bitir et al. 2021). The definition of LVR includes roads (together with public roads) with an average traffic volume of <400 vehicles per day. Other characteristics of these roads are low design speed and appropriate geometry. Many of the LVRs, including forest roads, are single-lane roads with gravel or even native surfaces, whose load-bearing capacity varies greatly depending on the weather and season (Coghlan 2000).
State Forests – National Forest Holding (the main administrator of forest areas in Poland) takes care of almost 107 thousand km of internal roads of different rank in the communication networks of forest transport areas (Grajewski 2022). The vast majority of them have a native surface (71%). Surfaces of gravel, crushed stone, cinders, cobblestones, etc. are found on about 20% of the total length of all forest roads, and bituminous/concreted surfaces account for only 9% of their length (Grajewski 2022). Natural aggregates obtained from the crushing of solid rock, with particle sizes of 0/4 mm, 4/31 mm, 31.5/63.0 mm (alternatively somewhat cheaper road aggregates with particle sizes of 0/31.5 mm and 0/63.0 mm) are most commonly used for forest roads. Other natural aggregates such as gravels, all-in aggregates (hoggins) and sands are also commonly used. Certified substitutes for natural aggregates from recycled bricks or concrete are increasingly used for road surface design (Grajewski 2019). At the same time, designers are increasingly interested in using the undisputed advantages of modern planar and spatial geosynthetics such as woven geotextiles, biaxial or triaxial geogrids and geocells to reinforce forest roads (Ashmawy and Bourdeau 1996, Latha et al. 2010, Hegde 2017). Road sections that are exposed to particularly high loads are built with much more expensive but also more efficient bitumen and concrete technologies – poured or rolled concrete. An alternative to these costly solutions are technologies with prefabricated concrete elements or the surface treatment of existing aggregate pavements with asphalt emulsions (Grajewski 2022).
The prospect of having to continue to invest heavily in forest road infrastructure forces investors to look for quick, relatively inexpensive and at the same time reliable methods of assessing the quality of the construction work. These are indispensable in any investment process.
Bearing capacity and compaction are among the most important and most frequently used geotechnical parameters in practise. Bearing capacity and compaction tests on most cubic and linear objects have been carried out for many years with the static plate load test (PLT), from diagnosing the subsoil to checking the quality of the work. The basics of the PLT method were developed in Switzerland and it is still very popular in many countries, especially in Europe. At the same time, it is one of the most frequently used methods for measuring the bearing capacity parameters of forest roads in Poland.
Despite the obvious inconveniences (see Section 2.1), the PLT remains the basic method for assessing the accuracy of road investments in Polish forests (Trzciński 2011, Grajewski 2019). It provides incontestable data on the condition of the studied area and the quality of execution of road works at relatively low cost. Equally important, this method is considered a reference for other methods of bearing capacity testing or determination of layer compaction.
The use of a light falling weight deflectometer (LFWD) is increasingly being considered as a supplement or even alternative to the static plate load test. LFWD is also known as light weight deflectometer (LWD), portable falling weight deflectometer (PFWD), light drop-weight (LDW) or light drop-weight tester (Livneh and Goldberg 2001, Sulewska 2004, Steinert et al. 2005, Nazzal et al. 2007, Sabouri et al. 2022). The concept of dynamic loading used in LFWD is also applied to another important piece of roadside device – the falling weight deflectometer (FWD). This large and heavy equipment is installed in trailers, vans or trucks. The FWD is the most important device used in many countries around the world to assess the physical properties of road surfaces on motorways, local roads, airport pavements, port areas, railway lines and elsewhere. The loads and sensor sets used in the measurements allow the diagnosis of entire pavement structures, including the road subgrade. A disadvantage of this equipment is the considerable initial cost and the one-off survey, which usually has to be planned well in advance. The LFWD (in a sense a miniaturised version of the FWD), on the other hand, is a much smaller, lighter, cheaper, always portable and handy device. Due to the generation of a relatively small pulse, the LFWD can measure the stiffness of the upper layers of the pavement without providing reliable predictions for the deeper layers.
In contrast to the static plate, the advantages of this device are that:
- it is small and does not require a counterweight
- the measurement can be performed in a very short time
- the results are obtained immediately after the measurement and are automatically stored in the recording device that works together with the plate, eliminating the risk of errors
- the test can be carried out in almost all conditions, e.g. in narrow and deep excavations where it would not be possible to set up a counterweight for the PLT measurement
- the large number of results allows not only a more complete control of the object, but also a statistical processing of the measurement results.
There is no doubt that LFWD is a useful device for testing the stiffness and compaction of aggregates and soils on the road. This has been demonstrated and repeatedly confirmed in numerous scientific studies under laboratory conditions and in field tests for both public roads (e.g. Livneh and Goldberg 2001, Sulewska 2004, 2012, Alshibli et al. 2005, Fleming et al. 2007,) and forest roads (Kestler et al. 2007, Kaakkurivaara et al. 2015, Zednik et al. 2015, Lehmann et al. 2020, Bitir et al. 2022). There are many publications aimed at developing and improving LFWD test methods, searching for and analysing factors that influence measurement results, or establishing correlations between LFWD results and other geotechnical parameters (e.g. Rafalski 1985, Shahid et al. 1997, Fleming 2000, Szpikowski et al. 2005, Mooney and Miller 2009, Kavussi et al. 2010, Stamp and Mooney 2013, Kamal et al. 2018). Great success has been achieved in comparing LFWD with falling weight deflectometer (FWD), dynamic cone penetrometer (DCP), Benkelman beam or California Bearing Ratio (CBR). The correlations obtained in the measurement results, which are usually at least good, mean that the instruments tested are interchangeable (Steinert et al. 2005, Kestler et al. 2007, Nazzal et al. 2007, Horak et al. 2008, Kongkitkul et al. 2014, Guzzarlapudi et al. 2016, Kamal et al. 2018, Sudarsono et al. 2020). This provides an opportunity to significantly accelerate and improve the survey service with ongoing road investments (e.g. Livneh and Goldberg 2001, Steinert et al. 2005, Fleming et al. 2007, Kestler et al. 2007, Nazzal et al. 2007, Horak et al. 2008).
Unfortunately, the number of studies on the relationship between LFWD and PLT is smaller and their results are characterised by greater uncertainty in interpretation (Table 1). Two factors seem to be the main reasons for this. Firstly, the result of the LFWD measurement does not only depend on the characteristics of the tested layer, but may also depend to varying degrees on a number of other factors related to both the type of measurement and the design of the equipment used, i.e.: the way the test site is prepared; the number, type and position of the sensors measuring the displacement of the load plate; the value of the contact stress; the stiffness and the radius of the load plate. Secondly, a clear assessment is not facilitated by the different PLT test standards in different countries. The differences include the maximum loads applied, the number of stages of loading/unloading the plate, the time of loading/unloading in each stage or the load ranges used to calculate the modulus values (e.g. PN-S-02205:1998 vs. DIN 18134:2012-04). There is therefore a need to continue research on a detailed relationship between LFWD and PLT, which should at least lead to the adoption of national standards for the use of LFWD. Thus, there is a need to continue global research to examine the relationship between LFWD and PLT in detail. These should lead to resolutions to determine the interchangeability of the two types of instruments and the use of PLT parameter prediction based on LFWD data. Furthermore, the results of such studies should lead to the establishment of a solid basis for the development of at least national standards for the use of LFWD. Forest road construction should be an area that requires special attention due to its specificity and usually weaker regulations than those foreseen for public road construction (Kaakkurivaara et al. 2015, Grajewski 2019).
The aim of the research was to determine the possibility of predicting the value of the secondary deformation modulus from the static plate load tests based on measurements with a Zorn light falling weight deflectometer, type ZFG 3000 GPS with a drop weight of 10 kg. The following research questions were formulated as part of the project:
- Does the use of the Zorn ZFG 3000 GPS LFWD with a drop weight of ten kilogrammes enable a simple and accurate prediction of the value of the secondary deformation modulus when testing the bearing capacity of various forest road pavements?
- Whether the Zorn ZFG 3000 GPS LFWD with a drop weight of ten kilogrammes has the same ability to predict the values of the secondary deformation modulus regardless of the type of forest road pavement tested, the use of geosynthetic pavement reinforcement or the bearing capacity of the road subgrade?
- Does the Zorn ZFG 3000 GPS LFWD with a drop weight of ten kilogrammes achieve the same quality in predicting secondary deformation modulus values over the full range of dynamic deformation modulus values obtained from LFWD bearing capacity measurements of forest road pavements?
Table 1 Selected results of comparative studies of dynamic deformation modulus Evd (LFWD) and secondary deformation modulus E2 (PLT)
|
Author |
Type of LFWD tested |
Test site |
Type of materials tested |
Results |
|
Nazzal et al. (2004) |
Prima 100 loading plate with 200 mm diameter 10 kg drop weight |
Field tests on motorway sections |
Pavement layers and subgrades: crushed limestone base, cement-treated base, cement-treated subbase, lime-treated subbase, clayey silt soil, cement-treated soil, lime-treated soil, blended calcium sulfate (BCS) |
E2 = 0.69Evd + 20.90 R2 = 0.94 Se = 29.80 |
|
Sulewska (2004) |
ZFG 01 loading plate with 300 mm diameter 10 kg drop weight |
Laboratory tests |
Medium sand |
Evd = 0.28E2 + 2.98 R2 = 0.91 |
|
Alshibli et al. (2005) |
Prima 100 loading plate with 200 mm diameter 10 kg drop weight |
Laboratory tests |
Clay, clayey silt, sand, cement-treated soil, crushed limestone, recycled asphalt pavement (RAP), sand-clay-gravel mix |
E2 = 25.25e0.006Evd R2 = 0.90 |
|
Ézsiás (2005) |
B&C loading plate with 163 mm diameter 11 kg drop weight |
Field tests |
1. Incineration slag
2. silty fine sand |
Evd = 1.44E2 + 7.38 R2 = 0.98 Evd = 0.64E2 + 19.80 R2 = 0.38 |
|
Szpikowski et al. (2005) |
ZFG 01 and ZFG 2000 loading plate with 300 mm diameter 10 kg drop weight |
Field tests on the subbase or embankment of the motorway |
1. Crushed stone (dolomite) 0/31,5 mm subbase
2. burned colliery shale 0/63 mm embankment
3. burned colliery shale embankment
4. non-burned colliery shale embankment
|
E2 = 2.10Evd + 71.68 r = 0.95, R2 = 0,90* E2 = 0.74Evd + 57.06 r = 0.30, R2 = 0.09* E2 = 0.73Evd + 57.52 r = 0.37, R2 = 0,14* E2 = 0.73Evd + 48.79 r = 0.56, R2 = 0,31* |
|
Szpikowski et al. (2005) |
ZFG 01 and ZFG 2000 loading plate with 300 mm diameter 10 kg drop weight |
Laboratory tests |
Sand-gravel mix, medium sand |
E2* = 1.67Evd + 8.24 r = 0.94, R2 = 0.89 E2* = 1.61Evd + 8.42 r = 0.78, R2 = 0.61 |
|
Almássy and Subert (2006) |
B&C loading plate with 163 mm diameter 11 kg drop weight |
Motorway field tests |
Sandy-gravel subgrade |
E2 =8.91 R2 = 0.76 |
|
Kim et al. (2007) |
Loading plate with 300 mm diameter 10 kg drop weight |
Field tests on motorway subgrade |
Silty sand subgrade |
Evd = 1.41E2 – 7.48 R2 = 0.77 |
|
Nazzal et al. (2007) |
Prima 100 loading plate with 200 mm diameter 10 kg drop weight |
Laboratory and field tests on motorway sections |
Pavement layers and subgrades: crushed limestone base, cement-treated base, cement-treated subbase, lime-treated subbase, clayey subbase, lime-treated subgrade, sand, blended calcium sulfate (BCS), recycled asphalt pavement (RAP) |
E2 = 0.88Evd R2 = 0.97 |
|
Tompai (2008) |
B&C loading plate with 163 mm diameter 10 kg drop weight |
Not specified |
1. Coarse and fine grained soils
2. silty soils
3. crushed stone subgrade
|
1. E2 = 0.90Evd R2 = 0.73 2. E2 = 0.80Evd R2 = 0,25 3. E2 = 0.93Evd R2 = 0.39 |
|
Tompai (2008) |
Loading plate with 300 mm diameter 10 kg drop weight |
Not specified |
1. coarse and fine grained soils
2. silty soils
3. crushed stone subgrade
|
1. E2 = 1.58Evd R2 = 0.55 2. E2 = 1.30Evd R2 = 0.72 3. E2 = 1.69Evd R2 = 0.67 |
|
Gorączko et al. (2014) |
ZFG 2000 loading plate with 300 mm diameter 10 kg drop weight |
Field tests on public roads |
Crushed stone 0/31.5 mm |
E2 = 1.95Evd + 18.30 r = 0.88*, R2 = 0.77 |
|
Sulewska and Bartnik (2017) |
ZFG 3000 loading plate with 300 mm diameter 10 kg drop weight |
Laboratory tests |
Crushed stone (dolomite) 0/31.5 mm subgrade comprised of layers: a reinforcement in the form of non-woven geotextile was laid on a layer of a weak soil subgrade |
E2 = 2.08Evd – 0.12 r = 0.86, R2 = 0.75 relative error ±25% |
|
Wyroślak (2017) |
ZFG 2000 loading plate with 300 mm diameter 10 kg drop weight |
Field tests on embankments |
Sand with an admixture of coarse dust |
Evd = 5.10 r = 0.95, R2 = 0.90 |
|
Decký et al. (2022) |
LDD 100 loading plate with 300 mm diameter 10 kg drop weight |
Field tests |
Loamy soils, sand and gravel soils, mixed soils, gravel sand pavement protection layers, crushed stones pavement subbase layers, stony fill pavement subbase layers |
E2 = 2,45Evd r = 0.85 |
* The values were calculated on the basis of the data provided by the authors of the publications
2. Materials and Methods
2.1 Assumptions for the Measurement of PLT and LFWD
The static plate load test measures vertical displacements (due to settlement) of the road subgrade or pavement layer(s) occurring during a double process of applying static pressure to a circular steel plate. According to the Polish regulations, between two cycles of loading of the plate, which are carried out stepwise every 0.05 MN·m-2 until the required final value is reached, unloading is also performed in steps of 0.1 MN·m-2 (BN-8931-02:1964, PN-S-02205:1998). The test starts with a preload (0.02 MPa) and setting the dial gauges to the 0.00 mm position. Then a pressure of 0.05 MN·m-2 is applied to the tested layer and the dial gauges are not read until the settlement has stabilised. The pressure is increased in steps of 0.05 MN·m-2 until the target level is reached, and the dial gauges are not read until the settlement has stabilised each time. The maximum final load is set to:
- 0.25 MN·m-2 – when testing the subgrade or embankment layer(s),
- 0.35 MN·m-2 – when testing the improved subgrade layer(s),
- 0.45 MN·m-2 – when testing the layers of the pavement layer(s),
- 0.55 MN·m-2 – when testing the entire road pavement.
Based on the measurement results, the values of two deformation moduli are calculated: the primary deformation modulus E1 (determined in the first loading cycle of the plate) and the secondary deformation modulus E2 (also determined in the second loading cycle of the plate) as well as the deformation index Io. The deformation moduli are calculated according to eq. (1), while the value of Io [-] is calculated according to eq. (2).
 (1)
(1)
Where:
Ei primary (E1) or secondary (E2) deformation modulus, MN·m-2
p load increase in the assumed interval: p=p0.15–p0.05 for the subgrade test, p=p0.25–p0.15 for the improved subgrade and structural pavement layers, p=p0.35–p0.25 for the entire road pavement, MN·m-2
s settlement increment corresponding to the load increment: s=s0.15–s0.05 for the subgrade, s=s0.25–s0.15 for the improved subgrade and structural pavement layers, s=s0.35–s0.25 for the entire road pavement, mm
D plate diameter, mm.
 (2)
(2)
Road pavement testing typically uses a 300 mm diameter plate to which pressure is applied by means of a hydraulic cylinder, supported by a counterweight of considerable mass – far greater than the force applied (Wyroślak and Ossowski 2016). The counterweight must allow the measuring device to be positioned at the test site and obtain meaningful measurement results (Krawczyk et al. 2015). A further complication of using static plates is the extended test time. A minimum of 1.5 hours is required to perform a measurement at a test point of a pavement according to the standard requirements (maximum load of 0.55 MN·m-2), provided that the measurements are not accompanied by surface deformations of more than 0.05 mm at two-minute intervals at each loading step/stage. Maintaining the correct time interval between loading and unloading steps is also very important to obtain meaningful results (Mackiewicz and Krawczyk 2015). An argument that sometimes discourages the use of this test method is also the need to secure sufficient space, which quite often leads to a short-term closure of the road section in question (Grajewski 2019).
During the LFWD test, the maximum displacement of the measuring plate, caused by the weight falling on it, is measured. The values of the displacements and their velocities are recorded, and on their basis the average values of the plate settlement (deflection of the tested surface) s [mm], the velocity of the plate settlement v [mm·s-1] and the ratio of these values s/v [ms] as well as the value of the dynamic deformation modulus Evd [MN·m-2] are calculated. Assuming a uniform stress distribution under the loading plate, the calculations of the dynamic deformation modulus are carried out according to eq. (3).
 (3)
(3)
Where:
Evd dynamic modulus of deformation, MN·m-2
σ mean value of the load under the plate, for a drop weight of 10 kg it is 0.1 MN·m-2
s mean settlement of the compression plate calculated from the results of 3 impacts (measurements) after 3 initial impacts, mm
r radius of the loading force, 150 mm when using a 300 mm diameter loading plate.
The s/v ratio, understood as the ratio between the value of the settlement of the loading plate under impact s and the settlement velocity v, can be interpreted as a measure of compaction (Sulewska 2012). It is assumed that the compaction of the tested layers is sufficient if the value of s/v does not exceed 3.5 ms (Zorn 2014).
2.2 Data Collection and Analysis
The values of the dynamic deformation modulus Evd, the s/v ratio and the secondary deformation modulus E2 were determined during bearing capacity measurements with a light falling weight deflectometer and static load plates. Over several years, 46 sections of forest roads with various pavements in western and central Poland were investigated (Fig. 1, Table 1). The bearing capacity measurements were carried out with:
- a light falling weight deflectometer ZFG 3000 GPS, manufactured by Zorn Instruments with a drop weight of 10 kg and a load plate with a diameter of 300 mm
- a static load plate (VSS) HMP PDG Pro, manufactured by Prüfgerätebau GmbH, equipped with 1 electronic displacement sensor and a load plate diameter of 300 mm
- a static load plate VSS-3P-000 7408, manufactured by Multiserw-Morek, equipped with 3 analogue displacement sensors and a load plate diameter of 300 mm
- a static load plate VSS-3P, equipped with 3 electronic displacement sensors and a load plate diameter of 300 mm.
The tests with static load plates were carried out in wheel path in accordance with the applicable Polish standards. Regardless of the type of road pavement, the plates were loaded twice with a maximum pressure of 0.55 MN·m-2. Based on the obtained measurement results, the E2 values were calculated according to eq. (1), assuming the incremental displacement of the plate s corresponding to the pressure difference p in the range of 0.25 to 0.35 MN·m-2.
The measurements of the LFWD were performed according to the methodology recommended by the plate manufacturer (Zorn 2014) and the Research Institute of Roads and Bridges in Warsaw (Szpikowski et al. 2005). The tests with a LFWD in the wheel path were each carried out simultaneously with the measurements with static load plates, with the measurement points placed in close proximity to the PLT points with a minimum distance of 1.0 m between them.
The structure of the roadway was recorded and geotechnical conditions were determined by open excavation of the pavement and geotechnical borings.
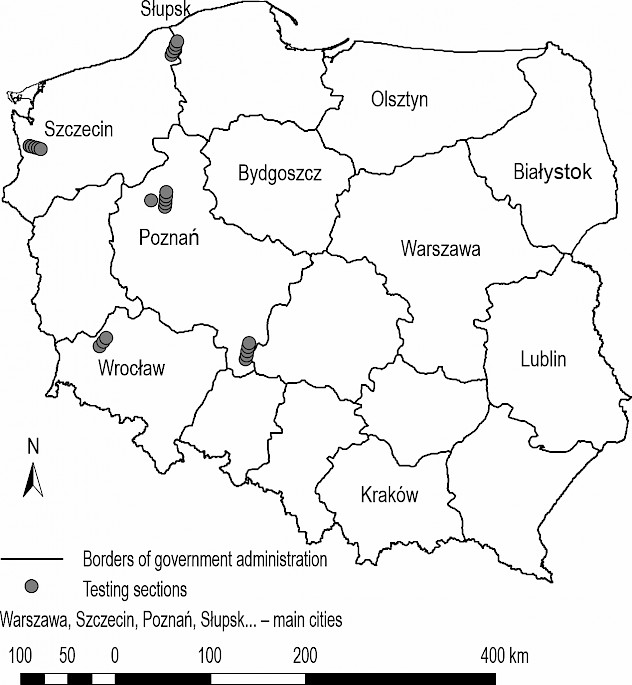
Fig. 1 Location of test road sections on administrative map of Poland
The office study included 245 paired Evd (s/v) and E2 values processed so that a PLT result corresponded to the average of at least 3 measurements with a LFWD. No outliers were removed from the database, which refers to the bearing capacity measurements carried out in practise. The data thus prepared were subjected to regression analysis in CurveExpert Professional 2.7.3 software (Hyams Development, Chattanooga, TN, USA). In the first stage, a simple regression with one independent variable (i.e. Evd) was used, while in the second stage a multiple regression with an additional explanatory variable, the s/v ratio, was applied. The modelling carried out in the different data groups (Table 2) focused on finding the simplest possible relationships between Evd and E2 that can be used in engineering practise. However, in order to obtain a more comprehensive assessment of the relationship between the parameters studied, not only linear models were tested, but also other models (logarithmic, polynomial, exponential and power models) – with the exception of fourth and higher degree polynomials.
Table 2 Variants of data sets subjected to regression analysis, together with their number (n), mean values of dynamic deformation modulus (vd), s/v ratio () and secondary deformation modulus (2)
|
Classification criteria |
Data group description |
n |
vd |
|
2 |
Group symbol |
|
All types of forest roads tested |
245 |
76.93 |
2.63 |
235 |
A |
|
|
Type of road pavement |
Forest roads with native surface (ungraded dirt road, graded dirt road, improved dirt road pavement) |
12 |
27.64 |
3.74 |
86 |
GN |
|
|
Forest roads with gravel or sand-gravel mix surface |
11 |
49.94 |
2.98 |
149 |
Mix |
|
|
Forest roads with surfaces made of optimal natural soil mixtures |
13 |
83.06 |
2.56 |
302 |
Mopt |
|
|
Forest roads with a surface of aggregates laid in typical McAdam technology |
81 |
72.41 |
2.54 |
212 |
McA |
|
|
Forest roads with aggregated surfaces |
41 |
69.07 |
2.72 |
177 |
CS |
|
|
Forest roads with pavements stabilised with hydraulic binders |
60 |
93.71 |
2.30 |
317 |
Stab |
|
|
Forest roads with surfaces made of recycled aggregates (concrete rubble, construction rubble, brick rubble) |
27 |
95.07 |
2.86 |
282 |
Rec |
|
Geomaterials reinforcement |
Forest roads with pavements not reinforced with geosynthetics |
176 |
81.98 |
2.58 |
258 |
GeoN |
|
|
Forest roads with pavements reinforced with geosynthetics (non-woven geotextiles, woven geotextiles, geogrids, geocells) |
69 |
64.04 |
2.76 |
177 |
GeoY |
|
Type of subgrade1 |
Forest roads on G1 subgrades |
184 |
82.30 |
2.56 |
255 |
G1 |
|
|
Forest roads on G2 subgrades |
21 |
66.85 |
2.59 |
194 |
G2 |
|
|
Forest roads on G3 and G4 subgrades |
40 |
57.48 |
2.98 |
169 |
G3/G4 |
|
Evd limit value2 |
Value of dynamic deformation modulus ≤ 60 MN·m-2 |
45 |
40.64 |
3.38 |
122 |
Evd ≤ 60 |
|
|
Value of dynamic deformation modulus > 60 MN·m-2 |
200 |
85.09 |
2.46 |
261 |
Evd > 60 |
|
|
Value of dynamic deformation modulus ≤ 65 MN·m-2 |
60 |
46.30 |
3.16 |
139 |
Evd ≤ 65 |
|
|
Value of dynamic deformation modulus > 65 MN·m-2 |
185 |
86.86 |
2.45 |
267 |
Evd > 65 |
|
|
Value of dynamic deformation modulus ≤ 70 MN·m-2 |
82 |
52.04 |
3.00 |
155 |
Evd ≤ 70 |
|
|
Value of dynamic deformation modulus > 70 MN·m-2 |
163 |
89.45 |
2.44 |
276 |
Evd > 70 |
|
|
Value of dynamic deformation modulus ≤ 75 MN·m-2 |
120 |
58.82 |
2.84 |
175 |
Evd ≤ 75 |
|
|
Value of dynamic deformation modulus > 75 MN·m-2 |
125 |
94.60 |
2.43 |
293 |
Evd > 75 |
1 – type of road subgrade (CBR – California bearing ratio) G1: CBR ≥ 10%, G2: 5% ≤ CBR < 10%, G3: ≤ 3% CBR < 5%, G4: 2% ≤ CBR < 3% (classification according to Katalog… 2014)
2 – the upper limits of the tested compartments were set at the maximum value considered authoritative by the equipment manufacturer, i.e. 70 MN·m-2 (Zorn 2014), plus two smaller and one larger value at intervals of 5 MN·m–2
3. Results
There are statistically significant, moderate or strong correlations (r > 0.40, Table 3) between Evd and E2 values in the vast majority of the analysed variants of the data sets. In the set of all collected results of the bearing capacity tests (A), Evd and E2 correlate strongly with each other (r > 0.70, Table 3, Fig. 2A), while showing poor model fit (R2 < 0.60) and a significant value of the standard error of the estimate (Se > 80). The strongest correlations were found in the data set characterising the bearing capacity of pavements on the weakest road subgrades (G3/G4: r = 0.87, R2 = 0.75, Se = 41) and in the data set bounded from above by the value Evd = 65.00 MN·m-2 (r = 0.84, R2 = 0.70, Se = 31, Table 3, Fig. 2B). The assumed value of 65.00 MN·m-2 is slightly below the upper limit of the range of results (70 MN·m-2) considered crucial by the instrument manufacturer for measurements with a 10 kg drop weight (Zorn 2014). On the other hand, the weakest relationship between Evd and E2 was recorded for the dataset describing the bearing capacity of pavements made of optimal natural soil mixtures (Mopt) and pavements on G2 subgrade.
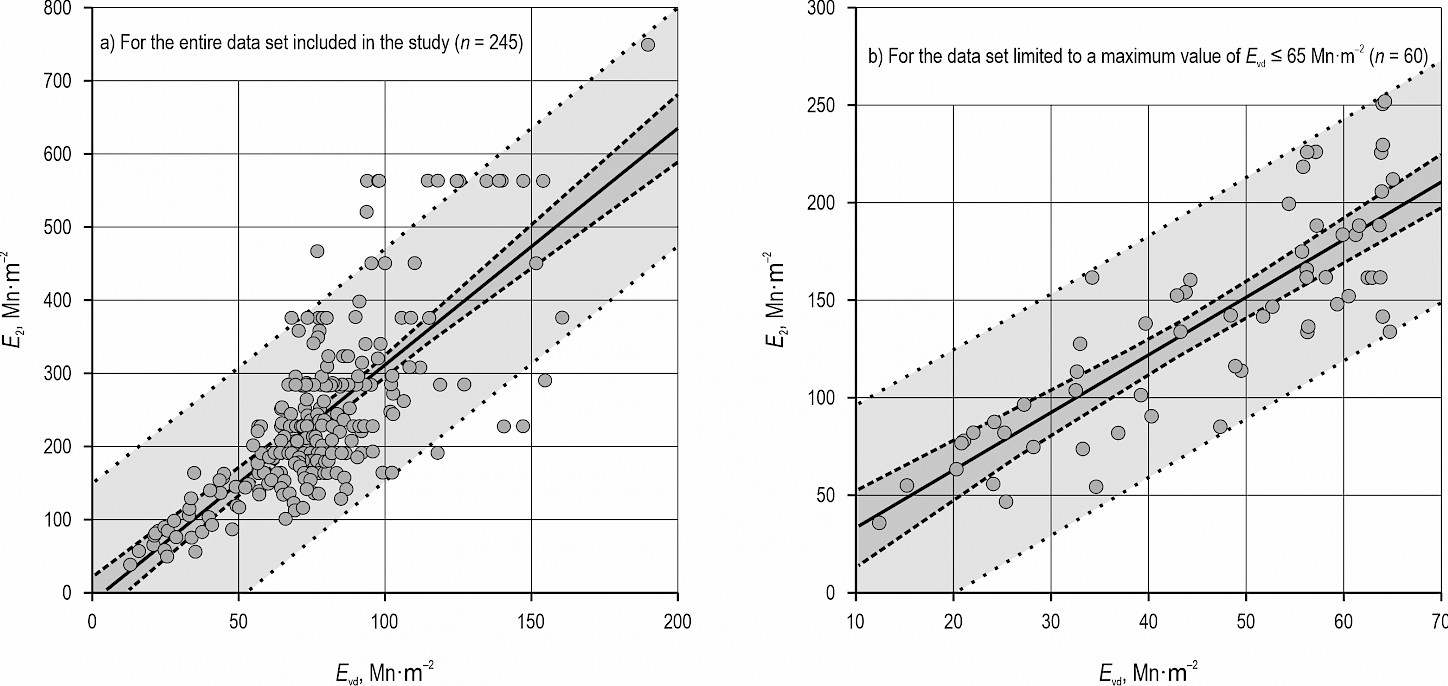
Fig. 2 Linear regression for values of dynamic deformation modulus Evd (LFWD, Zorn, type ZFG 3000 GPS, 300 mm diameter loading plate, 10 kg drop weight load) and secondary deformation modulus E2 (PLT, 300 mm diameter loading plate).
The use of a regression model other than the linear regression model does not always increase the correlation r and the goodness of fit R2. The best effect of using a more complicated regression model is expected in the case of optimal natural soil mixtures (Mopt), native (GN) and gravel or sand-gravel mix (Mix) pavements.
A comparison of the E2 values obtained during the test (yi) with the predicted values (i) using the best-fit model is shown in Fig. 3. The relative error RE of the prediction according to the linear regression model described by the eq. E2 = 1.34 + 2.97Evd, determined by eq. (4), is ±20% (Fig. 3).
 (4)
(4)
The tests of the linear multivariate regression models did not have the expected effect of increasing the degree of fit of the model to the data collected (Table 4). The addition of a second explanatory variable (s/v) increased the complexity of the regression relationship but did not increase the value of r or R2, which sometimes had a negative effect on the value of the standard error. The quality of the prediction obviously increased when analysing the data set for pavements on G2 road subgrade, aggregated pavements in a typical macadam structure (McA) and pavements with a layer stabilised by hydraulic binder (Stab). The use of a model other than the linear multiple regression model has a stronger effect on increasing the correlation and the degree of model fit than the simple regression models (Table 3).
Table 3 Dependencies of dynamic deformation modulus Evd (LFWD, Zorn, type ZFG 3000 GPS, 300 mm diameter loading plate, 10 kg drop weight load) on secondary deformation modulus E2, tested with static load plate – simple regression (E2 = f(Evd))
|
Data group* |
Form of linear function |
Linear model parameters |
Best-fit model parameters |
||||
|
|
|
r |
R2 |
Se |
r |
R2 |
Se |
|
A |
E2=-13.55+3.24∙Evd |
0.73 |
0.54 |
80.37 |
0.73 |
0.54 |
80.62 |
|
GN |
E2=16.09+2.53∙Evd |
0.71 |
0.51 |
22.69 |
0.86 |
0.74 |
18.42 |
|
Mix |
E2=92.70+1.12∙Evd |
0.61 |
0.37 |
14.92 |
0.71 |
0.51 |
14.90 |
|
Mopt |
E2=189.60+1.36∙Evd |
0.22 |
0.05 |
51.83 |
0.46 |
0.22 |
52.02 |
|
McA |
E2=51.05-2.22∙Evd |
0.37 |
0.14 |
51.79 |
0.37 |
0.14 |
51.79 |
|
CS |
E2=18.80+2.30∙Evd |
0.73 |
0.53 |
35.74 |
0.76 |
0.57 |
34.88 |
|
Stab |
E2=3.14+3.35∙Evd |
0.64 |
0.41 |
112.53 |
0.65 |
0.42 |
113.08 |
|
Rec |
E2=14.14+2.81∙Evd |
0.68 |
0.46 |
122.68 |
0.75 |
0.56 |
114.72 |
|
GeoN |
E2=-2.95+3.19∙Evd |
0.71 |
0.51 |
89.14 |
0.71 |
0.51 |
89.39 |
|
GeoY |
E2=27.39+2.34∙Evd |
0.59 |
0.35 |
47.12 |
0.65 |
0.43 |
44.94 |
|
G1 |
E2=-8.11+3.19∙Evd |
0.69 |
0.48 |
89.36 |
0.69 |
0.48 |
89.53 |
|
G2 |
E2=117.97+1.13∙Evd |
0.23 |
0.05 |
46.61 |
0.23 |
0.05 |
46.55 |
|
G3/G4 |
E2=-28.73+3.44∙Evd |
0.87 |
0.75 |
40.80 |
0.90 |
0.82 |
35.62 |
|
Evd ≤ 60 |
E2=1.87+2.95∙Evd |
0.83 |
0.69 |
28.31 |
0.84 |
0.70 |
28.29 |
|
Evd > 60 |
E2=-24.17+3.35∙Evd |
0.63 |
0.40 |
87.97 |
0.64 |
0.41 |
88.08 |
|
Evd ≤ 65 |
E2=1.34+2.97∙Evd |
0.84 |
0.70 |
30.52 |
0.84 |
0.71 |
30.63 |
|
Evd > 65 |
E2=-24.51+3.35∙Evd |
0.62 |
0.38 |
90.92 |
0.62 |
0.39 |
90.96 |
|
Evd ≤ 70 |
E2=1.49+2.96∙Evd |
0.76 |
0.57 |
42.22 |
0.76 |
0.58 |
42.55 |
|
Evd > 70 |
E2=-23.37+3.34∙Evd |
0.61 |
0.37 |
94.06 |
0.61 |
0.38 |
94.03 |
|
Evd ≤ 75 |
E2=0.78+2.98∙Evd |
0.72 |
0.52 |
48.08 |
0.72 |
0.52 |
48.08 |
|
Evd > 75 |
E2=-21.31+3.33∙Evd |
0.58 |
0.34 |
102.57 |
0.59 |
0.35 |
102.39 |
|
Description: * – abbreviations are explained in Table 2, r – Pearson's linear correlation coefficient (statistically significant values at p = 0.05 are in bold) R2 – coefficient of determination, Se – standard error |
|||||||
Table 4 Dependencies of dynamic deformation modulus Evd and ratio s/v (LFWD, Zorn, type ZFG 3000 GPS, 300 mm diameter loading plate, 10 kg drop weight load) on secondary deformation modulus E2, tested with static load plate – complex regression (E2 = f(Evd, s/v))
|
Data group* |
Form of linear function |
Linear model parameters |
Best-fit model parameters |
||||
|
|
|
r |
R2 |
Se |
r |
R2 |
Se |
|
A |
E2=42.46+3.05∙Evd-15.88∙s/v |
0.73 |
0.54 |
80.27 |
0.75 |
0.57 |
78.99 |
|
GN |
E2=40.67+2.25∙Evd-4.50∙s/v |
0.72 |
0.51 |
23.86 |
0.94 |
0.88 |
24.98 |
|
Mix |
E2=134.47+0.88∙Evd-9.99∙s/v |
0.61 |
0.38 |
15.74 |
0.88 |
0.77 |
27.00 |
|
Mopt |
E2=-195.72+1.57∙Evd+143.31∙s/v |
0.26 |
0.07 |
53.78 |
0.88 |
0.77 |
49.01 |
|
McA |
E2=310.48+1.70∙Evd-87.25∙s/v |
0.47 |
0.22 |
49.67 |
0.58 |
0.34 |
47.86 |
|
CS |
E2=76.43+1.98∙Evd-13.09∙s/v |
0.73 |
0.54 |
35.88 |
0.77 |
0.59 |
37.19 |
|
Stab |
E2=832.54+3.05∙Evd-348.54∙s/v |
0.71 |
0.51 |
103.63 |
0.73 |
0.53 |
108.18 |
|
Rec |
E2=31.78+2.75∙Evd-4.07∙s/v |
0.68 |
0.46 |
125.19 |
0.77 |
0.59 |
129.43 |
|
GeoN |
E2=52.24+3.01∙Evd-15.92∙s/v |
0.72 |
0.51 |
89.12 |
0.74 |
0.54 |
86.44 |
|
GeoY |
E2=248.25+1.18∙Evd-53.19∙s/v |
0.64 |
0.41 |
45.17 |
0.70 |
0.49 |
44.40 |
|
G1 |
E2=68.29+2.99∙Evd-23.43∙s/v |
0.70 |
0.49 |
89.24 |
0.72 |
0.52 |
88.26 |
|
G2 |
E2=429.49-0.15∙Evd-87.25∙s/v |
0.38 |
0.14 |
45.59 |
0.64 |
0.41 |
48.39 |
|
G3/G4 |
E2=-16.90+3.36∙Evd-2.43∙s/v |
0.87 |
0.75 |
41.33 |
0.91 |
0.82 |
38.42 |
|
Evd ≤ 60 |
E2=25.55+2.76∙Evd-4.62∙s/v |
0.83 |
0.69 |
28.57 |
0.85 |
0.72 |
29.62 |
|
Evd > 60 |
E2=264.85+3.18∙Evd-111.52∙s/v |
0.66 |
0.44 |
85.41 |
0.68 |
0.46 |
84.95 |
|
Evd ≤ 65 |
E2=24.48+2.78∙Evd-4.57∙s/v |
0.84 |
0.70 |
30.73 |
0.84 |
0.71 |
31.08 |
|
Evd > 65 |
E2=269.84+3.19∙Evd-114.04∙s/v |
0.65 |
0.42 |
88.22 |
0.67 |
0.45 |
87.68 |
|
Evd ≤ 70 |
E2=92.35+2.28∙Evd-18.47∙s/v |
0.76 |
0.59 |
41.93 |
0.79 |
0.63 |
41.71 |
|
Evd > 70 |
E2=260.59+3.23∙Evd-111.97∙s/v |
0.63 |
0.40 |
91.80 |
0.66 |
0.44 |
91.07 |
|
Evd ≤ 75 |
E2=117.32+2.18∙Evd-24.52∙s/v |
0.73 |
0.53 |
47.55 |
0.76 |
0.58 |
45.16 |
|
Evd > 75 |
E2=280.04+3.27∙Evd-121.91∙s/v |
0.61 |
0.37 |
100.34 |
0.65 |
0.42 |
98.96 |
|
Description: * – abbreviations are explained in Table 2, r – Pearson's linear correlation coefficient (statistically significant values at p = 0.05 are in bold) R2 – coefficient of determination, Se – standard error |
|||||||
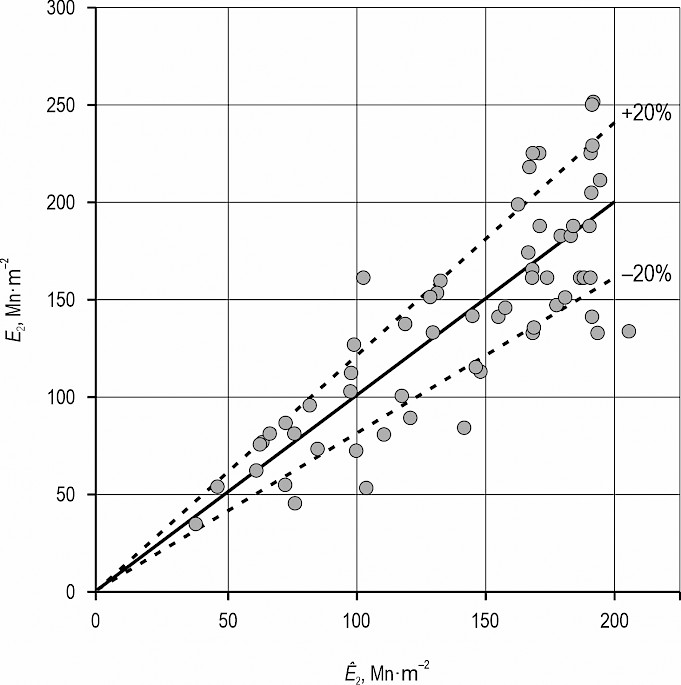
Fig. 3 Comparison of values of deformation modulus after the second loading cycle from tests (E2) with predicted values (Ê2) of the best linear regression model (Ê2 = 1.34 + 2.97Evd) together with cones of relative error (RE)
4. Discussion
The results of this study show that there are some relationships between the values of the dynamic deformation modulus (LFWD) and the values of the secondary deformation modulus (PLT). However, in most cases these appear to be too weak to be used in practise without the risk of significant error. Therefore, previous research results in this field, some of which were very promising, have not been confirmed (Nazzal et al. 2004, 2007, Sulewska 2004, Alshibli et al. 2005, Sulewska and Bartnik 2017, Wyroślak 2017, Table 1).
The potential difficulties of using a light falling weight deflectometer for compliance purposes have been pointed out much earlier, e.g. by Shahid et al. (1997) or Kumor et al. (2013). Hildebrand (2003) in turn even suggested that LFWD should not be used on granular base courses. Later analyses of theoretical mathematical models and experiences of other researchers have even questioned the sense of looking for close relationships between the two testing methods, pointing out that the differences between them are too great (Adam et al. 2009, Krawczyk and Mackiewicz 2016, Węgliński 2018). Among other things, the static test differs from the dynamic test in terms of the maximum extent of the loading effect. It is estimated that the range of the static test is almost 37% greater than that of the dynamic test when testing unimproved (native) road subgrade (measurements in the range 0.00-0.25 MN·m-2), when testing improved road subgrade (measurements in the range of 0.00-0.35 MN·m-2) the reported difference is more than 53%, while when testing road base course (measurements in the range of 0.00-0.45 MN·m-2) the differences can reach 67% (Węgliński 2018). This means that the PLT range cannot be answered simply and unambiguously, as it depends on the type and nature of the soil as well as the amount of applied load. At the same time, the above facts indicate that the depth of the PLT effect in load tests on forest roads can extend far below the structural layers of the pavement (down to the road subgrade), which is much less likely when LFWD is used.
The strong correlations between LFWD and PLT measurements shown by some researchers may be due to the relatively thick and homogeneous layers of road embankments used in the tests (Wyroślak 2017), or to solid structural layers of highways or public road pavements (Nazzal et al. 2004, Almássy and Subert 2006, Kim et al. 2007, Gorączko et al. 2014). Strictly controlled laboratory conditions can also play an important role (Sulewska 2004, Alshibli et al. 2005, Szpikowski et al. 2005, Sulewska and Bartnik 2017). Forest roads are often built as thin-layered structures on variable road substrates with sometimes unobserved compaction standards and under different moisture conditions in vertical and horizontal directions (Trzciński 2011, Grajewski 2016, 2019).
The introduction of an additional explanatory variable (s/v ratio) in the regression analysis did not significantly increase the quality of the prediction of values of the secondary deformation modulus (Table 3 vs. Table 4). This did not confirm the earlier observations of Sulewska (2012) and Sulewska and Bartnik (2017), who considered the s/v ratio to be a very important parameter in assessing compaction and bearing capacity quality. It is also noted that the linear regression models tested have a slightly lower predictive quality than the parameters of more complex models (logarithmic, polynomial, exponential, power). It seems that the increase in model complexity is disproportionate to the benefits derived from its use.
The above results thus justify the discrepancies in the values of the moduli determined by both methods and the difficulties in unambiguously assessing the bearing capacity of the embedded layers. The analysed data, coming from 46 road sections, although grouped among themselves, differ so much in terms of type and physical condition of soils/road surface aggregate and road subgrade, thickness of construction layers, presence or absence of reinforcement with different types of geosynthetics, that it was not possible to determine a universal LFWD-PLT relationship of satisfactory quality for them.
In other cases, LFWD tests can be used both as part of stage checks (acceptance of overbuilt and decayed structures) and as a final control for a quick diagnosis of geotechnical parameters (correctness of subgrade preparation, construction of embankments or pavement construction) that do not form the basis for technical acceptance. Pending the development of national standards for the application of LFWD and the interpretation of measurement results, they should serve to highlight the weakest points where, in case of doubt, other harmless tests can be carried out, e.g. with a PLT.
In an ad hoc assessment of the quality of road works, it can be assumed that less than 9% of the obtained results of bearing capacity tests on forest roads are smaller than the value of E2 calculated by doubling the value of Evd (Fig. 4).
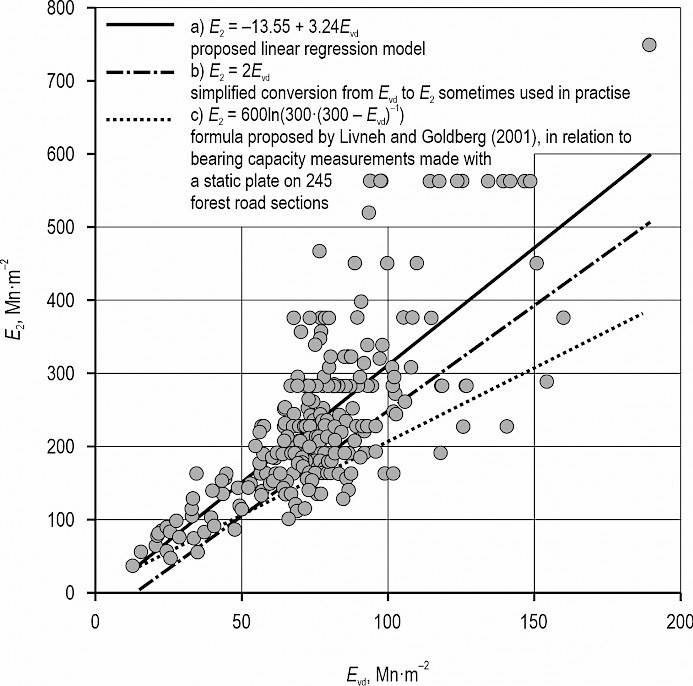
Fig. 4 Estimation of static deformation modulus during secondary compression (E2) based on values of dynamic deformation modulus (Evd)
5. Conclusions
Based on the analysis of the results of 245 bearing capacity measurements on 46 forest road sections with various pavements, carried out with a Zorn light falling weight deflectometer (LFWD), type ZFG 3000 GPS, with a drop weight of 10 kg and static load plates (PLT), the following conclusions can be formulated:
prediction of secondary deformation modulus values obtained from PLT measurements is possible based on LFWD tests. However, it should be noted that, although a good correlation between the dynamic deformation modulus Evd and the secondary deformation modulus E2 has been demonstrated (r = 0.73), the fit of the proposed linear model is unfortunately unsatisfactorily poor (R2 = 0.54) with a correspondingly high value of standard error (Se = 80 MN·m-2)
the estimation results were not significantly improved by using more complex nonlinear regression models or multiple regression by introducing an additional estimator in the form of the s/v ratio
the quality of the prediction of the E2 value is not constant and changes depending on the type of forest road, the application of geosynthetic pavement reinforcement and the type of road subgrade. A worse fit of the regression models was obtained for roads with pavements made of optimal natural soil mixtures (Mopt) and in macadam technique (McA). A similar effect is caused by the reinforcement of the pavement with geosynthetics and subgrade of group G2 (G2)
the quality of the prediction of E2 can be increased by limiting the range of the compared Evd values even below the threshold value given by the manufacturer of the device as the upper limit for the reliability of the measurements of the tested LFWD device
despite the unsatisfactory results of the current study, it is recommended to continue the investigation as the obtained results could be a basis for the development of much needed national standards for the application of the light falling weight deflectometer to control the bearing capacity and compaction of forest road surfaces.
Acknowledgments
The publication was financed within the framework of a subsidy for science granted by the Minister of Science and Higher Education.
6. References
Adam, C., Adam, D., Kopf, F., Paulmichl, I., 2009: Computational validation of static and dynamic plate load testing. Acta Geotechnica 4: 35–55. https://doi.org/10.1007/s11440-008-0081-0
Almássy, K., Subert, I., 2006: Dynamic compaction and load bearing capacity measurements on Highway Project M7. Mélyépítés, May, 10–13 p.
Alshibli, K.A., Abu-Farsakh, M., Seyman, E., 2005: Laboratory evaluation of the geogauge and light falling weight deflectometer as construction control tools. Journal of Materials in Civil Engineering 17(5): 560–569. https://doi.org/10.1061/(ASCE)0899-1561(2005)17:5(560)
Ashmawy, A.K., Bourdeau, P.L., 1996: Response of a woven and a nonwoven geotextile to monotonic and cyclic simple tension. Geosynthetics International 3(4): 493–515. https://doi.org/10.1680/gein.3.0072
Bitir, I., Derczeni, R., Lunguleasa, A., Spirchez, C., Ciobanu, V., 2022: Research on tracking the behavior of the Ciobanus Forest Road over a season time through specific tests and analysis. Applied Sciences 12(1): 459. https://doi.org/10.3390/app12010459
Bitir, I., Musat, E.C., Lunguleasa, A., Ciobanu, V.D., 2021: Monitoring the transport on the Ciobănuș forest road within the Bacău Forestry Department. Recent Journal 1(63): 10–16. https://doi.org/10.31926/RECENT.2021.63.010
BN-8931-02:1964: Roads for cars. Determination of deformation modulus of susceptible pavements and subgrade by static plate loading. Polish standard. PKNMiJ, Warsaw, Poland: 1–4.
Coghlan, G.T., 2000: Opportunities for low-volume roads. Transportation in the Millennium: state of art and future directions. Transportation Research Board, National Research Council, TR News 205: 1–7.
Decký, M., Drusa, M., Papán, D., Šrámek, J., 2022: The relationship between dynamic and static deformation modulus of unbound pavement materials used for their quality control methodology. Materials 15(8): 2922. https://doi.org/10.3390/ma15082922
DIN 18134:2012-04 Soil: Testing procedures and testing equipment. Plate load test. Beuth Verlag. Germany: 1–25. https://doi.org/10.31030/1869979
Ézsiás, L., 2005: Application of the B&C light falling weight deflectometer for evaluation of earthworks. Final Project. University of Szécheny István, Győr, Hungary.
Fleming, P.R., 2000: Small-scale dynamic devices for the measurement of elastic stiffness modulus on pavement foundations. In: Nondestructive testing of pavements and backcalculation of moduli; Tayabji, S.D., Lukanen, E.O., Eds.; STP 1375, ASTM International, West Conshohocken, PA, USA, 3; 41–58.
Fleming, P.R., Frost, M.W., Lambert, J.P., 2007: Review of the lightweight deflectometer for routine in situ assessment of pavement material stiffness. Transportation Research Record, Soil Mechanics 2004(1): 80–87. https://doi.org/10.3141/2004-09
Gorączko, A., Śmigiel, P., Topoliński, S., 2014: Correlations for compaction parameters of road embankment. Logistyka 6: 4025–4030.
Grajewski, S.M., 2016: Influence of pavement moisture content on the load-bearing capacity of forest road. Infrastructure and Ecology of Rural Areas 4(2): 1451–1462. http://dx.medra.org/10.14597/infraeco.2016.4.2.107
Grajewski, S.M., 2019: Functionality of forest fire roads in view of requirements of modern fire engines and pumper trucks and currently used forest firefighting tactics and technologies. Poznań University of Life Sciences Publishing House, Poznań, Poland: 1–226.
Grajewski, S.M., 2022: Forest road engineering in Poland: current status and development perspectives. Sylwan 166(2): 123–140. https://doi.org/10.26202/sylwan.2022006
Gumus, S., Acar, H.H., Toksoy, D., 2008: Functional forest road network planning by consideration of environmental impact assessment for wood harvesting. Environmental Monitoring and Assessment 142: 109–116. https://doi.org/10.1007/s10661-007-9912-y
Guzzarlapudi, S.D., Adigopula, V.K., Kumar, R., 2016: Comparative studies of lightweight deflectometer and Benkelman beam deflectometer in low volume roads. Journal of Traffic and Transportation Engineering 3(5): 438–447. https://doi.org/10.1016/j.jtte.2016.09.005
Hegde, A., 2017: Geocell reinforced foundation beds-past findings, present trends and future prospects: A state-of-the-art review. Construction and Building Materials 154: 658–674. https://doi.org/10.1016/j.conbuildmat.2017.07.230
Hildebrand, G., 2003: Comparison of various types of bearing capacity equipment. Nordic Road and Transportation Research 15(3): 12–14.
Horak, E., Maina, J., Guiamba, D., Hartman, A., 2008: Correlation study with the light weight deflectometer in South Africa. In: Proceedings of the 27th Annual Southern African Transport Conference (SATC) Partnership for research and progress in Transportation. Pretoria, South Africa, July 7-11, 304–312 p.
Kaakkurivaara, T., Vuorimies, N., Kolisoja, P., Uusitalo, J., 2015: Applicability of portable tools in assessing the bearing capacity of forest roads. Silva Fennica 49(2): article id 1239. https://doi.org/10.14214/sf.1239
Kamal, M., Arshid, M., Sha, M., Khan, E., 2018: Relationship between dynamic deformation modulus (Evd) and CBR for common and granular materials. Technical Journal 23(1): 9–14. https://tj.uettaxila.edu.pk/index.php/technical-journal/article/view/532
Katalog typowych konstrukcji nawierzchni podatnych i półsztywnych. Załącznik do zarządzenia nr 31 Generalnego Dyrektora Dróg Krajowych i Autostrad z dnia 16.06.2014 r. Generalna Dyrekcja Dróg Krajowych i Autostrad, Warsaw, Poland: 1-112. Available online: https://www.gov.pl/attachment/d7ded9b0-1b73-4c62-b3c5-9eecf20daeef (accessed 27.07.2022).
Kavussi, A., Rafiei, K., Yasrobi, S., 2010: Evaluation of PFWD as potential quality control tool of pavement layers. Journal of Civil Engineering and Management 16(1): 123–129. https://doi.org/10.3846/jcem.2010.11
Keramati, A., Lu, P., Sobhani, A., Esmaeili, S.A.H., 2020: Impact of forest road maintenance policies on log transportation cost, routing, and carbon-emission trade-offs: Oregon case study. Journal of Transportation Engineering, Part A: Systems 146(5): 04020028. https://doi.org/10.1061/JTEPBS.0000335
Kestler, M., Berg, R., Steinert, B., Hanek, G., Truebe, M., Humprey, D., 2007: Determining when to place and remove spring load restrictions on low-cost roads. Transportation Research Record: Journal of the Transportation Research Board 1989(1): 219–229. http://dx.doi.org/10.3141/1989-67
Kim, J.R., Kang, H.B., Kim, D., Park, D.S., Kim, W.J., 2007: Evaluation of in situ modulus of compacted subgrades using portable falling weight deflectometer and plate-bearing load test. Journal of Materials in Civil Engineering 19(6): 492–499. https://doi.org/10.1061/(ASCE)0899-1561(2007)19:6(492)
Kongkitkul, W., Saisawang, T., Thitithavoranan, P., Kaewluan, P., Posribink, T., 2014: Correlations between the surface stiffness evaluated by light-weight deflectometer and degree of compaction. Tunneling and Underground Construction 242: 65–75. https://doi.org/10.1061/9780784413449.007
Krawczyk, B., Mackiewicz, P., 2016: Impact of reinforcement layer material and thickness on deflections measured in the static and dynamic plate load tests. Roads and Bridges 15(2): 87–102. http://dx.doi.org/10.7409/rabdim.016.006
Krawczyk, B., Mackiewicz, P., Szydło, A., 2015: Influence analysis of counterweight type used in static plate test on identified parameters of pavement courses and subgrade. Roads and Bridges 14(2): 143–157. https://doi.org/10.7409/rabdim.015.010
Kumor, M.K., Farmas, J., Kumor, Ł.A., 2013: The selected correlations of compaction parameters determined by VSS and LWD methods. Budownictwo i Inżynieria Środowiska 4: 271–279.
Latha, G., Nair, A., Hemalatha, M., 2010: Performance of geosynthetics in unpaved roads. International Journal of Geotechnical Engineering 4(3): 337–349. https://doi.org/10.3328/IJGE.2010.04.03.337-349
Lehmann, S., Leppla, S., Norkus, A., 2020: Experimental study of the modulus of deformation determined by static and dynamic plate load tests. The Baltic Journal of Road and Bridge Engineering 15(4): 109–124. https://doi.org/10.7250/bjrbe.2020-15.497
Livneh, M., Goldberg, Y., 2001: Quality assessment during road formation and foundation construction: use of falling-weight deflectometer and light drop weight. Journal of Transportation Research Board 1755(1): 69–77. https://doi.org/10.3141/1755-08
Mackiewicz, P., Krawczyk, B., 2015: Influence of loading time on subgrade parameters derived from VSS static plate test. Roads and Bridges 14(1): 19–29. https://doi.org/10.7409/rabdim.015.002
Mooney, M.A., Miller, P.K., 2009: Analysis of lightweight deflectometer test based on in situ stress and strain response. Journal of Geotechnical and Geoenvironmental Engineering 135(2): 199–208. https://doi.org/10.1061/(ASCE)1090-0241(2009)135:2(199)
Nazzal, M.D., Abu-Farsakh, M.Y., Alshibli, K., Mohammad, L., 2004: Evaluating the potential use of a portable LFWD for characterizing pavement layers and subgrades. In: Proceedings of the conference »Geotechnical engineering for transportation projects«, Geo-Trans 2004. July 27–31, Los Angeles, CA, USA. ASCE Geotechnical Special Publication 1(126): 915–924. https://doi.org/10.1061/40744(154)79
Nazzal, M.D., Abu-Farsakh, M.Y., Alshibli, K., Mohammad, L., 2007: Evaluating the light falling weight deflectometer device for in situ measurement of elastic modulus of pavement layers. Transportation Research Record: Journal of the Transportation Research Board 2016(1): 13–22. https://doi.org/10.3141/2016-02
PN-S-02205:1998: Roads for cars. Earthworks. Requirements and tests. Polish standard. PKN, Warsaw, Poland: 1–30.
Queen, L.P., Vlaming, J.C., Arthaud, G.J., Lime, D.W., 1997: Modeling impacts of forest roads on recreation opportunities. Northern Journal of Applied Forestry 14(4): 194–201. https://doi.org/10.1093/njaf/14.4.194
Rafalski, L., 1985: Metoda badania zagęszczenia podtorza za pomocą płyty obciążanej dynamicznie. Prace IBDiM w Warszawie 3: 5–29.
Sabouri, M., Khabiri, S., Asgharzadeh, S.M. Abdollahi S.F., 2022: Investigating the performance of geogrid reinforced unbound layer using light weight deflectometer (LWD). International Journal of Pavement Research and Technology 15(1): 173–183. https://doi.org/10.1007/s42947-021-00015-3
Santiago, L.E., Loomis, J., 2009: Recreation benefits of natural area characteristics at the El Yunque National Forest. Journal of Environmental Planning and Management 52(4): 535–547. https://doi.org/10.1080/09640560902868439
Shahid, M.A., Thom, N.H., Fleming, P.R., 1997: In-situ assessment of road foundations. Highways and Transportation 44(11): 15–17.
Stamp, D.H., Mooney, M.A., 2013: Influence of lightweight deflectometer characteristics on deflection measurement. Geotechnical Testing Journal 36(2): 216–226. https://doi.org/10.1520/GTJ20120034
Steinert, B.C., Humphrey, D.N., Kestler, M.A., 2005: Portable falling weight deflectometer study. Report No. NETCR52. Department of Civil and Environmental Engineering, University of Maine, Maine, USA; 1–277.
Sudarsono, I., Aisyah, L., Prakoso, R.N.P., 2020: Correlation of modulus elasticity between light weight deflectometer (LWD) and dynamic cone penetrometer (DCP) for subgrade of pavement. Journal of Physics: Conference Series 1517(1): 012030. https://doi.org/10.1088/1742-6596/1517/1/012030
Sulewska, M.J., 2004: The application of the modern method of embankment compaction control. Journal of Civil Engineering and Management 10 (Suppl 1): 45–50.
Sulewska, M.J., 2012: The control of soil compaction degree by means of LFWD. The Baltic Journal of Road and Bridge Engineering 7(1): 36–41. https://doi.org/10.3846/bjrbe.2012.05
Sulewska, M.J., Bartnik, G., 2017: Application of the light falling weight deflectometer (LFWD) to test aggregate layers on geosynthetic base. Procedia Engineering 189: 221–226. http://dx.doi.org/10.1016/j.proeng.2017.05.035
Suzuki, H., Ichihara, K., Noda, I., 1998: Road planning in forest for recreation. Journal of The Japan Forest Engineering Society 13(3): 151–160. https://doi.org/10.18945/jjfes.KJ00007484621
Szpikowski, M., Dreger, M., Przygoda, M., Dróżdż, R., Dąbrowski, M., Tokarczyk, T., Har, M., Mitrut, M., Żuławnik, P., 2005: Badanie i ustalenie zależności korelacyjnych dla oceny stanu zagęszczenia i nośności gruntów niespoistych płytą dynamiczną. IBDiM, Laboratorium Geotechniki, Warszawa, Poland; 1-104 p.
Termansen, M., McClean, C.J., Jensen, F.S., 2013: Modelling and mapping spatial heterogeneity in forest recreation services. Ecological Economics 92: 48–57. https://doi.org/10.1016/j.ecolecon.2013.05.001
Termansen, M., Zandersen, M., McClean, C.J., 2008: Spatial substitution patterns in forest recreation. Regional Science and Urban Economics 38(1): 81–97. https://doi.org/10.1016/j.regsciurbeco.2008.01.006
Tompai, Z., 2008: Conversion between static and dynamic load bearing capacity moduli and introduction of dynamic target values. Periodica Polytechnica Civil Engineering 52(2): 97–102. https://doi.org/10.3311/pp.ci.2008-2.06
Trzciński, G., 2011: Analysis of technical parameters of forest roads in terms on timber haulage by high-tonnage vehicles. Warsaw University of Life Sciences Publishing House, Warsaw, Poland, 1–128 p.
Uusitalo, J., 2010: Introduction to forest operations and technology. JVP Forest Systems Oy, Finland: 1–287 p.
Węgliński, S., 2018: Determination of load action ranges in static and dynamic tests of subgrades by applying rigid plates. Roads and Bridges 17(1): 73–88. https://doi.org/10.7409/rabdim.018.005
Wyroślak, M., 2017: Relationship between subgrade parameters obtained from field test of controlled compaction soil. Inżynieria Morska i Geotechnika 1: 21–26.
Wyroślak, M., Ossowski, R., 2016: Evaluation of deformation moduli in controlled soil embankment based on VSS plate and LFWD plate. Acta Scientarum Polonorum Architectura 15(3): 111–118.
Zednik, P., Matula, R., Pospisil, K., 2015: Parameters for evaluating bearing capacity of subgrade and base forest road layers. Polish Journal of Environmental Studies 24(2): 809–815.
Zorn, 2014: User manual for the light weight deflectometer ZFG 3000 GPS in accordance with the German technical test requirements for soil and rocks in road construction TP BF – StB Part B 8.3. Merazet, Poznań, Poland, 1–21 p.
© 2023 by the authors. Submitted for possible open access publication under the
terms and conditions of the Creative Commons Attribution (CC BY) license (http://creativecommons.org/licenses/by/4.0/).
Author’s address:
Sylwester M. Grajewski, PhD *
e-mail: sylwester.grajewski@up.poznan.pl
Poznań University of Life Sciences
Faculty of Forestry and Wood Technology
Department of Forest Engineering
Wojska Polskiego 71C
60-625 Poznań
POLAND
Received: June 8, 2022
Accepted: August 11, 2022
Original scientific paper