
Forecasting Future Procurement Potential of Swedish Forest Biomass Using Forest Inventory Data
doi: 10.5552/crojfe.2023.2011
volume: 44, issue:
pp: 10
- Author(s):
-
- Kons Kalvis
- Athanassiadis Dimitris
- Agar David A.
- Article category:
- Original scientific paper
- Keywords:
- GIS, assortment, bioenergy, pulpwood, sawlogs, bark, estimates
Abstract
HTML
In the last 20 years the use of forest biomass for energy production and sawlog and pulpwood production has increased by 68%, 11% and 31% in Sweden. As Sweden is trying to achieve net zero greenhouse gas emissions by 2045, the high demand for biomass can also be expected in future. Therefore, a method to project the amount of spatially available biomass assortments for industries was developed. Available amounts of different forest assortments were estimated and visualised in a web-based tool using forest inventory data and nationwide projection analyses of available biomass for 2035–2039. In this interval, the greatest amount of available biomass and roundwood will be in Northern Sweden. Results also indicate that already existing harvesting intensity is very high compared to the available biomass in the future. The industry can expect noticeably more available biomass in the coming 100 year period. With increased competition between large pulp mills and biorefineries, the supply areas can exceed 200 km to satisfy raw material demand. The long distance and high volume supply chain requirements will demand further improvement in transportation solution nationally and cross-border in the Baltic Sea Region.
Forecasting Future Procurement Potential of Swedish Forest Biomass Using Forest Inventory Data
Kalvis Kons, Dimitris Athanassiadis, David A. Agar
Abstract
In the last 20 years the use of forest biomass for energy production and sawlog and pulpwood production has increased by 68%, 11% and 31% in Sweden. As Sweden is trying to achieve net zero greenhouse gas emissions by 2045, the high demand for biomass can also be expected in future. Therefore, a method to project the amount of spatially available biomass assortments for industries was developed. Available amounts of different forest assortments were estimated and visualised in a web-based tool using forest inventory data and nationwide projection analyses of available biomass for 2035–2039. In this interval, the greatest amount of available biomass and roundwood will be in Northern Sweden. Results also indicate that already existing harvesting intensity is very high compared to the available biomass in the future. The industry can expect noticeably more available biomass in the coming 100 year period. With increased competition between large pulp mills and biorefineries, the supply areas can exceed 200 km to satisfy raw material demand. The long distance and high volume supply chain requirements will demand further improvement in transportation solution nationally and cross-border in the Baltic Sea Region.
Keywords: GIS, assortment, bioenergy, pulpwood, sawlogs, bark, estimates
1. Introduction
Sweden has a good starting position to meet the aims of the Paris Agreement. The share of renewable energy in gross final consumption surpassed the 2020 goal of 50% already in 2012 (Forsum et al. 2018). The share of supplied energy from biomass alone, which consists mainly of forest biomass, was 26% or 141 TWh in 2018 (Swedish Energy Agency 2019). Sweden’s 2016 Energy Agreement goals are to achieve 100% renewable energy by 2040 and zero net greenhouse gas emissions by 2045 (IRENA 2020, Ministry of Enviroment 2016).
In 2018, electricity was the most used energy carrier in final energy use in industrial and residential sectors. The final renewable energy use from biomass in these sectors was 39% and41 % (Swedish Energy Agency 2019). The main end users of forest biomass in Sweden are:
- sawmills (roundwood)
- pulp mills (pulpwood)
- combined heat and power (CHP) plants that fuel district heating and electricity production (logging residues, stump wood and/or other by-products).
Increased use of primary forest biomass for heating can substantially reduce the electricity consumption in the residential sector allowing redirecting electricity use in transportation sector and other nonsubstitutional applications. In addition, other industrial players, besides the pulp and paper sector, will seek renewable energy sources to reduce their carbon emission in order to achieve the goals of the 2016 Energy Agreement (Ministry of Enviroment 2016). Since 2000, biomass use for energy production has increased on average by 3% annually, reaching a 68% increase in total (Swedish Energy Agency 2019). Today most by-product streams of residual biomass (e.g. bark and sawdust) from the forest industry are fully utilised, leaving any further increase of biomass use for energy production on primary forest resources, such as logging residues, stumps and bark. Simultaneously with the increase of biomass use for energy purposes, harvested volumes of sawlogs and pulpwood have also increased annually, reaching an overall increment of 11% and 31%, respectively compared to 2000 (Skogsstyrelsen 2019).
With continuing demand growth for biomass and roundwood, it becomes more important to have a good understanding of future biomass and roundwood availability. Geographical information systems (GIS), national forest inventory data and growth models are widely used to estimate available biomass potentials across the globe at a regional, national and local scale (Noon and Daly 1996, Nord-Larsen and Talbot 2004, Castellano et al. 2009, Rørstad et al. 2010, Yoshioka et al. 2011, Bouchard et al. 2013, Muinonen et al. 2013, Lundmark et al. 2015, Fernandez-Lacruz et al. 2015).
However, while the annual demand of biomass and roundwood has increased, the main focus in the aforementioned studies has been particularly on biomass potentials. Beside estimating the potential harvesting quantities of different biomass assortments, Lundmark et al. (2015) have also estimated the harvesting costs of roundwood assortments, such as sawlogs and pulpwood. Growing demand, overlapping procurement areas and increased transportation distances are the main reasons for increased procurement costs (Viana et al. 2010). There have been several methods applied to address overlapping demand regions for biomass, like allocating harvesting potential by minimising transportation costs (Nord-Larsen and Talbot 2004, Ranta 2005) or by estimating regional balances of supply and demand or by totalling overlapping regions (Goerndt et al. 2013, Sánchez-García et al. 2015, Nivala et al. 2016, Ranta et al. 2012, Emer et al. 2011, Masera et al. 2006). For cost-effective industrial facilities that process forest biomass, it is necessary to have access to regional estimates of raw material supply potentials in order to identify hot spots in their supply areas (Masera et al. 2006).
Nivala et al. (2016) and Anttila et al. (2018) have done detailed regional balance studies of supply and demand of forest chips. And even though there are many other studies estimating future biomass potentials and procurement costs using GIS tools and different growth models, there is a knowledge gap on how to interactively visualise this information and allow different stakeholders to do their own biomass estimations in the regions of interest.
The aim of the present study was to develop a method for illustrating, spatially explicitly, annual projected forest biomass potentials of branches, stumps, bark, pulpwood and sawlogs in Sweden for 2035–2039 and apply the method on estimating potentials in different geographic areas within Sweden.
2. Materials and Methods
The annual projected forest biomass potentials from final fellings and thinnings of five assortments (branches, stumps, bark, pulpwood and sawlogs) were estimated in Sweden for 2035–2039 and represented in a raster map. Potential projections for branches, pulpwood and bark include aggregated values of Scots pine (Pinus sylvestris L.), Norway spruce (Picea abies (L.) H. Karst.)), Silver birch (Betula pendula) and Downy birch (Betula pubescens). Potential projections for stumps and sawlog biomass included only Scots pine and Norway spruce due to environmental restrictions concerning extractions of birch stumps and the low availability of birch sawlogs.
Two readily available datasets were used for creating the raster map:
A forest map that shows the total forest biomass in the Swedish productive forests in 2015 (https://www.skogsstyrelsen.se/sjalvservice/karttjanster/skogsdataportalen/). This map has been developed through the processing of data from the national laser scanning that is performed annually in Sweden and plot data from test-sites from the Swedish forest inventory. The forest biomass volume (m3/ha above-ground biomass) is reported at a pixel level of 12.5x12.5 metres and is a measure indicating the volume content of stemwood plus logging residues. Therefore, stumps have not been included in our analyses but have been estimated from the available data. Trees that are under 3 m in height, as well as birch forest in mountainous regions, have not been included in the estimation. The development of the forestry map is described by Nilsson et al. (2017)
The annual county-level projected forest biomass potentials are from the Swedish Nationwide Forestry Scenario Analysis 2015 (NFSA15) (Claesson et al. 2015, Eriksson et al. 2015). The potential projections were made for all National Forestry Inventory (NFI) plots and initialised from the state of the plots observed in 2008–2012, located across Sweden and representing 22.4 million ha of productive forest land. NFSAs are regularly performed in Sweden, covering all productive forest land (managed as well as protected forests). The NFSA15 simulates, among others, a common business scenario (BAU) projecting forest development and harvest level, given that today’s management practices will also be applied in the future. The BAU scenario assumes that Swedish silvicultural practices will not change and annual fellings will stay at a level that is regarded as sustainable (harvesting less than annual increment), that environmental legislation will not change, and that climate change will be light. Other scenarios, e.g. alternative forest management practices, are typically also included in NFSAs (Claesson et al. 2015, Eriksson et al. 2015). For the NFSA15 projections of annual maximum sustainable removal countywide (procurement volume) from final fellings and thinnings in Sweden of five forest biomass assortments (branches, stumps, bark, pulpwood and sawlogs) were available for each of a total of 29,892 NFI plots (located across Sweden) for a five-year period from 2010 to 2110.
For the creation of the raster maps, the (BAU) scenario projections for 2035–2039 were used. In each county, each of the 12.5x12.5 m grid cells of the forestry map was assigned forest projection data of countywide projected potentials (Pi2035-2039)) according to the amount of forest biomass (Bai2015; m3 above-ground biomass) it currently contained related to the current total amount of biomass in the county (∑i=1nBai2015). The NFSA15 annual countywide projected procurement volumes were expressed as solid cubic metres (m3) under bark (sub) for sawlogs and pulpwood, and oven dry tonnes (odt) for bark, branches and stumps.
 (1)
(1)
Where:
Pai biomass potential in grid cell a in county i
n amount of grid cells in county i
For the final estimations, the 12.5x12.5 m grid cells were aggregated into 1x1 km grid cells and nature protection areas were removed (Fig. 1).
The raster maps were then uploaded into the Forest Energy Atlas web application (https://forest-energy-atlas.luke.fi/).
Three case studies of potential projections for different assortments and geographic areas were performed in order to exemplify the use of the raster maps. The case study areas were selected:
from the list of predefined regions (municipality, county, province or state) already existing in the Forest Energy Atlas web application; projected forest biomass of each assortment per ha of productive forestland was estimated for each county
by drawing a circle with user-defined radius; circle-based procurement areas with 50 km, 100 km and 200 km radius were drawn to estimate projected pulpwood potential in m3 (sub) around four major pulp mills (Metsä Board Husum, SCA Östrand, Södra Cell Mönsterås, Södra Cell Värö) with a minimum annual pulp production capacity of 700 ktonnes (Fig. 2). For conversion of pulp production capacity in tonnes to the pulpwood demand in cubic metres, a conversion factor of 4.76 m3 (sub) per tonne pulp was used (Briggs 1994). The total pulp production capacity of the four selected pulp mills was 3080 ktonnes of pulp.
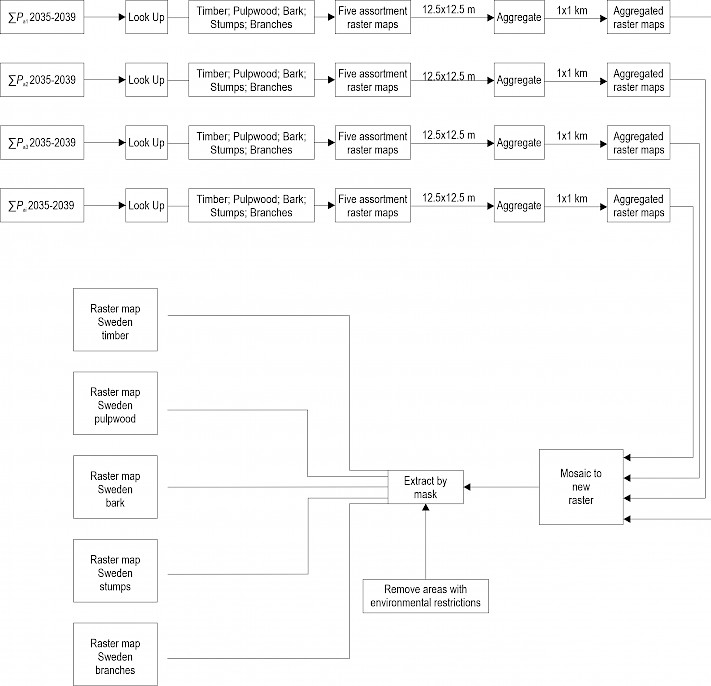
Fig. 1 Model workflow for producing raster maps illustrating how annual countywide projected procurement volumes for five forest biomass assortments (branches, stumps, bark, pulpwood and sawlogs) are obtained in Sweden for 2035–2039. Look up, Aggregate, Mosaic to New raster and Extract by mask denote tools in the ArcGIS software
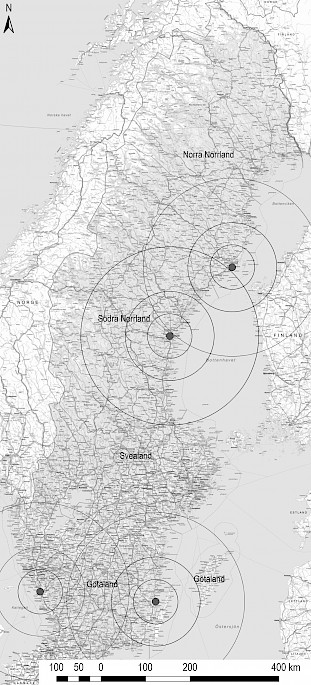
Fig. 2 Location of four major pulp mills (1. Metsä Board Husum, 2. SCA Östrand, 3. Södra Cell Mönsterås, 4. Södra Cell Väröand) and their assumed pulpwood sourcing areas in Sweden
Additionally, a projection of available biomass of logging residues (branches and tops) was calculated for three potential lignin oil-producing biorefineries integrated into existing pulp/paper mills in Sweden. The branches raster (Raster Map Sweden Branches in Fig. 1) was used for the calculations. The original raster with a pixel size of 1x1 km was aggregated to a raster with a pixel size of 10x10 km. The original raster contained the branches without including any ecological restrictions or tree tops (upper stem part below 6 cm in diameter) in the estimates. To correct that and provide an available amount of logging residues that is closer to reality, the treetops were added to the branch biomass. It was assumed that approximately 8% of the logging residues are composed of tops (Petersson 1999). This quantity was then added to the quantity of the biomass of branches. Further, it was assumed that only 75% of the logging residue biomass (branches and tops) is harvested while the rest remains in the forest and decomposes. This is a more conservative assumption than used in the current Swedish Forestry Act, which recommends a minimum of 20% of the logging residues to be left in the forest. All pixels that had a logging residue density of less than 100 odt per 100 km2 were excluded from the data set to simplify the analysis. Three locations for the pulp/paper mills producing lignin oil from logging residues originating from harvesting operations of pulpwood and sawlogs were selected; one in the north close to the City of Umeå (SWEREF 763017, 7074957), one in the middle close to the City of Gävle (SWEREF 624067, 6729681) and one at the south part of Sweden close to the City of Göteborg (SWEREF 329530, 6346115). The assumption is that the production of the lignin oil would be integrated into the pulp mills located close to the shore of Baltic Sea or Kattegat Strait (North Sea) to make transportation of products possible by sea transport.
Available logging residues were calculated within a buffer zone of 75 km around the facilities and all logging residues in the buffer were transported directly to the facilities by trucks. The central point of each 10x10 km pixel was assumed to be the collection point of the logging residues that were produced within each pixel.
3. Results
The projected annual forest biomass (branches, stumps and bark) and roundwood potential in Sweden for 2035–2039 (Table 1) is 17,256,752 odt and 67,523,420 m3 (sub), respectively, of which 30,669,863 m3 (sub) is pulpwood and 36,853,557 m3 (sub) is sawlogs.
Counties in Southern Sweden (Götaland) have the lowest amount of productive forest land (4,810,000 ha), but have the second-highest projected annual biomass and roundwood potential in 2035–2039 (5,061,875 odt and 21,834,868 m3 (sub), respectively) due to higher growth rate (m3/ha a) than the rest of the counties. Counties in Northern Sweden (Norrland) have the highest amount of productive forestland (13,470,000 ha) and also the highest projected annual biomass and roundwood potential (7,632,987 odt and 26,752,819 m3 (sub), respectively) despite the lowest levels of growing stock. Counties in Central Sweden (Svealand) have the least projected annual amount of biomass and roundwood potential amounting to 4,561,890 odt for biomass and 18,935,733 m3 (sub) for roundwood. Jämtland in North Sweden is the county with the highest projected annual biomass potential equalling 1,796,232 odt. The highest projected annual potential of pulpwood at 3,014,604 m3 (sub) is in another county in the north, Västerbotten. However, the highest projected annual sawlog potential of 3,414,700 m3 (sub) is to be found in the southern county of Västra Götaland.
The four mills together consume 48% of the potential nationwide pulpwood availability for the period 2035–2039 (Table 2). According to our calculations based on the projected annual projected pulpwood potentials, in 2035–2039 only 11–16 % of needed pulpwood demand can be procured within a 50 km radius from these pulp mills (Table 2). SCA Östrand pulp mill can procure the most pulpwood (16% of its demand) among all four pulp mills that were included in this analysis; however, on average pulp mills can procure 13% of their pulpwood demand within a 50 km radius. Within a procurement distance of 100 km radius, the pulp mills in the South of Sweden can procure 51% of their annual pulpwood demand while pulp mills in the North can procure 49%. The difference of available pulpwood volume becomes even wider between South and North with procurement areas of 200 km radius. Within 200 km procurement area, all pulp mills can cover their pulpwood demand by 157–178 %. However, at such a long transport distance the procurement areas between all four pulp mills overlap making them partially compete for the same resource (Fig. 1). And also, due to the competition from other smaller market players within the procurement area, technically available volumes will be even lower, especially with increasing transport distances.
Table 1 Available biomass from five forest assortments in 21 counties of Sweden for 2035–2039
|
Administrative borders |
Productive forest land ha |
Branches |
Stumps |
Bark |
Pulpwood |
Sawlogs |
Total mass of branches, stumps and bark, odt/a |
Total volume of pulpwood and sawlogs, m3 (sub)/a |
|||||
|
|
|
odt/a |
odt/ha a |
odt/a |
odt/ha a |
odt/a |
odt/ha a |
m3 (sub)/a |
m3 (sub)/ha a |
m3 (sub)/a |
m3 (sub)/ha a |
|
|
|
Southern Sweden (Götaland) |
|||||||||||||
|
Östergötlands |
626,000 |
184,066 |
0.29 |
321,340 |
0.51 |
130,933 |
0.21 |
1,082,131 |
1.73 |
1,835,026 |
2.93 |
636,339 |
2,917,157 |
|
Jönköpings |
703,000 |
222,062 |
0.32 |
377,545 |
0.54 |
151,960 |
0.22 |
1,379,479 |
1.96 |
2,011,841 |
2.86 |
751,567 |
3,391,320 |
|
Kronobergs |
607,000 |
194,243 |
0.32 |
327,673 |
0.54 |
131,037 |
0.22 |
1,172,935 |
1.93 |
1,657,599 |
2.73 |
652,953 |
2,830,534 |
|
Kalmar |
733,000 |
212,131 |
0.29 |
374,012 |
0.51 |
151,156 |
0.21 |
1,275,425 |
1.74 |
2,114,721 |
2.89 |
737,299 |
3,390,146 |
|
Gotlands |
126,000 |
21,536 |
0.17 |
41,563 |
0.33 |
14,792 |
0.12 |
108,805 |
0.86 |
126,484 |
1.00 |
77,891 |
235,289 |
|
Blekinge |
185,000 |
55,828 |
0.30 |
92,754 |
0.50 |
3609 |
0.02 |
363,135 |
1.96 |
41,184 |
0.22 |
152,191 |
404,319 |
|
Skåne |
357,000 |
106,330 |
0.30 |
175,221 |
0.49 |
114,924 |
0.32 |
717,375 |
2.01 |
885,187 |
2.48 |
396,475 |
1,602,562 |
|
Hallands |
275,000 |
79,674 |
0.29 |
142,216 |
0.52 |
77,255 |
0.28 |
539,848 |
1.96 |
760,701 |
2.77 |
299,145 |
1,300,549 |
|
Västra Götalands |
1,198,000 |
397,067 |
0.33 |
689,145 |
0.58 |
271,803 |
0.23 |
2,348,292 |
1.96 |
3,414,700 |
2.85 |
1,358,015 |
5,762,992 |
|
Subtotal |
4,810,000 |
1,472,937 |
0.31 |
2,541,469 |
0.53 |
1,047,469 |
0.22 |
8,987,425 |
1.87 |
12,847,443 |
2.67 |
5,061,875 |
21,834,868 |
|
Central Sweden (Svealand) |
|||||||||||||
|
Stockholms |
288,000 |
69,299 |
0.24 |
118,072 |
0.41 |
47,630 |
0.17 |
382,840 |
1.33 |
507,557 |
1.76 |
235,001 |
890,397 |
|
Uppsala |
489,000 |
130,752 |
0.27 |
221,837 |
0.45 |
81,403 |
0.17 |
736,530 |
1.51 |
1,101,247 |
2.25 |
433,992 |
1,837,777 |
|
Södermanlands |
339,000 |
98,044 |
0.29 |
172,206 |
0.51 |
69,113 |
0.20 |
545,865 |
1.61 |
875,987 |
2.58 |
339,363 |
1,421,852 |
|
Västmanlands |
304,000 |
81,178 |
0.27 |
144,997 |
0.48 |
58,110 |
0.19 |
574,376 |
1.89 |
681,572 |
2.24 |
284,285 |
1,255,948 |
|
Örebro |
573,000 |
191,761 |
0.33 |
281,887 |
0.49 |
114,689 |
0.20 |
1,020,134 |
1.78 |
1,274,031 |
2.22 |
588,337 |
2,294,165 |
|
Värmlands |
1,334,000 |
381,560 |
0.29 |
677,557 |
0.51 |
226,492 |
0.17 |
2,377,909 |
1.78 |
2,807,645 |
2.10 |
1,285,609 |
5,185,554 |
|
Dalarnas |
2,061,000 |
394,611 |
0.19 |
754,451 |
0.37 |
246,241 |
0.12 |
2,728,018 |
1.32 |
3,322,022 |
1.61 |
1,395,303 |
6,050,040 |
|
Subtotal |
5,388,000 |
1,347,205 |
0.25 |
2,371,007 |
0.44 |
843,678 |
0.16 |
8,365,672 |
1.55 |
10,570,061 |
1.96 |
4,561,890 |
18,935,733 |
|
Northern Sweden (Norrland) |
|||||||||||||
|
Gävleborgs |
1,451,000 |
345,500 |
0.24 |
656,523 |
0.45 |
224,028 |
0.15 |
2,390,380 |
1.65 |
2,958,839 |
2.04 |
1,226,051 |
5,349,219 |
|
Västernorrlands |
1,731,000 |
413,311 |
0.24 |
788,155 |
0.46 |
237,554 |
0.16 |
2,341,997 |
1.35 |
2,373,245 |
1.37 |
1,439,020 |
4,715,242 |
|
Jämtlands |
2,823,000 |
497,444 |
0.18 |
1,007,486 |
0.36 |
291,302 |
0.20 |
2,745,955 |
0.97 |
2,925,859 |
1.04 |
1,796,232 |
5,671,814 |
|
Västerbottens |
3,269,000 |
478,109 |
0.15 |
984,533 |
0.30 |
280,978 |
0.19 |
3,014,604 |
0.92 |
3,017,347 |
0.92 |
1,743,620 |
6,031,951 |
|
Norrbottens |
4,196,000 |
392,292 |
0.09 |
805,947 |
0.19 |
229,825 |
0.16 |
2,823,830 |
0.67 |
2,160,763 |
0.51 |
1,428,064 |
4,984,593 |
|
Subtotal |
13,470,000 |
2,126,656 |
0.16 |
4,242,644 |
0.31 |
1,263,687 |
0.09 |
13,316,766 |
0.99 |
13,436,053 |
1.00 |
7,632,987 |
26,752,819 |
|
Total |
23,668,000 |
4,946,798 |
0.21 |
9,155,120 |
0.39 |
3,154,834 |
0.13 |
30,669,863 |
1.30 |
36,853,557 |
1.56 |
17,256,752 |
67,523,420 |
|
Symbols refer to: sub – solid under bark, odt – oven dry tonn |
|||||||||||||
Pulpwood demand can only be satisfied by 16–36% compared to the potential pulpwood availability within county borders where pulp mills are located. Södra Cell Värö has the least available pulpwood of 539,848 m3/a in Halland county where it is located (Table 1). Interestingly Västernorrland county holds 30% of pulpwood demand from the two pulp mills in northern Sweden. According to Table 2, a pulpwood potential from the county of Halland and two surrounding counties of Skåne and Västra Götaland have to be harvested to cover 100% pulpwood demand from Södra Cell Värö. To satisfy pulpwood demand from Södra Cell Mönsterås, an additional pulpwood resource would be needed from counties of Östergötaland and Jönköping. In the North, to guarantee uninterrupted pulpwood supply to the two pulp mills in Västernorrland, an additional pulpwood volume should be taken from nearby counties of Jämtland and Västerbotten (Table 1)
Table 2 Present production capacity and pulpwood demand for pulp mills with an annual pulp production of over 700,000 t and estimated pulpwood harvesting potential for 2035–2039
|
Pulp mill |
Production t |
Pulpwood demand m3 sub |
Max available pulpwood potential within 50 km m3 sub |
Available pulpwood vs demand % |
Max available pulpwood potential within 100 km m3 sub |
Available pulpwood vs demand % |
Max available pulpwood potential within 200 km m3 sub |
Available pulpwood vs demand % |
|
Metsä Board Husum |
730,000 |
3,474,800 |
377,245 |
11 |
1,502,650 |
43 |
5,454,987 |
157 |
|
SCA Östrand |
900,000 |
4,284,000 |
681,434 |
16 |
2,322,452 |
54 |
7,113,623 |
166 |
|
Södra Cell Mönsterås |
750,000 |
3,570,000 |
479,610 |
13 |
1,865,661 |
52 |
5,991,901 |
168 |
|
Södra Cell Värö |
700,000 |
3,332,000 |
412,447 |
12 |
1,652,416 |
50 |
5,935,783 |
178 |
|
Total |
3,080,000 |
14,660,800 |
1,950,736 |
13 |
7,343,179 |
50 |
24,496,294 |
167 |
|
Symbols refer to: sub – solid under bark |
||||||||
The total amount of logging residue biomass available within 75 km from the three lignin oil refineries is slightly over 300 ktonne odt (Table 3). The most logging residue biomass is available for the biorefinery in the central part of Sweden (176,769 ktonne odt) and the least amount is available in the northern part of Umeå (98,020 ktonne odt). The three biorefineries can source from 14 to 28% (14%, 28% and 19%) of logging residue biomass compared to total available biomass only from branches and bark in corresponding counties (Table 1), where all three facilities are located.
Table 3 Estimated amount of available biomass of logging residues for lignin oil production within 75 km from the facility, 2035–2039
|
Location |
Available biomass of logging residues (branches and tops), odt |
|
Umeå (North Sweden) |
98,020 |
|
Gävle (Central Sweden) |
176,769 |
|
Göteborg (Southern Sweden) |
124,069 |
|
Total |
300,838 |
4. Discussion
Lundmark et al. (2015) presented the projected availability of roundwood, harvesting residues and stumps in raster maps in Sweden for the period 2010–2069 based on the NFSA08 projections. In that paper, the projected volumes in each county were aggregated to 27.75x27.75 km grid cells. The method gave a reasonable accuracy of estimated biomass within county borders but no consideration was taken on the current biomass load in each grid cell. That method is improved in this paper by assigning forest projection data to each grid cell according to the amount of forest biomass each grid cell contains related to the current total amount of biomass in the county.
Issues with distribution of biomass estimates were noticed in Anttila et al. (2018) and Nivala et al. (2016). In these works, removing NFI plots with environmental restrictions possibly led to uneven distribution of available biomass. In the present paper, only the theoretical maximum potential of the studied assortments is presented. The user of the raster maps is warned that it is not possible to procure the total of the theoretical potential of branches and stumps and that 40% of the projected potential should be left in the forest (Athanassiadis and Nordfjell 2017).
Anttila et al. (2018) have used similar approach to this study to distributing inventory data over a larger grid area. However, there are differences between Anttila et al. (2018) and the present study on how nature protected areas were removed. While the method used in this paper removes the areas with nature protected areas at the end of data processing using ArcGIS, Anttila et al. (2018) used a series of calculations and assumptions before projecting data on the raster grid.
Spatial analysis is scale-dependant and PC computing speed is dependent on the amount of data it has to process. While we have not experienced computing speed problems when working with vector files, high resolution raster files (12.5x12.5 m) take substantially longer to compute compared with 1x1 km raster grid. Similarly to Anttila et al. (2018), who increased their raster grid resolution to 1x1 km from the 1 ha resolution in Nivala et al. (2016) study, our study also found that 1x1 km resolutions were a good compromise between good regional results on biomass estimates and computing speed.
The fact that there is such a small discrepancy between projected potentials and current harvesting levels can be mainly explained by the very high present harvesting intensity and a short period of time between the present and the projection time. According to the NFSA15 (Claesson et al. 2015) in the BAU scenario, the projected harvested potentials increase from 90.8 to 119.6 m3 at the end of the 100-year period. Growth increases due to genetically improved planting stock, which will happen with every future rotation cycle of forest stands.
Currently, one of the most expanding areas in the Swedish forest industry is investments in pulp mills and potential biorefinery integration in their surroundings. When comparing the maximum annual available pulpwood volumes (30.7 Mm3 sub) for the period 2035–2039 and the harvested volumes of pulpwood for 2013–2017 (29.5–30.6 Mm3) (Skogsstyrelsen 2019), it can be seen that Swedish forest owners are already harvesting volumes close to those expected in the future estimates. Just four big pulp mills in Sweden are already procuring ca. 49% of the available projected pulpwood potential for the period 2035–2039 and 80% of this potential lies within 200 km radius from the pulp mills. As for pulpwood, a similar trend is observed for sawlogs, where harvested volumes for the period 2013–2017 were 31.7–36.6 Mm3 and our estimate for 2035–2039 is 36.9 Mm3.
The potential for lignin oil-producing biorefineries to source logging residues within 75 km distance is quite limited (14–28 %). The pulp mills and biorefineries also need a lot of energy in the form of steam and heat, which they produce themselves by burning bark and other biomass residues and by-products of pulping. This means that biorefineries will directly compete with heat and power plants heating the nearby cities or with the heat and power plants within their own facilities, therefore even further reducing the practically available amount of logging residues for lignin oil production.
Wetterlund et al. (2013) have summarised 14 studies where primary forest harvesting residue potential has been estimated for 2020 in Sweden. The results vary in the wide range from 16 to 81 TWh/a. While this paper includes only branches in the primary harvesting residues, our estimate for the period 2035–2039 is on the lower side at 28 TWh. There have been four studies estimating stump potential in 2010 with the highest estimate being 58 TWh/a and lowest 10 TWh/a. Our estimate for stumps in 2035–2039 is somewhat on the higher end at 42 TWh/a. The results obtained in this study are consistent with results found in the study by Lundmark et al. (2015), whose estimates were also on the lower end for harvesting residues and in mid-range for the stumps.
An important part of the development of the raster maps was to make them available to the stakeholders, i.e. forest owners, forest owners associations, forest companies, authorities, researchers, and the general public. At the homepage of the Natural Resource Institute Finland (LUKE) (https://forest-energy-atlas.luke.fi/) the Forest Energy Atlas tool has been developed that allows one to look at and work with, free of charge, raster maps developed in Sweden, Finland, Latvia, Estonia and Lithuania. The tool gives the possibility to the user to easily access and estimate the available amount of timber or biomass in the region of interest by using three iregional selection tools.
5. Conclusions
In this study a method to project available biomass and roundwood potentials in the future were developed. The method used high quality forest inventory data and countrywide future biomass projection analyses in combination with GIS analysis. The method was applied for the period of 2035–2039; however it can applied to any time period up to 100 years in the future. The obtained results are integrated in the interactive web-based maps for use of different stakeholder groups to support policy making and investment decisions.
Results for the studied time period show that more biomass and roundwood will be available for procurement in Northern and Southern Sweden. However, this could bring imbalance in supply and demand, especially for energy assortments, as traditionally biomass for energy demand is higher in the Central and Southern Sweden. Also, with continuing investments in bio-refineries, pulp mills and sawmills, as well as the forest and energy industry should not expect significant increases in available biomass raw materials in the next 20 years. Therefore any further procurement volumes have to come from efficiency improvements within existing supply chains.
It is concluded that future development of the online tool needs to account for industrial demand on the country and cross-border regional level for supply and demand estimates in the Baltic Sea region because biomass and timber supply chains are highly interconnected in this region. Indicative results show that further development will be needed in long distance and high volume supply chains and terminal, as well as log-yard designs and management, to tackle 200 km and longer transportation distances.
Nomenclature
a unit of time for a year
BAU business as usual
CHP combined heat and power
GIS geographical information systems
LUKE natural Resource Institute Finland
NFI national forestry inventory
NFSA nationwide forestry scenario analysis
odt oven dry tonne
Pai biomass potential in grid cell »a« in county »i«
sub solid under bark
7. References
Anttila, P., Nivala, V., Salminen, O., Hurskainen, M., Kärki, J., Lindroos, T.J., Asikainen, A., 2018: Regional Balance of Forest Chip Supply and Demand in Finland in 2030. Silva Fennica 52(2): article id 9902. https://doi.org/10.14214/sf.9902
Athanassiadis, D., Nordfjell, T., 2017: Regional GIS-Based Evaluation of the Potential and Supply Costs of Forest Biomass in Sweden. Front Agr Sci Eng 4 (4): 493–501. https://doi.org/10.15302/J-FASE-2017179
Bouchard, S., Landry, M., Gagnon, Y., 2013: Methodology for the Large Scale Assessment of the Technical Power Potential of Forest Biomass: Application to the Province of New Brunswick, Canada. Biomass and Bioenergy 54: 1–17. https://doi.org/10.1016/j.biombioe.2013.03.014
Briggs, D.G., 1994: Forest Products Measurements and Conversion Factors: With Special Emphasis on the US Pacific Northwest. Edited by Leila Charbonneau. Seattle: College of Forest Resources, University of Washington.
Castellano, P.J., Volk, T.A., Herrington., L.P., 2009: Estimates of Technically Available Woody Biomass Feedstock from Natural Forests and Willow Biomass Crops for Two Locations in New York State. Biomass and Bioenergy 33(3): 393–406. https://doi.org/10.1016/j.biombioe.2008.08.001
Claesson, S., Lundström, A., Wikberg, P., 2015: Skogliga Konsekvensanalyser 2015-SKA 15, Skogsstyrelsen.
Emer, B., Grigolato, S., Lubello, D., Cavalli., R., 2011: Comparison of Biomass Feedstock Supply and Demand in Northeast Italy. Biomass and Bioenergy 35(8): 3309–3317. https://doi.org/10.1016/j.biombioe.2010.09.005
Eriksson, H., Fahlvik, N., Freeman, M., Fries, C., Jönsson, A.M., Lundström, A., Nilsson, U., Wikberg, P., 2015: Effekter Av Ett Förändrat Klimat – SKA 15. Rapport 12. Skogsstyrelsen, Jönköping.
Fernandez-Lacruz, R., Di Fulvio, F., Athanassiadis, D., Bergström, D., Nordfjell, T., 2015: Distribution, Characteristics and Potential of Biomass-Dense Thinning Forests in Sweden. Silva Fennica 49(5): 1377. https://doi.org/10.14214/sf.1377
Forsum, A., Sahlin, M., Olsson, O., 2018: Sweden – 2018 Update Bioenergy Policies and Status of Implementation. https://www.ieabioenergy.com/wp-content/uploads/2018/11/CountryReport2018_Sweden_final2.pdf
Goerndt, M., Aguilar, F., Skog, K., 2013: Resource Potential for Renewable Energy Generation from Co-Firing of Woody Biomass with Coal in the Northern U.S. Biomass and Bioenergy 59: 348–61. https://doi.org/10.1016/j.biombioe.2013.08.032
IRENA., 2020: INNOVATIVE SOLUTIONS FOR 100% RENEWABLE POWER IN SWEDEN. Abu Dhabi. https://www.irena.org/-/media/Files/IRENA/Agency/Publication/2020/Jan/IRENA_Innovative_power_Sweden_2020_summary.pdf?la=en&hash=9FC47DCAD97F5001B07663FD7D246872DBC0F868
Lundmark, R., Athanassiadis, D., Wetterlund, E., 2015: Supply Assessment of Forest Biomass-a Bottom-up Approach for Sweden. Biomass and Bioenergy 75: 213–26. https://doi.org/10.1016/j.biombioe.2015.02.022
Masera, O., Ghilardi, A., Drigo, R., Trossero, M., 2006: WISDOM: A GIS-Based Supply Demand Mapping Tool for Woodfuel Management. Biomass and Bioenergy 30(7): 618–37. https://doi.org/10.1016/j.biombioe.2006.01.006
Ministry of Enviroment. 2016: Framework Agreement Energy Policy 2016, Stockholm.
Muinonen, E., Anttila, P., Heinonen, J., Mustonen, J., 2013: Estimating the Bioenergy Potential of Forest Chips from Final Fellings in Central Finland Based on Biomass Maps and Spatially Explicit Constraints. Silva Fennica 47(4): 1022. https://doi.org/10.14214/sf.1022
Nilsson, M., Nordkvist, K., Jonzén, J., Lindgren, N., Axensten, P., Wallerman, J., Egberth, M., Larsson, S., Nilsson L., Eriksson, J., Olsson, H., 2017: A Nationwide Forest Attribute Map of Sweden Predicted Using Airborne Laser Scanning Data and Field Data from the National Forest Inventory. Remote Sensing of Environment 194: 447–54. https://doi.org/10.1016/j.rse.2016.10.022
Nivala, M., Anttila, P., Laitila, J., Salminen, O., Flyktman, M., 2016: A GIS-Based Methodology to Estimate the Regional Balance of Potential and Demand of Forest Chips. Journal of Geographic Information System 8(5): 633–662. https://doi.org/10.4236/jgis.2016.85052
Noon, C.E., Daly, M.J., 1996: GIS-Based Biomass Resource Assessment with BRAVO. Biomass and Bioenergy 10(2): 101–9. https://doi.org/10.1016/0961-9534(95)00065-8
Nord-Larsen, T., Talbot, B., 2004: Assessment of Forest-Fuel Resources in Denmark: Technical and Economic Availability. Biomass and Bioenergy 27(2): 97–109. https://doi.org/10.1016/j.biombioe.2004.01.007
Petersson, H., 1999: Biomassafunktioner för trädfaktorer av tall, gran och björk i Sverige, Report 59. Swedish University of Agricultural Sciences, Umeå.
Ranta, T., 2005: Logging Residues from Regeneration Fellings for Biofuel Production a GIS Based Availability Analysis in Finland. Biomass and Bioenergy 28(2): 171–182. https://doi.org/10.1016/j.biombioe.2004.08.010
Ranta, T., Korpinen, O.J., Karttunen, K., 2012: Forest Biomass Availability Analysis and Large-Scale Supply Options. Open Journal of Forestry 2(1): 33–40. https://doi.org/10.4236/ojf.2012.21005
Rørstad, P., Trømborg, E., Bergseng, E., Solberg, B., 2010: Combining GIS and Forest Modelling in Estimating Regional Supply of Harvest Residues in Norway. Silva Fennica 44(3): 435–451. https://doi.org/10.14214/sf.141
Sánchez-García, S., Canga, E., Tolosana, E., Majada J., 2015: A Spatial Analysis of Woodfuel Based on WISDOM GIS Methodology: Multiscale Approach in Northern Spain. Applied Energy 144: 193–203. https://doi.org/10.1016/j.apenergy.2015.01.099
Skogsstyrelsen., 2019: Bruttoavverkning Och Nettoavverkning per Sortiment. http://pxweb.skogsstyrelsen.se/pxweb/sv/Skogsstyrelsens statistikdatabas/Skogsstyrelsens statistikdatabas__Bruttoavverkning/JO0312_01.px/table/tableViewLayout1/?rxid=c7fc5aec-2fc9-4ec4-a51e-09120d2dc3bb
Swedish Energy Agency, 2019: Energy in Sweden Facts and Figures 2019. Eskilstuna. http://www.energimyndigheten.se/globalassets/statistik/energilaget/energilaget-i-siffror-2020.xlsx
Viana, H., Cohen, W.B., Lopes, D., Aranha, J., 2010: Assessment of Forest Biomass for Use as Energy. GIS-Based Analysis of Geographical Availability and Locations of Wood-Fired Power Plants in Portugal. Applied Energy 87(8): 2551–2560. https://doi.org/10.1016/j.apenergy.2010.02.007
Wetterlund, E., Pettersson, K., Mossberg, J., Thorén, J., Hoffstedt, C., von Schenck, A., Berglin, N., Lundmark, R., Lundgren, J., Leduc, S., Kindermann, G., 2013: Optimal Localisation of next Generation Biofuel Production in Sweden. The Swedish Knowledge Centre for Renewable Transportation Fuels (f3).
Yoshioka, T., Sakurai, R., Aruga, K., Sakai, H., Kobayashi, H., Inoue, K., 2011: A GIS-Based Analysis on the Relationship between the Annual Available Amount and the Procurement Cost of Forest Biomass in a Mountainous Region in Japan. Biomass and Bioenergy 35(11): 4530–4537. https://doi.org/10.1016/j.biombioe.2011.03.029
© 2023 by the authors. Submitted for possible open access publication under the
terms and conditions of the Creative Commons Attribution (CC BY) license (http://creativecommons.org/licenses/by/4.0/).
Authors’ addresses:
Kalvis Kons, PhD
e-mail: kalvis.kons@slu.se
Dimitris Athanassiadis, PhD
e-mail: dimitris.athanassiadis@slu.se
David A. Agar, PhD *
e-mail: david.agar@slu.se
Swedish University of Agricultural Sciences
Department of Forest Biomaterials and Technology
Skogsmarksgränd
901 83, Umeå
SWEDEN
* Corresponding author
Received: February 02, 2022
Accepted: December 01, 2022
Original scientific paper