
Influence of Stump-Root System of Trees on Rut Formation During Forwarder Operation on Peat Soils
doi: 10.5552/crojfe.2023.2116
volume: 44, issue:
pp: 14
- Author(s):
-
- Piskunov Maxim
- Article category:
- Original scientific paper
- Keywords:
- forwarder, rut depth, soil, stump, trail microprofile
Abstract
HTML
To explain the soil deformation processes under the influence of logging machines, average values of various indicators are often used. One of these indicators is the rut depth formed during tractor passages. The average values do not fully describe the consequences of passages on the skidding trails, for example, the rut depth varies along the track. This variability includes both random and regular components. The stump-root systems of trees located on the skidding trail and along its border act as a factor that introduces a pattern. To determine the degree of influence of stumps on 8 sections of skidding trails with the length of 25 and 50 m, located on peat soils (the average mass fraction of water is 82.3%), the rut depth was measured at intervals of 0.5 m and the locations of stumps were noted. The resulting arrays of vertical marks represent the microprofiles of the experimental sections. Measurements were taken after 2 harvester passages and 2 forwarder passages. The stumps were divided into two groups: located inside the tractor track and outside it. Statistical processing of the data showed a wide spread of the rut dimensions in each array. Average values at the sections (standard deviations) in cm were: 21.6(17.7); 30.6(21.6); 37.7(22.7); 46(20.3); 36.4(15.0); 36(15.4); 30.6(21.0); 34(21.0). The autocorrelation functions, constructed for the series of values, showed surges with moderate correlation coefficients on the lags where stumps were noted. An increase in stumps per a length unit of the skidding trail shows an increase in the number of such surges. A decrease in the rut dimensions, in relation to the places where the influence of the roots was absent, averaged: in points 0.5 m away from the stump – 44% (22.6); 1 m away – 32% (20.4); 1.5 m away – 22% (14.2). The spatial influence factor of the roots explains 21% of the variability of the rut dimensions along the skidding trail. The factor of the stump location relative to the track is 19%. The combined influence of these factors is 25%. Further identification of regularities in the rut formation processes is associated both with the continuation of studies of the root system influence, but with the inclusion of factors of the stump size and variety, and with the study of the variability of the soil physical properties along the skidding trails, analysing how this is found in the microprofile structure.
Influence of Stump-Root System of Trees on Rut Formation During Forwarder Operation on Peat Soils
Maxim Piskunov
Abstract
To explain the soil deformation processes under the influence of logging machines, average values of various indicators are often used. One of these indicators is the rut depth formed during tractor passages. The average values do not fully describe the consequences of passages on the skidding trails, for example, the rut depth varies along the track. This variability includes both random and regular components. The stump-root systems of trees located on the skidding trail and along its border act as a factor that introduces a pattern. To determine the degree of influence of stumps on 8 sections of skidding trails with the length of 25 and 50 m, located on peat soils (the average mass fraction of water is 82.3%), the rut depth was measured at intervals of 0.5 m and the locations of stumps were noted. The resulting arrays of vertical marks represent the microprofiles of the experimental sections. Measurements were taken after 2 harvester passages and 2 forwarder passages. The stumps were divided into two groups: located inside the tractor track and outside it. Statistical processing of the data showed a wide spread of the rut dimensions in each array. Average values at the sections (standard deviations) in cm were: 21.6(17.7); 30.6(21.6); 37.7(22.7); 46(20.3); 36.4(15.0); 36(15.4); 30.6(21.0); 34(21.0). The autocorrelation functions, constructed for the series of values, showed surges with moderate correlation coefficients on the lags where stumps were noted. An increase in stumps per a length unit of the skidding trail shows an increase in the number of such surges. A decrease in the rut dimensions, in relation to the places where the influence of the roots was absent, averaged: in points 0.5 m away from the stump – 44% (22.6); 1 m away – 32% (20.4); 1.5 m away – 22% (14.2). The spatial influence factor of the roots explains 21% of the variability of the rut dimensions along the skidding trail. The factor of the stump location relative to the track is 19%. The combined influence of these factors is 25%. Further identification of regularities in the rut formation processes is associated both with the continuation of studies of the root system influence, but with the inclusion of factors of the stump size and variety, and with the study of the variability of the soil physical properties along the skidding trails, analysing how this is found in the microprofile structure.
Keywords: forwarder, rut depth, soil, stump, trail microprofile
1. Introduction
Research in the field of deformation processes and destruction of forest soils during the movement of logging machines in the course of logging operations has a long history. Interest in this issue does not wane even at present. Thus, various studies in this area, presented by scientists in recent years, show that the research in this field is still relevant. The scientific works, carried out in the last 10 years, include the results of studies dedicated to the influence of various factors on the processes of mechanical deformation of forest soils in the places where wheeled and crawler tractors pass through logging areas; the results of testing alternative methods for measuring formal criteria used to analyze the mechanical damage to soils; alternative methods for modelling and predicting the soil damage caused by the passage of technological machines.
The results of studies on the effects of various logging systems on forest soil damage are presented in the work by Cudzik et al. (2017). The technology of logging operations influences the area of the damaged logging section and the rut formation in the places where logging machines pass. A study of the use of various technologies in thinning revealed that, compared with the tree-length technology, for the cut-to-length technology, the skidding trail system occupied 70% more logging area, but the intensity of rutting for this technology turned out to be much less. Thus, for example, after the cut-to-length technology, the number of sections with a rut depth of 0.16–0.25 m turned out to be three times less than after the tree-length technology, and sections with a rut of more than 0.25 m were not found at all, while after the tree-length technology the length of such sections was 4–6% of the total length of skidding trails.
The study by Picchio et al. (2020) presents the results of a systematic analysis of a large corpus of scientific publications dedicated to the impact of logging on forest ecosystems. The authors set out to find out how modern scientific research contributes to reducing the impact of logging on soil damage, natural reforestation and damage to a forest stand. The authors note that only 2 countries (Poland and Finland) apply legal norms regulating the maximum possible level of damage to forest stands. In case of exceeding the regulated indicators, penalties may be imposed on timber merchants. With regard to soil damage and the creation of obstacles to natural reforestation due to logging operations, there is no experience of applying legal and regulatory control yet.
A meta-analysis on the effect of soil compaction associated with logging operations on the physical properties and microbial biomass carbon of forest soil is presented in the study by Nazari et al. (2021). The authors studied the effect of weight and the number of machine passages on the total porosity, bulk density, and saturated hydraulic conductivity of the soil. The properties of soils with different textures and at different depths were studied. The paper notes that the greatest damage to soils occurs at 20 or more passages of a logging machine. In addition, the authors point out that the analyzed physical characteristics of the soil are not restored to their original values within 3–6 years. The authors recommend a more careful approach to the choice of logging machines and the logging season, as well as minimizing the area of skidding trails in the cutting area.
Soil moisture has a significant effect on soil damage (Jourgholami and Majnounian 2011) and if there is a seasonal change in soil moisture, then this is a factor influencing the intensity of soil deformation. Changes in the intensity of rutting at the same section in September, November and December when the soil moisture changes are shown in the work by Toivio et al. (2017). The authors studied multiple passages (up to 10 passages) of a forwarder along one track and concluded that, under the conditions studied, the first three passages of the tractor caused the greatest soil compaction and up to 70% of the maximum rut size, with the first passage having the strongest impact.
The influence of the skidding trail slope on the change in the physical properties of the soil after the passage of a forwarder was noted in the work of Cambi et al. (2016). The authors note that in the section of the skidding trail with a slope of 31%, after two passages of the tractor, such a parameter as the soil shear resistance increased by 82%, while in the section with a slope of 3% after 10 passages, the shear resistance increased only by 19%. An increase in the width of the skidding trail as a way to reduce the rut depth when driving a forwarder on peat soils is considered in the work of Uusitalo et al. (2015). For example, an increase in the width of the skidding trail from 4.5–6 m made it possible to reduce the maximum rut depth by an average of 5 cm after 3–4 passages of the forwarder. However, this study does not show how much a wider skidding trail allows to increase the maximum possible number of the forwarder passages along this skidding trail.
Among the articles prepared in recent years on the issues of mechanical deformation of soils from the passage of logging machines, we have selected a group of works that offer the results of studies of the protective properties of logging waste used as a coating on the skidding trails. The properties of the coatings on which the forwarder and skidder were moving were studied. Concerning the forwarder, the structures were studied, both in the form of bulk waste with the density of 35–50 kg/m2 and in the form of logging mats with the dimensions of 5x1x0.2 m (Ring et al. 2021). Concerning the skidder, the structures with the density of 10 and 20 kg/m2 were studied in the form of bulk waste; the structures formed from sawdust delivered from a sawmill; the structures consisting of a mixture of logging residues and sawdust (Solgi et al. 2018). The average rut depth in the areas without a protective coating in the presented results significantly exceeded the size of the rut, which was formed in the areas with a protective coating. After 6 passages of the forwarder in the studied areas, the average rut depth in places where there was no protective coating exceeded 0.2 m. In the areas where the logging residue coating was formed, the average rut depth was no more than 0.1 m. After 10 passages of the skidder, the greatest protective effect was shown by the coating of logging residues with the density of 20 kg/m2 (depending on the conditions, it was possible to achieve a reduction in the rut depth by 67–75% compared to the area without a protective coating). Experimental confirmation of the protective properties of logging residues used as a coating for skidding trails was also obtained in the work of Matangaran (2012). After 10 passages of the forwarder, a rut with the depth of 24 cm was formed in the areas without coating, the soil density increased by an average of 41%, no rutting was noted in the coated areas, the density increased only by 27%.
The design of a forwarder transmission, steering control and travel system are also studied by scientists as a factor influencing soil damage. Studies have shown that the forwarder equipped with a transmission system with axles and wheels that can be steered individually (for example, the El-forest F15 model with three separate steerable axles without tandem drive beams) has advantages under multiple passage conditions and allows to reduce the rutting intensity compared to conventional forwarder arrangements (Edlund et al. 2012). A noticeable reduction in the intensity of rutting was observed during multiple passages of the forwarder equipped with double tandem drive beams and an additional secondary rear axle compared to the forwarder equipped with only double tandem drive beams (Ala-Ilomäki et al. 2011, Fjeld and Østby-Berntsen 2020, Starke et al. 2020)
The results of the studies dedicated to the advanced designs of forwarder travel systems are presented in the work (Gelin and Björheden 2020). Three designs were considered. The first design is a Xt28 forwarder (Extractor AB, Sweden). The frame is connected by two hinges, and six wheels are mounted on pendulum levers. The second design is a Gentle forwarder based on the Komatsu 845 model with a crawler travel system from a BvS10 all-terrain vehicle (BAE Systems Hägglunds, Sweden). The third design is an OnTrack forwarder with rubber crawler tracks based on the Ponsse Buffalo long-frame forwarder. Testing of the concepts showed promising results for their further application on soft, sensitive soils (Gentle and OnTrack models) and for work on rough terrain with slopes (Xt28 model). Compared to traditional forwarder layouts, the use of advanced machine designs has shown noticeable improvements in terms of the impact on soil, operator comfort and fuel consumption. However, the authors note that more work needs to be done before the concepts are ready for testing in a real logging process.
Among the articles concerning the issues of studying the impact of passage of logging machines on the forest soil, a group of works, devoted to alternative methods of measuring the results of this impact, stand out in relation to the manual data collection. For example, the study of Salmivaara et al. (2018) provides information on the use of a method for measuring the rut depth based on a light detection and ranging system (LIDAR). As the authors note with the help of a lidar sensor mounted on the tractor frame, it becomes possible to obtain a large array of correct data on changes in the rut dimensions that occur in the places where the tractor passes during logging operations. This method has good prospects to become an integral element of a system that allows to form a dataset for building predictive models describing the damage to skidding trails from logging machines (Niemi et al. 2017). A promising method for measuring soil deformation caused by the passage of logging machines is associated with photogrammetric survey and photogrammetric image processing. The results of approbation of this method for measuring the rut dimensions are presented in the works of Pierzchała et al. (2016), Haas et al. (2016), Marra et al. (2018).
A method for obtaining data on the processes occurring on skidding trails as a result of multiple passages of logging machines, based on the measurement of the clearance of these machines using ultrasonic distance sensors, is described in the work of Jones et al. (2018). Despite the fact that the noise, associated with the presence of displaced soil, stones, stumps and logging waste in the places where machines pass, prevents obtaining correct data on the deformations of skidding trail surfaces, this method has prospects for obtaining information that allows to investigate the consequences of passages of machines on forest soil by indirect evidence. The use of two Kinect V2 cameras for data collection demonstrated the ability of this technology to obtain adequate information about the rut depth that occurs during the passage of a forwarder along the skidding trail. The authors of Melander and Ritala (2018) show that the data obtained with these cameras are in agreement with the data obtained by traditional manual measurements.
The continuation of research in the direction of searching for new parameters and clarifying traditional parameters for the formal assessment of the mechanical and physical properties of the soil and their changes caused by the passage of logging machines, with a view to using these parameters as a tool for predicting soil deformations, including the rut formation, found reflection in the work of Schönauer et al. (2021). The authors point out the need to have reliable parameters for predicting the rut formation even at the planning stage of logging operations, before the movement of logging machines in the logging areas. 4 terramechanical parameters (cone Index, penetration depth, cone penetration and shear strength) and 2 cartographic parameters (topographic wetness index and depth-to-water) have been considered. It is concluded that cartographic parameters cannot yet be considered as reliable parameters for predicting the rut dimensions, but additional attention should be paid to two terramechanical parameters: penetration depth and cone penetration. The study has also noted that the rut depth after the first passage of a logging machine is a reliable indicator for further predicting the rut for 4 subsequent passages of logging machines along one track, but this indicator is not fully suitable for preliminary forecasting.
As an alternative to predicting soil deformation based on field parameters reduced to some averaging models, it is proposed to model the soil deformation caused by the passage of technological machines using the discrete element method and build computer simulations and software systems based on this method. (Wiberg et al. 2021). The same method has advantages for studies that are difficult to organize and perform in the field, and for the development of new designs of logging machines.
Scientific articles, prepared in recent years in the field of mechanical soil damage caused by the passage of logging machines, show that researchers continue to conduct their studies, including those on the basis of approaches and rules that have been already historically developed and become traditional. Most research works use some average indicators: the average rut depth, the average soil density, etc. However, the works in the field of applying new methods for collecting experimental data, methods of computer modelling of deformation processes, as well as the improvement of tools for manual measurements, show that it is advisable to expand research work towards studying the patterns of rut formation, which occurs not in some separate areas with fixed values, influencing factors, but in the space of the entire system of transport routes of the logging area (system of skidding trails).
Some directions for such researches can be, for example, an analysis of how certain factors affect the length of sections with a rut of certain dimensions; in what interval the change in the rut dimensions occurs within individual sections and what affects this variability; analysis of surface deformation statistics, etc. The prerequisites for such studies are: variability of soil properties within the boundaries of logging areas; variability of the traffic of logging machines in the different sections of the skidding trail system; variability of the logging area relief, as well as the results already reflected in scientific articles. In particular, it has been shown that even over a 20 m length of a skidding trail, the rut dimensions can change significantly (Melander and Ritala 2018, Ring et al. 2021).
One of the factors that affects not only the rut formation in a single section, but also how the rut will change and spread along the skidding trail, as a specific transport route, in the places where technological machines pass, is the stump-root system of trees. Stumps and roots penetrating the soil (Nadezhdina and Čermák 2003) have reinforcing properties that prevent the formation of ruts and affect the length and size of the ruts on the skidding trail. A clear reinforcing effect is found when tractors operate on soils with a weak bearing capacity, on peat soils and soils with high moisture content. Thus, the aim of the work is to study the influence of the stump-root system on the processes of the rut formation and changes in its dimensions along the length of the skidding trail on sensitive (peat) soils under the conditions of cut-to-length logging technology, and the reflection of this influence in the formal analysis of experimental data.
The main hypothesis of the study is the following: the rut size changes along the skidding trail and this variability contains both a random component and a regular one. The regular component is introduced by the stump-root systems of trees located directly on the skidding trail or on its border. This regular component can be detected and taken into account in further studies of soil deformation on the skidding trails as a result of the passage of a logging machine.
2. Materials and Methods
The studies were conducted in the logging area, where harvesting was carried out according to the cut-to-length technology using a John Deere 1270D harvester and a John Deere 1110D forwarder. The rut measurement was carried out after 2 passages of a harvester and 2 passages of a forwarder. The forwarder was equipped with tracks on the wheels of the rear axle. The harvester was equipped with tracks on the wheels of the front axle. Tractors used Clark Terra tracks. The harvester used the tyres: on the front axle – Nokian 700/50–26.5; on the rear axle – Nokian 600/65–34. The pressure in the tyres of the front axle wheels is 460 kPa; in the tyres of the rear axle wheels – 290 kPa. The forwarder used the tyres: on the front and rear axles – Nokian 700/50–26.5. The pressure in the tyres of the front axle wheels is 310 kPa; in the tyres of the rear axle wheels – 460 kPa.
The type of felling – evenly-gradual felling of mature and over-mature trees. The form of felling is selective. The intensity of felling is 22% of the volume. Rut formation in selective cuttings is explained by the fact that in this case a minimum of logging waste accumulates on the skidding trails and extended areas free from protection in the form of logging waste coating are formed on the skidding trails. The type of soil in the studied sections of the logging area is peat soils with excessive moisture. The month of the experiments is October 2021. Territory – Russia, Republic of Karelia, Pryazhinsky district, Urochishe (plot of land) – Kutizhemskoye.
On the skidding trails, long straight sections were selected by visual inspection. They were characterized by a minimum accumulation of logging waste in the places where the forwarder wheels passed and where there were no local differences in heights and slopes. 8 sections, located on different skidding trails, in different parts of the logging area, were investigated. Six sections were 25 m long, 2 sections had the length of 50 m. The total length of the measurements was 250 m.
In the studied areas, the rut depth was measured in the places where the wheels of a logging machine were passing. The rut was measured using a Condtrol Neo X200 laser level and a Biber Profi level with a measurement range of up to 2000 mm. The rut depth was measured every 0.5 m. The length control was carried out using a Condtrol XP1 laser rangefinder. The obtained arrays of vertical marks represent the microprofiles of the experimental sections.
In the process of measurements in the studied sections, the location of the stumps that influenced the rut formation was noted. According to their location on the skidding trail, these stumps were classified into groups:
stumps located in the rut (in the places of direct passage of the tractor wheels)
stumps located in the center of the skidding trail (between the ruts). In this group, for each stump, it was additionally noted to which rut (right or left) this stump was located closer
stumps located on the outer side of the skidding trail along the rut.
In addition to measuring the rut and fixing the location of the stumps, additional external objects affecting the rut formation were noted in the studied areas. Such objects included local accumulations of logging waste, preventing the rut formation; thin fragments of tree trunks laid in the rut; large stones that come to the surface.
Soil samples were taken in the studied sections of the skidding trails. Soil samples were taken directly from the side wall of the rut, below the level of the forest floor. The samples were weighed, dried, and then the weight moisture content of the soil was determined as the ratio of the weight of water in the soil to the weight of completely dry soil, as well as the weight fraction of water in the total weight of the entire sample. The total number of samples for all experimental sections was 31. The number of samples for sections No. 1–4 was 16; for sections No. 5–8 it was 15. The sampling sites along the experimental sections of skidding trails were located at a distance of 6 m relative to each other, but if the influence of a stump or branches was observed at the proposed sampling site, then the sampling site was shifted to the nearest free point. The soil moisture content by weight for experimental sections No. 1–4 was in the range of 293–542% (average – 450%, standard deviation – 86.4), weight fraction of water – 75–84% (average – 81.2%, standard deviation – 3.41), for experimental sections No. 5–8 it was in the range of 420–600% (average – 486%, standard deviation – 50.2), weight fraction of water in samples was 81–86% (average – 82.8%, standard deviation – 1.4). Not high values of standard deviations make it possible to conclude that the samples are representative. The data obtained adequately assess the moisture content of the experimental section, as the experimental sections were specially selected in places characterized by a homogeneous structure and physical and mechanical properties of forest soil and forest stands growing in the experimental sections. However, the author admits that with a larger number of samples, outliers of moisture values may be detected, which in general will affect the variability of the rut depth, but at the same time will not block the influence of the stump-root system.
Sampling was carried out the next day after the completion of the forestry equipment work. Moreover, the sections were examined where both the harvester and the forwarder started and finished their operations during the same work shift (after the harvester, the forwarder started and finished its work in the experimental section on the same day). Weather conditions and ambient temperature during the experiments, the features of the cutting area relief and the soil state could not have a fundamental effect on the soil moisture in the experimental sections during the day.
The collected data were subjected to statistical processing. The statistical processing was carried out using Excel 2010 and Stadia 8.0 software packages. The investigated sections of skidding trails were considered as transport routes. For roads with different coatings, such as a skidding trail used as a transport route, it is advisable to consider the nature of the distribution of damage through a statistical analysis of surface roughness, similar to the analysis of roughness that is performed for public roads (Parkhilovski 1968, Dodds and Robson 1973). It is only necessary to take into account that skidding trails are distinguished by a small length (50–250 m) compared to roads, the length of which ranges from several kilometers to hundreds of kilometers; different sections of the same skidding trail experience different traffic of logging machines; in conditions of soils with high humidity, the surface of skidding trails is strongly deformed when logging machines pass, so that the next passages of the machines can be carried out already in the changed conditions. That is, the formal statistics of the surface roughness will show a different state of the transport way. These peculiarities impose restrictions on the formation of experimental data. Thus, for skidding trails in the cutting strip, it seems difficult to form a series of microprofile values for very long sections due to the fact that the trails themselves are short transport routes and often, even in these short sections, under a strong influence of relief features. In this regard, this study used the data obtained on the sections located on different skidding trails but having relatively similar characteristics, and the analysis was carried out on a set of sections.
The microprofile of the skidding trail surface was considered as a random function. An array of the rut measurements in each experimental section formed a sample. For each sample, a normalized autocorrelation function was determined and a correlogram was constructed, with the help of which the analysis of the sample structure was carried out (Silaev 1972). Based on the values of the autocorrelation coefficients, a conclusion was made about the presence or absence of a trend in the sample (if the highest coefficient was a first-order coefficient, a conclusion was made about the presence of a trend) and about the presence of a cyclical component with a certain period (if the highest coefficient of autocorrelation accounted for a non-first-order coefficient). The hypothesis was accepted that the effect of stumps on the rut formation in the data array of the rut dimensions should be reflected in the presence of cyclicity. The period of this cyclical component should be associated with the location of stumps on the skidding trail.
In addition to external factors that could be observed visually in the experiment, the rut formation is also influenced by factors hidden from external observation, for example, such as the depth of groundwater, presence of an underlying layer, height of the peat layer, large stones hidden deep in the soil and others. The influence of these factors leads to some data asymmetry. To smooth this asymmetry, the logarithm of a series of values was taken, and autocorrelation functions were determined for the resulting values.
In addition to constructing autocorrelation functions to identify the influence of stumps and their root system on the rut formation, an analysis of the relationship between the rut depth and the distance to the location of a stump was also made. Correlation analysis was performed for the data presented both in absolute values of the rut depth and in adjusted values, when the excess of the rut depth over the value recorded in the place where the stump was located was taken as the rut size, that is the rut depth at the location of the stump was taken as zero. The analysis was carried out for measurements taken at points along the rut no more than 2 m away from the location of the stump.
The rut measurements were carried out along the machine track in the direction of its movement. If in the course of measurements a stump was encountered inside the rut, its location was taken as a zero point. If the stump was not located inside the track, but along its border, then the point located next to this stump, but inside the track, was taken as a zero point, and the reading of measurement was carried out, precisely, from that point. The data were grouped depending on the location of the measurement sites relative to the stump location. The distances to the places of measurement of the rut depth, located in front of the stump in the direction of a tractor, were taken as negative values, and behind the stump – as positive values.
Regression analysis was performed for the obtained experimental data. The dependent variable was the rut depth measured in the experimental sections; the independent variables were:
the distance from the stump location to the place where the control of the rut dimensions was carried out. In contrast to the correlation analysis, the regression analysis considers the distance data without the factor of their location relative to the stump, that is, all distance values were taken as positive
the stump location relative to the track (rut) of a logging machine. This independent variable took three values: 0, 1, 2. The variable took value 0 in cases where the distance of measurement from the stump location was more than 1.5 m and/or the influence of the stump-root system on the rut formation was not detected. Value 1 was in the case when there was the influence of the stump, which was located next to the machine track (on the outside of the track or in the skidding trail centre – between the machine tracks). Value 2 appeared when the stump was located directly inside the rut.
The calculation excluded the places where the rut formation was carried out under the influence of not only the stump-root system, but also under the influence of other factors, such as the presence of logging waste at the measurement site. Also, the values obtained in areas away from the location of the stumps by more than 2.5 m, were not taken into account. Regression analysis was carried out to analyze the influence of each independent variable on the variability of the rut dimensions. The multiple linear regression was also built to analyze the combined influence of factors on the dependent value.
3. Results
Fig. 1–2 show the results of measurements of the rut depth in the experimental sections. On the graphs, the reverse order of values is chosen. Each graph highlights the location of stumps and other artifacts that prevent the rut formation. Other artefacts included places that were reinforced with logging waste or with transverse flooring made of thin wood. If on the graph, at the locations of the stumps, the values go above the zero mark, it means that in this place the stump is located directly in the rut. Otherwise, it is situated on the side of the rut. The graphs additionally highlight the values at the intervals for which high correlation coefficients were obtained when constructing autocorrelation functions for the skidding trail profile as a random function. Fig. 3 shows the autocorrelation functions themselves for each experimental plot. Table 1 presents the average rut depths and standard deviations for the data series obtained in the experimental areas. The sample amounts for sections 3 and 4 were 100 measurements, for the rest – 50 measurements each. Since the number of measurements for the experimental sections of the selected length (25 and 50 m) is sufficient for an adequate statistical analysis of the change in the rut depth, a large spread of data (increased values of standard deviations) confirms that there is an influence of some objective factors related to the environment and features of the manufacturing process rather than factors related to the data collection procedure.
Table 1 Average values of rut depth and standard deviations
|
Number of section |
Mean, cm |
Standard deviation |
|
Section 1 |
21.6 |
17.7 |
|
Section 2 |
30.6 |
21.6 |
|
Section 3 |
37.7 |
22.7 |
|
Section 4 |
46.0 |
20.3 |
|
Section 5 |
36.4 |
15 |
|
Section 6 |
36.0 |
15.4 |
|
Section 7 |
30.6 |
21 |
|
Section 8 |
34.0 |
21 |
The autocorrelation function constructed for section 1 (Fig. 1a and 3a) shows relatively high correlation coefficients of 0.47 and 0.62 on lags 5 and 9. Lags 5 and 9 correspond to the intervals for measuring the rut depth after 2.5 and 4.5 m, respectively, along the length of the skidding trail. Thus, the rut dimensions chart contains 2 cyclical componentswith periods of 2.5 m and 4.5 m, respectively. The cyclicity on lag 5 is explained by the influence of the stump and its root system on the rut formation in the measurement places. The rut dimensions on lag 5 in most measurements coincide with the locations of the stumps. On the contrary, the cyclicity on lag 9 is connected with the areas for which the influence of the stump-root system on the rut formation is not significant, and the rut in these places tends to be the largest.
In section 2 (Fig. 1b and 3b), there is a surge in the value of the autocorrelation function on lag 10. Here, the correlation coefficient is 0.286, which is not strong, but there is a surge on lag 10, which corresponds to an interval along the length of the skidding trail of 5 m, and compared with other intervals it is mainly associated with places where the waste preventing the rut formation accumulates. The influence of the root system on the rut formation of this lag was noted only in one place. The root system of the stumps influences the rut formation in this section, but the distance between the stumps along the length of the section is different, that is, there are no repeating intervals between the stumps, and therefore, the autocorrelation function does not reveal a distinct cyclicity in the resulting series of rut depth values.
In section 3 (Fig. 1c and 3c), the cyclical component is not clearly manifested, but is masked by the presence of a non-linear trend. Visual observations did not reveal external factors influencing the nature of rutting. The hidden factors, which are associated with the emergence of the trend, however, have not fundamentally affected the way how the stump-root system of individual trees influences the rut formation. If the rut depth is considered individually in the places where the influence of the stump-root system is found, then there is clearly a noticeable decrease in the rut dimensions, compared with places located far from the stump.
For section 4 (Fig. 1d and 3d), there is a surge in the values of the correlation coefficients on lags 11 and 12 (intervals along the experimental sections are 5.5 and 6 m). The correlation coefficients on these lags are 0.27. The correlation is not strong, but noticeable. The correlation surge is due to the fact that along the length of the section, after 5.5–6 m, there are places where the influence of the stump-root system on the rut formation is noticeable. Since stumps are not found in every interval, but only in separate places, this explains the low value of the correlation coefficient.
For section 5 (Fig. 2a and 3e), a relatively high correlation coefficient of 0.41 was noted on lag 5, which corresponds to an interval of 2.5 m in the experimental section. The chart shows that, among all places forming a cycle with a period of 2.5 m, the influence of the stump-root system or logging residues on the rut formation was noted on about 60% of the places.
In section 6 (Fig. 2b and 3f), a high correlation coefficient was noted at lag 8 (the correlation coefficient of 0.61). The increased correlation coefficient on this lag is due to the fact that after 4 m there are sections where factors that reduce the intensity of rut formation are observed: logging residues and the stump-root system. High correlation coefficients can also be noted on lag 9 (0.51) and 7 (0.57). On these lags (the intervals of 4.5 m and 3.5 m) there are also stumps and the areas reinforced with waste.
In section 7 (Fig. 2c and 3g), the autocorrelation function does not show the presence of a cyclical component after the second lag. This is due to the fact that the location of the stumps in this area is random. The distances between the stumps that affect the rut formation and the areas reinforced with waste are different and do not form a periodicity that would be reflected in the autocorrelation diagram. However, considering individually the locations of the stumps, one can notice that in these places the rut depth is noticeably smaller compared to places that are far from the stump.
For section 8 (Fig. 2d and 3h), on lag 8 (the interval of 4 m), the correlation coefficient is 0.3. On this lag, in accordance with the rut depth distribution chart, the cyclicity is not associated with the places where the direct presence of a stump or waste is noted, but with the influence of these artefacts on the rut formation, which extends to a certain length of the skidding trail. At intervals of 4 m, there are areas located no further than 1 m from places in which the presence of stumps or waste is noted. At the same time, the rut depth values in these places take on some intermediate values, relative to the largest and smallest dimensions of the rut.
Also, the correlograms for all sections showed high correlation coefficients on the second lag, since the measurements were carried out at an interval of 0.5 m, and the distance between the stumps was a multiple of this interval. However, for this study, surges in the values of correlation coefficients on other lags are of greater interest.
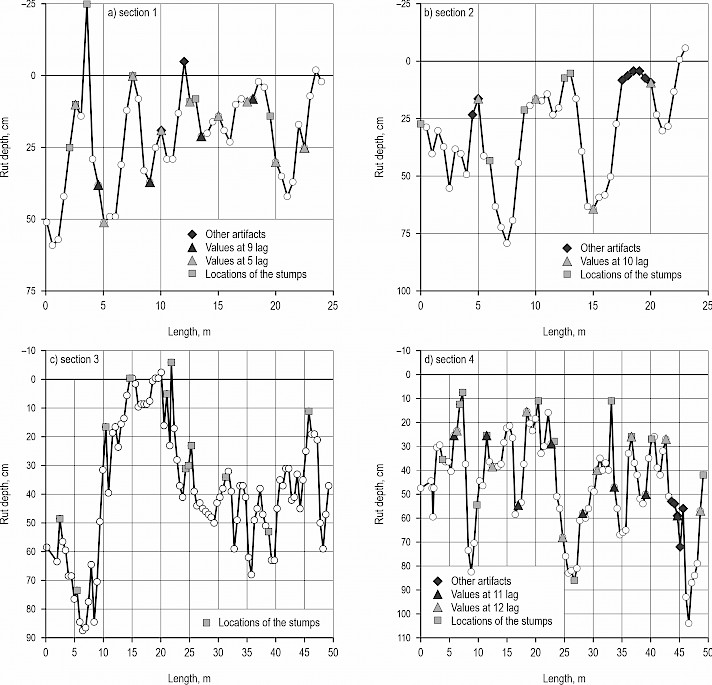
Fig. 1 Change in the rut depth in experimental sections
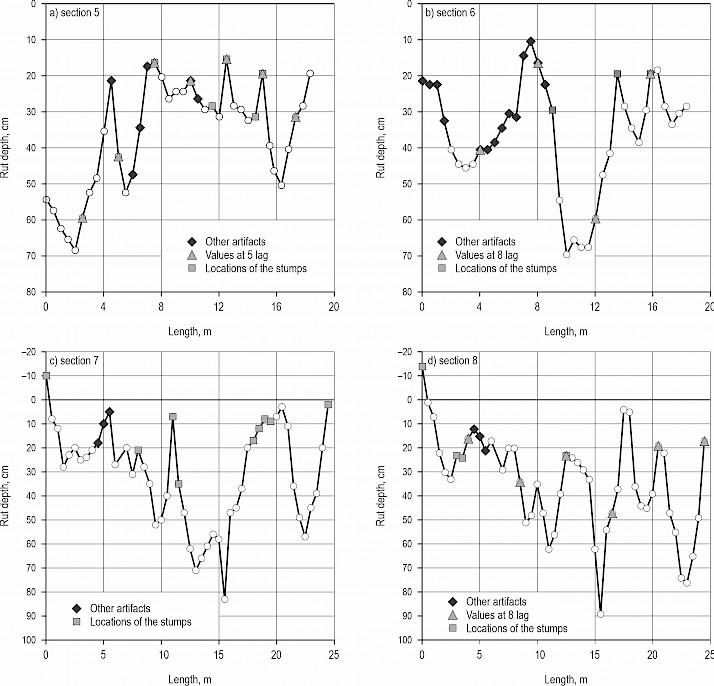
Fig. 2 Change in rut depth in experimental sections
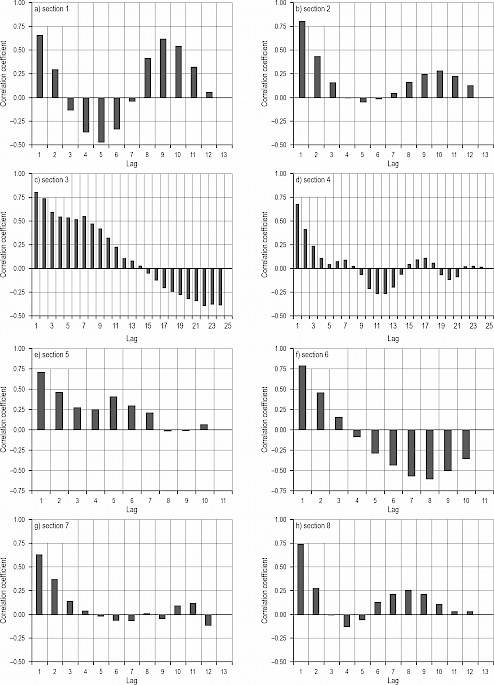
Fig. 3 Autocorrelation functions for experimental sections
Fig. 4 shows the change in the rut depth depending on the distance from the location of a stump. Fig. 4a presents the data as absolute values. In Fig. 4b the data are presented as values of the rut dimensions showing the change in the rut depth relative to the rut dimensions obtained at the stump location, i.e. the rut depth at the stump location was taken as zero. Experimental data have shown that the stump-root system reduces the intensity of rut formation and its size. Correlation analysis shows that the change in the rut depth (as you move away from the stump) is described by a quadratic dependence and the influence of the stump-root system can be traced at a distance of up to 1.5 m from the stump. The rut dimensions in relation to the places where the influence of the root system was absent, decreased on average: in points 0.5 m away from the stump by 44% (standard deviation (SD) – 22.6%); 1 m away – 32% (SD – 20.4); 1.5 m away – 22% (SD – 14.2). In the zero point, in case if the stump was not inside the track, but outside, the decrease in the rut depth averaged 61% (SD – 21%). To make a comparison, the places were taken where there was no influence of the root system on the rut formation, but as close as possible to the calculated points and located no further than 2 m from the zero points. However, it should be noted that the present analysis did not take into account the factor of the stump location relative to the tractor track.
The rut depth was measured at the places where the tractor passed, and the stumps were located both directly in the rut and on the side of the rut along its border or a little further from the border. This explains the wide spread of experimental data values. The stumps that got inside the tractor track protruded above the skidding trail surface. The average height of the stumps located inside the track was 12 cm (minimum – 0.5 cm; maximum – 29.5 cm), the standard deviation was 9.9 cm.
R
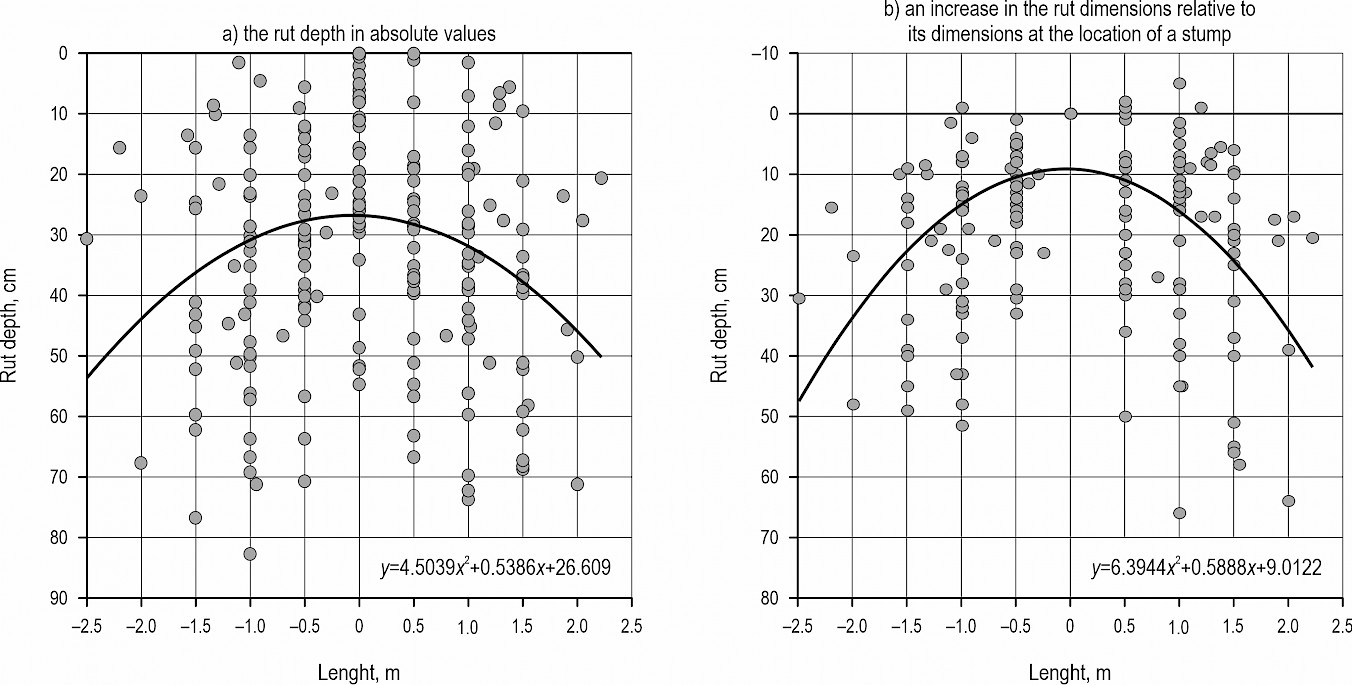
Fig. 4 Rut depth depending on the distance from the stump
The outcome of the regression analysis showed the following results. There is a moderate linear relationship between the rut depth on the skidding trail (variable Y) and the distance from the stump to the place where the rut dimensions are controlled (variable X1). The parameters and type of regression are presented in Table 2, line 1. The determination coefficient shows that 21% of the variability of the rut dimensions is explained by variable X1, that is, the rut size changes along the length of the skidding trail are moderate, but depend on the location of the stumps on the skidding trail.
A moderate relationship was also obtained between the rut depth and the stump location relative to the machine track (variable X2). In this case, 19% of the variability in the rut dimensions is explained by variable X2. The parameters and type of regression are presented in Table 2, line 2.
Multiple linear regression showed a stronger combined effect of factors on the rut depth compared to a single-factor analysis. The combined influence of the independent variables explains 25% of the variability in the rut dimensions. The studied factors are significant predictors in the model. The multiple correlation coefficient (R2) is 0.5. The parameters and type of regression are presented in Table 2, line 3.
Table 2 Regression equations
|
Line |
Regression |
Sum of square |
Mean square |
F-statistic |
P-value |
R2 |
|
1 |
Y=21.95+13.75X1 |
23,332.3 |
23,332.3 |
63.50 |
<0.001 |
0.213 |
|
2 |
Y=48.6–15.34X2 |
20,824.9 |
20,824.9 |
55.04 |
<0.001 |
0.19 |
|
3 |
Y=33.64+9.28X1-8.67X2 |
27,519.2 |
13,759.6 |
39.20 |
<0.001 |
0.252 |
|
Variables |
Coefficient |
Standard error |
t-statistic |
Standardized coefficient |
P-value |
Variance inflation factor |
|
|
33.64 |
3.98 |
8.43 |
0 |
<0.001 |
– |
|
X1 |
9.28 |
2.12 |
4.37 |
0.31 |
<0.001 |
1.59 |
|
X2 |
-8.67 |
2.51 |
–3.45 |
–0.25 |
<0.001 |
1.59 |
4. Discussion
The use of average values of the dimensions of the rut, which is formed during the passage of logging machines, to describe the deformations of forest soils, often used in research practice, does not fully reflect the real picture of the consequences of these passages. Thus, the analysis of standard deviations (Table 1) shows a large spread of values of the rut dimensions along the machine track. Average values can be used in the relatively short sections, where homogeneous characteristics of the soil and other natural and production factors are recorded. In case of movement along the long sections of skidding trails, both the variety of the influencing factors themselves and the heterogeneity of their values are included, which makes a significant impact on the rut variability. If the rut variability is slight on the weakly deformed soils, that is, the influence of a variety of factors is hardly noticeable or not noticeable at all, then in conditions of weak soils, slight fluctuations in the values of the influencing factors are sharply reflected in the overall picture of the rut variability. Thus, stumps on the skidding trail occur periodically, that is, they introduce some heterogeneity into the natural and production environment. With the help of regression analysis, it was shown that the influence of factors associated with the presence of the root system in the places where tractors pass by explains the variability of the rut dimensions by 25%. Moreover, the combined influence of two factors (the stump location relative to the track and the spatial influence of the root system) showed a more significant effect in the rut changes than the influence of factors separately (19 and 21%, respectively). In this regard, a promising direction for studying the deformations of forest soils is the study of particular factors making a significant contribution to the rut variability, the study of their joint contribution and the relationship between the variability of factors and the variability of the rut depth.
Analyzing the values of the rut dimensions obtained in the form of numerical series, it can be seen that these series do not represent series of only random values (unlike general transport routes, Parkhilovski (1968)). Statistical processing of data in the form of constructing autocorrelation functions shows that the series can include both a trend component and a cyclical component.
Trend components appeared for the data obtained in all experimental sections. Visual observations did not make it possible to determine with which factors the manifested trends were associated, and the purpose of this work did not extend to finding out what the trend was associated with. However, the studies of other authors confirm the influence on the rut formation by factors such as: the depth of groundwater (Ring et al. 2021); relief peculiarities (Najafi et al. 2009); mosaic of mechanical and granulometric properties of soil or distribution of soil classes (Mohtashami et al. 2017); thickness of a peat surface layer (Ala-Ilomäki et al. 2011); difference in logging machine traffic along the skidding trail length (Zenner et al. 2007). The variation of values of these factors along the length of the skidding trail (in this work, along the length of the experimental section) reveals the presence of a trend component in changes in the rut dimensions.
Analyzing the presence of a cyclical component in the obtained series of values of the rut dimensions, attention should be paid to the fact that the lags, for which an increased value of the correlation coefficients on the correlogram are observed, are associated with the frequency of sections where the influence of the stump-root system and the protective coating from logging waste is noted for the rut formation. If these places are repeated along the length of the experimental section at equal intervals, that is, a cycle is formed, then this appears on the correlogram. Moreover, the more such places occur with a certain period in the experimental section, the higher the correlation coefficients on the corresponding lags of the correlograms are. If such places along the length of the skidding trail occur at different random intervals, then the correlograms show the absence of a cyclical component for the experimental section.
The cyclical component manifests itself not only for the places where the influence of the stump-root system on the rut formation is observed, but also for the places where such influence is absent. For example, if the places are equidistant from the locations of the nearest stumps, for which the rut size tends to the largest value in some local neighborhoods placed with some periodicity along the length of the experimental section, then this is also reflected in the correlogram.
An analysis of correlograms in conjunction with a graph showing the change in rut dimensions depending on the distance of the measurement sites from the location of the stump shows that as the distance from the stump increases, the rut depth increases. This increase in a formalized form over the entire data array is close to a parabolic regularity. Repeating parabolic segments along the length of the experimental sections also contribute to the cyclical change of the rut on the skidding trails.
Further elucidation of the influence of the stump-root system on the formation of the microprofile of a skidding trail located on soft soils is associated with an analysis of the distribution (spatial orientation) of the root system depending on the size and variety of the tree. These factors were not identified in the present study.
Attention should be paid to the fact that trend and cyclical components were found for the data obtained for the areas of skidding trails that were not reinforced with logging waste and located on peaty, highly moistened soils. The movement of logging machines under these conditions is associated with the formation of a deep rut already during the first passages, and the range between the values of the largest rut and the smallest one is such that it makes it possible to show the influence of the stump-root system on the change in the skidding trail microprofile using the methods of statistical data processing used for analysis of random functions. Under certain conditions of weakly deformable soils and strengthening the entire length of the skidding trail with logging waste, the influence of the stump-root system in the structure of the series showing the change in the skidding trail microprofile does not manifest itself as a cyclic component, that is, the microprofile is described only by a sequence of random numbers.
Understanding the patterns of the rut changes along the machine track provides additional information for developing recommendations for the rational distribution of branches along the skidding trail in order to strengthen it when logging machines move in conditions of the soils subject to heavy deformation. The root system not only prevents the rut formation, but also makes a significant contribution to the tractor dynamics. A significant spread of vertical points of the longitudinal profile of the skidding trail causes additional dynamic loads on the machine running system. Predicting the rut variability along the skidding trail, taking into account the influence of stump-root systems, opens up opportunities for modernization and refinement of the methods for designing the chassis and suspension systems of logging machines, as well as the typing of natural and production conditions according to the degree of dynamic impact of the surface of the skidding trails on tractors and the substantiation of speeds of tractors in conditions of mechanically weak forest soils. The use of the obtained data on the variability of the rut dimensions in the digitized maps of forest areas makes it possible to model rational schemes for the placement of skidding trails in the cutting areas based on the condition of reducing the dynamic effects on a tractor or based on the condition of reducing the areas with long ruts. Moreover, a promising direction of research practice concerning the described problems is the determination in the total soil deformation of the component due to the dynamic effect caused by the tractor vertical vibrations when driving in conditions of the changing rut size.
5. Conclusion
The hypothesis about the regular contribution of the stump-root system to the variability of the rut depth, in which the rut depth acts as a formal criterion for the analysis of soil deformation, was confirmed. The experimental data showed a wide spread of values of the rut dimensions along the tractor track on the skidding trail. The wide range of values is confirmed by the high values of the standard deviations calculated for the array of measurements obtained in each experimental section; the values of these deviations vary between 41 and 82% of the average rut dimensions. This variation is not related to the data collection procedure and sample amount. The analysis of autocorrelation functions built on the series of values of the rut dimensions measured along the tractor track showed the appearance of surges in the functions on the lags where stumps were noted. The number of surges and their severity are related to the number of stumps in the experimental section. The regression analysis found that 25% of the variability of the rut depth along the skidding trail is explained by the presence of stumps in the track or along the border of the tractor track and the spatial influence of the root system on the rut formation, and this influence extends from the location of the stump to a length of up to 1.5 m along the track. In the places on the skidding trail where the influence of the stump-root system is noted, a decrease in the rut dimensions is observed due to the soil reinforcement with roots.
6. References
Ala-Ilomäki, J., Högnäs, T., Lamminen, S., Sirén, M., 2011: Equipping a conventional wheeled forwarder for peatland operations. International Journal of Forest Engineering 22(1): 7–13. https://doi.org/10.1080/14942119.2011.10702599
Edlund, J., Bergsten, U., Löfgren, B., 2012: Effects of two different forwarder steering and transmission drive systems on rut dimensions. Journal of Terramechanics 49(5): 291–297. https://doi.org/10.1016/j.jterra.2012.03.004
Cambi, M., Grigolato, S., Neri, F., Picchio, R., Marchi, E., 2016: Effects of forwarder operation on soil physical characteristics: a case study in the Italian Alps. Croatian Journal of Forest Engineering 37(2): 233–239.
Cudzik, A., Brennensthul, M., Białczyk, W., Czarnecki, J., 2017: Damage to soil and residual trees caused by different logging systems applied to late thinning. Croatian Journal of Forest Engineering 38(1): 83–95.
Dodds, C.J., Robson, J.D., 1973: The description of road surface roughness. Journal of Sound and Vibration 31(2): 175–183. https://doi.org/10.1016/S0022-460X(73)80373-6
Fjeld, D., Østby-Berntsen, Ø., 2020: The effects of an auxiliary axle on forwarder rut development – a Norwegian field study. Int. J. For. Eng. 31(3): 192–196. https://doi.org/10.1080/14942119.2020.1765645
Gelin, O., Björheden, R., 2020: Concept evaluations of three novel forwarders for gentler forest operations. Journal of Terramechanics 90: 49–57. https://doi.org/10.1016/j.jterra.2020.04.002
Haas, J., Ellhöft, K.H., Schack-Kirchner, H., Lang, F., 2016: Using photogrammetry to assess rutting caused by a forwarder – a comparison of different tires and bogie tracks. Soil and Tillage Research 163: 14–20. https://doi.org/10.1016/j.still.2016.04.008
Jones, M-F., Castonguay, M., Jaeger, D., Arp, P., 2018: Track monitoring and analyzing machine clearances during wood forwarding. Open Journal of Forestry 8(3): 297–327. https://doi.org/10.4236/ojf.2018.83020
Jourgholami, M., Majnounian, B., 2011: Effects of wheeled cable skidder on rut formation in skid trail — a case study in Hyrcanian forest. J. For. Res. 22: 465-469. https://doi.org/10.1007/s11676-011-0112-9
Marra, E., Cambi, M., Fernandez-Lacruz, R., Giannetti, F., Marchi, E., Nordfjell, T., 2018: Photogrammetric estimation of wheel rut dimensions and soil compaction after increasing numbers of forwarder passes. Scandinavian Journal of Forest Research 33(6): 613–620. https://doi.org/10.1080/02827581.2018.1427789
Matangaran, J.R., 2012: Soil compaction by Valmet forwarder operation at soil surface with and without slash. Journal Manajemen Hutan Tropika 18(1): 52–59.
Melander, L., Ritala, R., 2018: Time-of-flight imaging for assessing soil deformations and improving forestry vehicle tracking accuracy. Internation Journal of Forest Engineering 29(2): 63–73. https://doi.org/10.1080/14942119.2018.1421341
Mohtashami, S., Eliasson, L., Jansson, G., Sonesson, J., 2017: Influence of soil type, cartographic depth-to-water, road reinforcement and traffic intensity on rut formation in logging operations: a survey study in Sweden. Silva Fennica 51(5): article id 2018. https://doi.org/10.14214/sf.2018
Nadezhdina, N., Čermák, J., 2003: Instrumental methods for studies of structure and function of root systems of large trees. Journal of Experimental Botany 54(387): 1511–1521. https://doi.org/10.1093/jxb/erg154
Najafi, A., Solgi, A., Sadeghi, S.H., 2009: Soil disturbance following four wheel rubber skidder logging on the steep trail in the north mountainous forest of Iran. Soil and Tillage Research 103(1): 165–169. https://doi.org/10.1016/j.still.2008.10.003
Nazari, M., Eteghadipour, M., Zarebanadkouki, M., Ghorbani, M., Dippold, M.A., Bilyera, N., Zamanian, K., 2021: Impacts of logging-associated compaction on forest soils: a meta-analysis. Frontiers in Forests and Global Change 4: 1–15. https://doi.org/10.3389/ffgc.2021.780074
Niemi, M.T., Vastaranta, M., Vauhkonen, J., Melkas, T., Holopainen, M., 2017: Airborne LiDAR-derived elevation data in terrain trafficability mapping. Scandinavian Journal of Forest Research 32(8): 762–773. https://doi.org/10.1080/02827581.2017.1296181
Parkhilovski, I.G., 1968: Investigations of the probability characteristics of the surfaces of distributed types of roads. Avtomobil'naya Promyshlennost' 8(2968): 18–22.
Picchio, R., Mederski, P.S., Tavankar, F., 2020: How and how much, do harvesting activities affect forest soil, regeneration and stands? Current Forestry Reports 6(2): 115–128. https://doi.org/10.1007/s40725-020-00113-8
Pierzchała, M., Talbot, B., Astrup, R., 2016: Measuring wheel ruts with close-range photogrammetry. Forestry 89(4): 383–391. https://doi.org/10.1093/forestry/cpw009
Ring, E., Ågren, A., Bergkvist, I., Finér, L., Johansson, F., Högbom, L., 2020: A guide to using wet area maps in forestry. Skogforsk, Uppsalat, 36 p.
Ring, E., Andersson, M., Hansson, L., Jansson, G., Högbom, L., 2021: Logging mats and logging residue as ground protection during forwarder traffic along till hillslopes. Croatian Jorunal of Forest Engineering 42(3): 445–462. https://doi.org/10.5552/crojfe.2021.875
Salmivaara, A., Miettinen, M., Finér, L., Launiainen, S., Korpunen, H., Tuominen, S., Heikkonen, J., Nevalainen, P., Sirén, M., Ala-Ilomäki, J., Uusitalo, J., 2018: Wheel rut measurements by forest machine-mounted LiDAR sensors – accuracy and potential for operational applications? International Journal of Forest Engineering 29(1): 41–52. https://doi.org/10.1080/14942119.2018.1419677
Schönauer, M., Hoffmann, S., Maack, J., Jansen, M., Jaeger, D., 2021: Comparison of selected terramechanical test procedures and cartographic indices to predict rutting caused by machine traffic during a cut-to-length thinning operation. Forests 12(2): 113. https://doi.org/10.3390/f12020113
Silaev, A., 1972: Spektralnaja teorija podressorivanija trasportnyh mashin. Mashinostroenie, Moscow, USSR, 172 p.
Solgi, A., Naghdi, R., Labelle, E.R., Zenner, E.K., 2018: The effects of using soil protective mats of varying compositions and amounts on the intensity of soil disturbances caused by machine traffic. International Journal of Forest Engineering 29(3): 199–207. https://doi.org/10.1080/14942119.2018.1527174
Starke, M., Derron, C., Heubaum, F., Ziesak, M., 2020: Rut depth evaluation of a triple-bogie system for forwarders – field trials with TLS data support. Sustainability 12(16): 6412. https://doi.org/10.3390/su12166412
Toivio, J., Helmisaari, H., Palviainen, M., Lindeman, H., Ala-Ilomäki, J., Sirén, M., Uusitalo, J., 2017: Impacts of timber forwarding on physical properties of forest soils in southern Finland. Forest Ecology and Management. 405(1): 22–30. https://doi.org/10.1016/j.foreco.2017.09.022
Uusitalo, J., Salomäki, M., Ala-Ilomäki, J., 2015: The effect of wider logging trails on rut formations in the harvesting of peatland forests. Croatian Journal of Forest Engineering 36(1): 125–130.
Wiberg, V., Servin, M., Nordfjell, T., 2021: Discrete element modelling of large soil deformations under heavy vehicles. Journal of Terramechanics 93: 11–21. https://doi.org/10.1016/j.jterra.2020.10.002
Zenner, E.K., Fauskee, J.T., Berger, A.L., Puettmann, K.J., 2007: Impacts of skidding traffic intensity on soil disturbance, soil recovery, and aspen regeneration in North Central Minnesota. Northern Journal of Applied Forestry 24(3): 177–183. https://doi.org/10.1093/njaf/24.3.177
© 2023 by the authors. Submitted for possible open access publication under the
terms and conditions of the Creative Commons Attribution (CC BY) license (http://creativecommons.org/licenses/by/4.0/).
Author’s address:
Assoc. prof. Maxim Piskunov, PhD
e-mail: piskunov_mp@list.ru
Petrozavodsk State University
Institute of Forestry, Mining and Construction Sciences
Department of Transport and Production Machines and Equipment
Lenin Str. 33
185910, Petrozavodsk
Republic of Karelia
RUSSIA
Received: May 24, 2022
Accepted: January 10, 2023
Original scientific paper