
Measurement of Individual Tree Parameters with Carriage-Based Laser Scanning in Cable Yarding Operations
doi: 10.5552/crojfe.2023.2252
volume: 44, issue:
pp: 15
- Author(s):
-
- Gollob Christoph
- Krassnitzer Ralf
- Ritter Tim
- Tockner Andreas
- Erber Gernot
- Kühmaier Martin
- Hönigsberger Ferdinand
- Varch Thomas
- Holzinger Andreas
- Stampfer Karl
- Nothdurft Arne
- Article category:
- Original scientific paper
- Keywords:
- steep terrain harvesting, laser scanning, automatic tree mapping, point clouds, diameter estimation, height estimation
Abstract
HTML
Introduction: Cable yarding is a technology that enables efficient and sustainable use of timber resources in mountainous areas. Carriages as an integral component of cable yarding systems have undergone significant development in recent decades. In addition to mechanical and functional developments, carriages are increasingly used as carrier platforms for various sensors. The goal of this study was to assess the accuracy of individual standing tree and stand variable estimates obtained by a mobile laser scanning system mounted on a cable yarder carriage.
Methods: Eight cable corridors were scanned across two forest stands. Four different scan variants were conducted, differing in the movement speed of the carriage and the direction of movement during scanning. An algorithm for tree detection, diameter and height estimation was applied to the 3D datasets and evaluated against manual tree measurements.
Results: The analysis of the 3D scans showed that the individual tree parameters strongly depend on the scan variant and the distance of each individual tree to the skyline. This was due to changing 3D point densities and occlusion effects. It turned out that scan variant 1, in which the scan was performed during slow carriage movement downwards and back upwards again, was advantageous. At a distance of 10 m, which is half of the recommended corridor spacing of 20 m for whole tree cable yarding, 95.44% of the trees in stand 1 and 92.16% of the trees in stand 2 could be detected automatically. The corresponding root mean sqare errors of the diameter at breast height estimatimations were 1.59 cm and 2.23 cm, respectively. The root mean square errors of the height measurements were 2.94 m and 4.63 m.
Conclusions: The results of this study can help to further advance the digitization of cable yarding and timber flow from the standing tree to the sawmill. However, this requires further development steps in cable yarder, carriage, and laserscanner technology. Furthermore, there is also a need for more efficient software routines to take the next steps towards precision forestry.
Measurement of Individual Tree Parameters with Carriage-Based Laser Scanning in Cable Yarding Operations
Christoph Gollob, Ralf Krassnitzer, Tim Ritter, Andreas Tockner, Gernot Erber, Martin Kühmaier, Ferdinand Hönigsberger, Thomas Varch, Andreas Holzinger, Karl Stampfer, Arne Nothdurft
Abstract
Introduction: Cable yarding is a technology that enables efficient and sustainable use of timber resources in mountainous areas. Carriages as an integral component of cable yarding systems have undergone significant development in recent decades. In addition to mechanical and functional developments, carriages are increasingly used as carrier platforms for various sensors. The goal of this study was to assess the accuracy of individual standing tree and stand variable estimates obtained by a mobile laser scanning system mounted on a cable yarder carriage.
Methods: Eight cable corridors were scanned across two forest stands. Four different scan variants were conducted, differing in the movement speed of the carriage and the direction of movement during scanning. An algorithm for tree detection, diameter and height estimation was applied to the 3D datasets and evaluated against manual tree measurements.
Results: The analysis of the 3D scans showed that the individual tree parameters strongly depend on the scan variant and the distance of each individual tree to the skyline. This was due to changing 3D point densities and occlusion effects. It turned out that scan variant 1, in which the scan was performed during slow carriage movement downwards and back upwards again, was advantageous. At a distance of 10 m, which is half of the recommended corridor spacing of 20 m for whole tree cable yarding, 95.44% of the trees in stand 1 and 92.16% of the trees in stand 2 could be detected automatically. The corresponding root mean sqare errors of the diameter at breast height estimatimations were 1.59 cm and 2.23 cm, respectively. The root mean square errors of the height measurements were 2.94 m and 4.63 m.
Conclusions: The results of this study can help to further advance the digitization of cable yarding and timber flow from the standing tree to the sawmill. However, this requires further development steps in cable yarder, carriage, and laserscanner technology. Furthermore, there is also a need for more efficient software routines to take the next steps towards precision forestry.
Keywords: steep terrain harvesting, laser scanning, automatic tree mapping, point clouds, diameter estimation, height estimation
1. Introduction
Cable yarding is a general solution for load handling in areas where terrain is too steep or too difficult to allow ground-based extraction (Samset 2013). Introduced in the late 19th century, the technology has been continuously refined. For example, while the first cable yarders were still steam-driven and one hundred percent manually controlled (Visser and Harrill 2017), today, cable yarders are powered by sophisticated diesel or hybrid engines, offer full or semi-automation of certain work tasks and can be operated remotely. Carriages are an integral part of cable yarder systems and have developed considerably, particularly in the Central European region. There, cable yarding is dominated by standing skyline, tower yarder technology developed in Austria in the 1960s (Heinimann et al. 2001), with radio controlled movement, radio-controlled chokers, automation of carriage movement, motorized carriages and energy recuperating systems that have become standard features (Varch et al. 2021). These developments are in line with the defining features of industrial revolutions 3.0 (computers and automation) and 4.0 (cyber-physical systems, networking and machine learning).
The strategic change in the Industrial Revolution over time is interesting in this respect, particularly the transformation in the last 10 years. While Industry 4.0 in the 2010s envisioned full automation through cyber-physical systems and artificial intelligence (AI) and thus the replacement of humans as the central goal, a rethink took place with Industry 5.0. Instead of replacing humans, Industry 5.0 focuses on human-machine communication and human-machine interaction. Industry 5.0 is thus fully in line with the goals of Human-Centered AI. In the synergistic approach of Human-Centered AI (HCAI), the declared goal is to align artificial intelligence with human values, ethical principles, and legal requirements to ensure security and safety, and above all not to replace humans, but to support them (Holzinger et al. 2022).
In addition, and in line with these developments and further digitalization of cable yarding, machines are equipped with ever more compact and powerful sensors which serve to operate the machine, assist the operator, provide data on harvested timber or capture the operational environment. Particularly in carriages, sensors for environment recording as well as position determination have been integrated. For example, the use of geospatial sensors (GNSS – Global Navigation Satellite System) or various camera technologies allow to achieve a higher level of automation and thus reduce the operator's workload. GNSS sensors are used in combination with other sensors in carriages for monitoring of cable yarding cycle elements (Gallo et al. 2021, Borz et al. 2022), indirect payload estimation via deflection measurement (Guerra et al. 2020) or simply for monitoring of carriage position and movement (Harrill et al. 2019, Mologni et al. 2021). Especially when using grapple carriages, camera systems help the operator in the yarder cabin to identify the load via dedicated screens and thus replace human guides previously dangerously exposed on the slope (Varch et al. 2021).
Carriage-mounted sensors are mainly used for improved machine control and monitoring of the machine. Forest information technology in the sense of »Precision Forestry« also includes the monitoring of the timber flow from the standing tree to the processing in the timber industry. This should also involve constant data exchange and interaction with timber harvesting. Accordingly, in terms of Forestry 4.0, Feng and Audy (2020) formulate that real environments need to be mapped via remote sensing techniques (e.g. lidar – Light detection and ranging) to create cyber physical production systems that can share information constantly.
Such lidar sensors are already successfully used in forest inventory and monitoring (Ritter et al. 2017, Gollob et al. 2019, Balenović et al. 2020, Gollob et al. 2020a, Gollob et al. 2020b, Gollob et al. 2021, Liang et al. 2022, Tockner et al. 2022, Witzmann et al. 2022). For example, Personal Laser Scanning (PLS) can be used to efficiently and accurately determine individual tree positions, diameters, heights and volumes. As mentioned above, there are strong efforts to digitize more of the forestry supply chain from standing trees to mills. Using single tree metrics, estimates can be made of operational performance, productivity and costs (Rodrigues et al. 2019). Furthermore, automatic equipment positioning and navigation of vehicles can be supported with single tree data (Roßmann et al. 2009). In addition to forest engineering interest in smart and precision forest operations, the development of a verifiable supply chain of forest products with tree-specific labeling and tracking systems is important (Keefe et al. 2022). The timber/tree should be traceable from its actual, exact place of origin (geographic coordinates of the individual tree). This can be done, for example, in fully mechanized forest harvesting by coupling RFID tags (radio-frequency identification), bar codes, QR codes, biological fingerprinting with GNSS signals of tree positions. These GNSS tree positions can then be merged with lidar forest inventory data. Thus, the work progress and the flow of the timber can be queried and tracked at any time. However, these solutions for monitoring the work progress and supply chain are insufficient in cable yarding systems with chain saw felling and processing of the tree at the roadside. There, information is usually only available from the time the trees are delimbed, bucked and stacked by the processor at the landing.
The aim of this study was therefore to close this gap by installing a mobile laser scanning system on the carriage of a tower yarder and to capture 3D information of the surrounding trees during carriage operation as would be required for monitoring the harvesting progress. Furthermore, this 3D information should be automatically analyzed to get individual standing tree variables and to evaluate their accuracy. To our knowledge, this is the first study involving such a setup and including the investigation of how the accuracy of automatic tree measurements was influenced by speed and direction of carriage movement and distance of the trees to the skyline. Manual field measurements at the test sites were used as reference data.
The point clouds, application videos, photos of the data acquisition, results and reference data used in this study are freely available (Creative Commons Attribution 4.0 International License – CC BY 4.0) under https://doi.org/10.5281/zenodo.7383032.
2. Materials and Methods
To view the appendix, the reader is referred to
https://zenodo.org/record/7923175/files/Appendix_CROJFE_carriage_based_laser_scanning.pdf?download=1
2.1 Study Area
The study area was located near the village of Soboth (46°41'52.0"N 15°05'23.5"E) in the federal state of Styria, Austria. For the present study, a total of 8 cable corridors (3 cable corridors in stand 1 and 5 cable corridors in stand 2) were established in two stands (see Fig. 1). In the following, the cable corridors of stand 1 are referred to as cable corridor 1, 2, and 3 and those of stand 2 as cable corridor 4, 5, 6, 7, and 8. Stand 1 with 2.30 ha was 43 years old and dominated by Norway Spruce (Picea abies L.). Stand 2 with 1.88 ha was 95 years old, dominated by Norway spruce (Picea abies L.) and European beech (Fagus sylvatica L.) and interspersed with single individuals of European larch (Larix decidua Mill.), Silver fir (Abies alba Mill.) and Scots pine (Pinus sylvestris L.). The tree positions, DBH (diameter at breast height measured from one direction at 1.3 m height), tree heights and species of all trees with a DBH of 5 cm or greater were collected. Following covariates were derived for each stand additionally: terrain slope, basal area per hectare (BA/ha), quadratic mean diameter (dm), stand density index (SDI) according to Reineke (1933), stem density in terms of number of trees per hectare (N/ha), coefficient of variation of diameter at breast height (CVDBH), DBH differentiation according to Füldner (1995) (Diff_Fuel), Clark and Evans aggregation index (Clark and Evans 1954) (CE), and Shannon index (Shannon 1948). Table 1 shows summary statistics (stand area, number of trees, number of cable corridors, mean, standard deviation, min, and max) of the metric stand parameters.
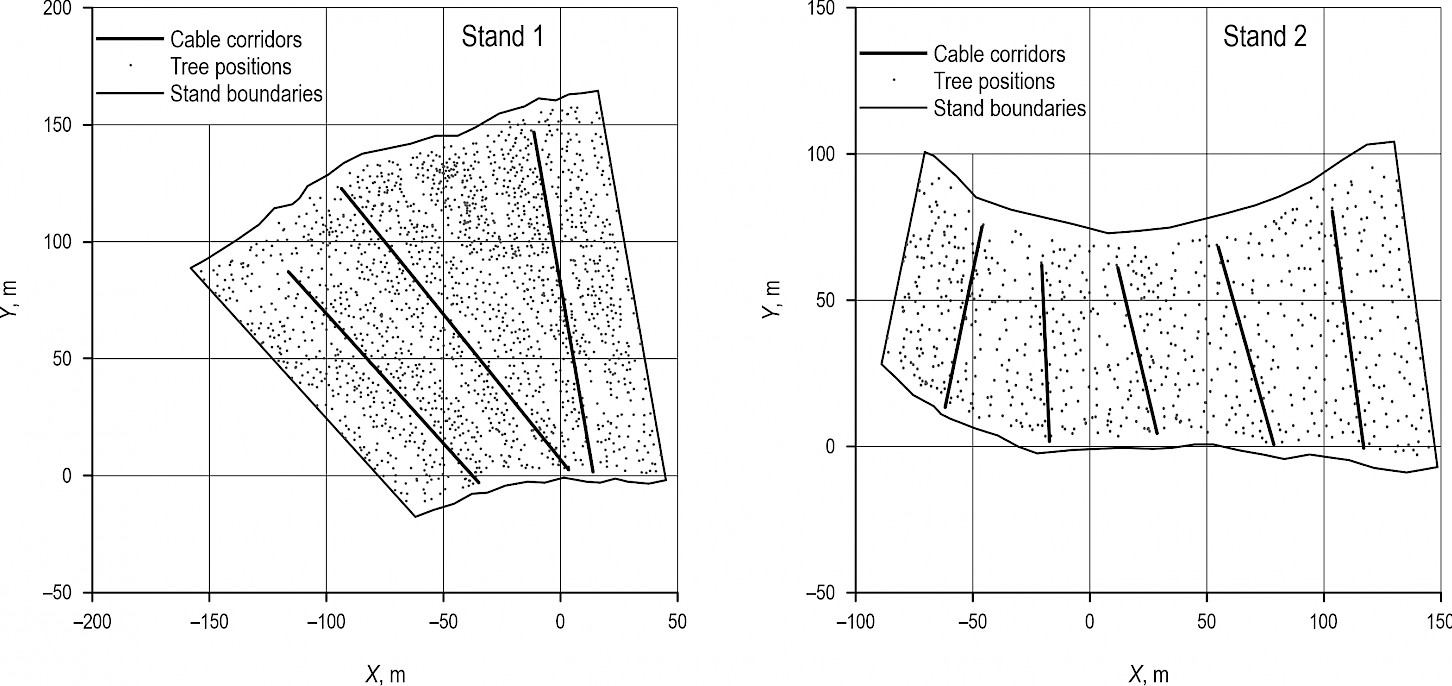
Fig. 1 Red lines mark cable corridors 1–3 in stand 1 and 4–8 in stand 2 (each from right to left)
Table 1 Summary statistics of forests stands
|
|
Stand 1 |
Stand 2 |
|||||||
|
Area, ha |
2.30 |
1.88 |
|||||||
|
# of cable corridors |
3 |
5 |
|||||||
|
Slope, % |
34.94 |
58.61 |
|||||||
|
# of trees |
1849 |
741 |
|||||||
|
dm, cm |
23.76 |
35.68 |
|||||||
|
BA/ha, m²/ha |
35.60 |
32.17 |
|||||||
|
N/ha, trees/ha |
802.86 |
321.75 |
|||||||
|
SDI, trees/ha |
739.92 |
569.40 |
|||||||
|
CVDBH |
0.38 |
0.37 |
|||||||
|
Diff_Fuel |
0.30 |
0.32 |
|||||||
|
CE |
0.09 |
0.08 |
|||||||
|
Shannon |
0.82 |
1.14 |
|||||||
|
|
mean |
sd |
min. |
max. |
mean |
sd |
min. |
max. |
|
|
DBH, cm |
22.18 |
8.53 |
5.00 |
62.40 |
33.46 |
12.38 |
5.00 |
70.20 |
|
|
Height, m |
19.07 |
5.65 |
3.90 |
30.80 |
26.94 |
5.25 |
10.90 |
37.20 |
|
|
Slope – slope of stand, dm – diameter of mean basal area tree, BA/ha – basal area per hectare, N/ha – number of trees per hectare, SDI – stand density index, CVDBH – coefficient of variation of diameter at breast height, Diff _Fuel – DBH differentiation according to Füldner, CE – Clark and Evans aggregation index, shannon – Shannon index |
|||||||||
2.2 Instrumentation and Data Collection
A total of 8 cable corridors were scanned in August 2020 during sunny and non-windy weather using a GeoSLAM ZEB HORIZON (GeoSLAM Ltd., Nottingham, UK) mobile laser scanner mounted on a Koller SKA 1 carriage of a Koller K 300-T tower yarder (Koller Ltd., Schwoich bei Kufstein, AUT) (see Fig. 2a). The K 300-T was fixed on the 3-Point-Hitch of a 60 HP Steyr 760a farm tractor (CNH Industrial Österreich Ltd., St. Valentin, AUT). Basically, the scanning system consists of two parts:
- scanning unit (see Fig. 2b)
- data logger (see Fig. 2c).
The scanning unit consists of a VLP-16 rotating scan head (Velodyne LiDAR Inc., Morgan Hill, CA, USA), which can measure up to 300,000 points per second at a maximum distance of 100 m, a Firefly 8si camera with 4k resolution, and an inertial measurement unit (IMU). The data logger includes the computing unit, a solid-state disk memory (120 GB) and the battery (operating time approx. 2.5 h). The data logger is connected to the scanning unit via a cable. The size of the collected 3D data was approximately 100–200 MB per minute. A USB 3.0 port on the data logger was used to transfer the data to an external flash drive.
A set of four scan variants was applied for each cable corridor, differing in the movement speed of the carriage and the direction of movement during scanning (see Table 2). The most intensive scan, variant 1, was defined by a slow movement of the carriage downhill and back uphill during the scanning. Scan variant 2 had the same direction of movement but the carriage speed was faster. With both variants, the scanning process started and ended with the carriage in a position near the tower. The turning point of the carriage movement was at the tailspar. Scan variants 3 and 4 had a lower scan intensity, as the scanning process was only performed during the uphill movement. This took place at a slow speed in variant 3 and at a faster speed in variant 4. Scanning started at the tailspar and ended near the tower. A summary statistics of length of the scanned cable corridors and movement speed of the scan variants can be found in Table 2. Regardless of the scan variant, the ZEB HORIZON started the scan process with IMU initialization, in order to create the local coordinate system. In the course of this, it was important that the scanner was not moved and did not receive any vibrations. After approximately 15 s of this initialization phase, the scanner head started to rotate and captured data of the full 3D environment. At this moment, the movement of the carriage was also started. The captured 3D data was stored in real time on the hard drive, located in the data logger in ».geoslam« data format. Even before scanning, it was ensured that no major obstacles or branches along the cable corridor would touch or interfere with the scanner during the scanning process. During scanning, the movement of the carriage was monitored visually by an observer who, if necessary, communicated via radio with the operator of the cable yarder system. It is also important to mention that no timber was logged with the carriage during the scanning operation.
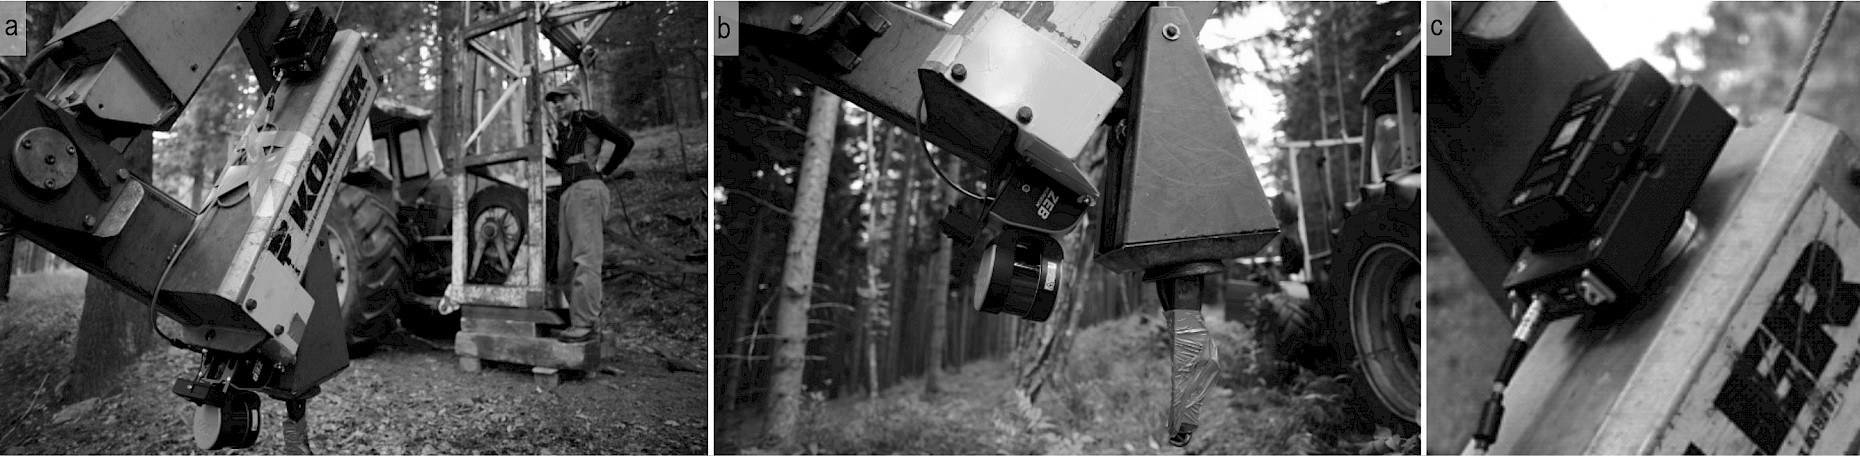
Fig. 2 a) GeoSLAM ZEB HORIZON mobile laser scanner mounted on Koller SKA 1 carriage, b) scanning unit with rotating scan head, camera, and inertial measurement unit (IMU), c) data logger with computing unit, memory, and battery
Table 2 Summary statistics of cable corridor length and carriage speed during scanning
|
|
mean |
sd |
min. |
max. |
|
Length of scanned cable corridor, m |
90.24 |
35.61 |
70.34 |
155.95 |
|
speed variant 1, m/s |
0.74 |
0.06 |
0.62 |
0.82 |
|
speed variant 2, m/s |
1.00 |
0.19 |
0.61 |
1.19 |
|
speed variant 3, m/s |
0.60 |
0.07 |
0.53 |
0.72 |
|
speed variant 4, m/s |
1.13 |
0.08 |
1.03 |
1.25 |
2.3 Point Cloud Processing
When the laser scanning was accomplished, the data was transferred from the data logger to a workstation with GeoSLAM Hub 6.1.0 software using a USB flash drive. In GeoSLAM Hub, the data was automatically processed using the SLAM (Simultaneous Localization and Mapping) algorithm. First, the position of the scanner and trajectory during the scanning process were calculated using the IMU data and feature detection algorithms (Ryding et al. 2015). The final point cloud was calculated based on the distances and angles of the 3D points relative to the scanner position. The SLAM algorithm minimized the errors in the IMU measurements and maximized the matches between the 3D points for each respective time segment (Ryding et al. 2015). The point cloud were exported in ».las« format.
Further point cloud processing and analysis were performed using algorithms presented by Ritter et al. (2017), Gollob et al. (2020b) and Tockner et al. (2022) programmed in the statistical computing language R (R Core Team 2022). These algorithms included the DTM estimation, tree detection (XY coordinates), DBH and height measurement. After the DTM estimation and the normalization of the point cloud, the stem position finding and DBH measurement were done using a density based clustering algorithm with a subsequent cross-section modeling in multiple horizontal layers. After this step, the list of tree positions (stem center at breast height) was used as seed points for the subsequent region growing algorithm. The growing region worked in an iterative process, in which the nearest neighbor points were added to the seed points and to the cluster of previously allocated points. The resulting single tree point clouds were then used to calculate tree heights. For example, Fig. 3 shows a cross-section of the raw point cloud before the algorithms are applied (see Fig. 3a), and a segmented point cloud with individual trees after the algorithms are applied (see Fig. 3b). The following point clouds could not be evaluated due to operating errors during 3D data acquisition: cable corridor 1 variant 1, cable corridor 2 variant 2, cable corridor 4 variant 3. For further details on the algorithms or individual tree parameter estimation, the reader is referred to Ritter et al. (2017), Gollob et al. (2020b) and Tockner et al. (2022).
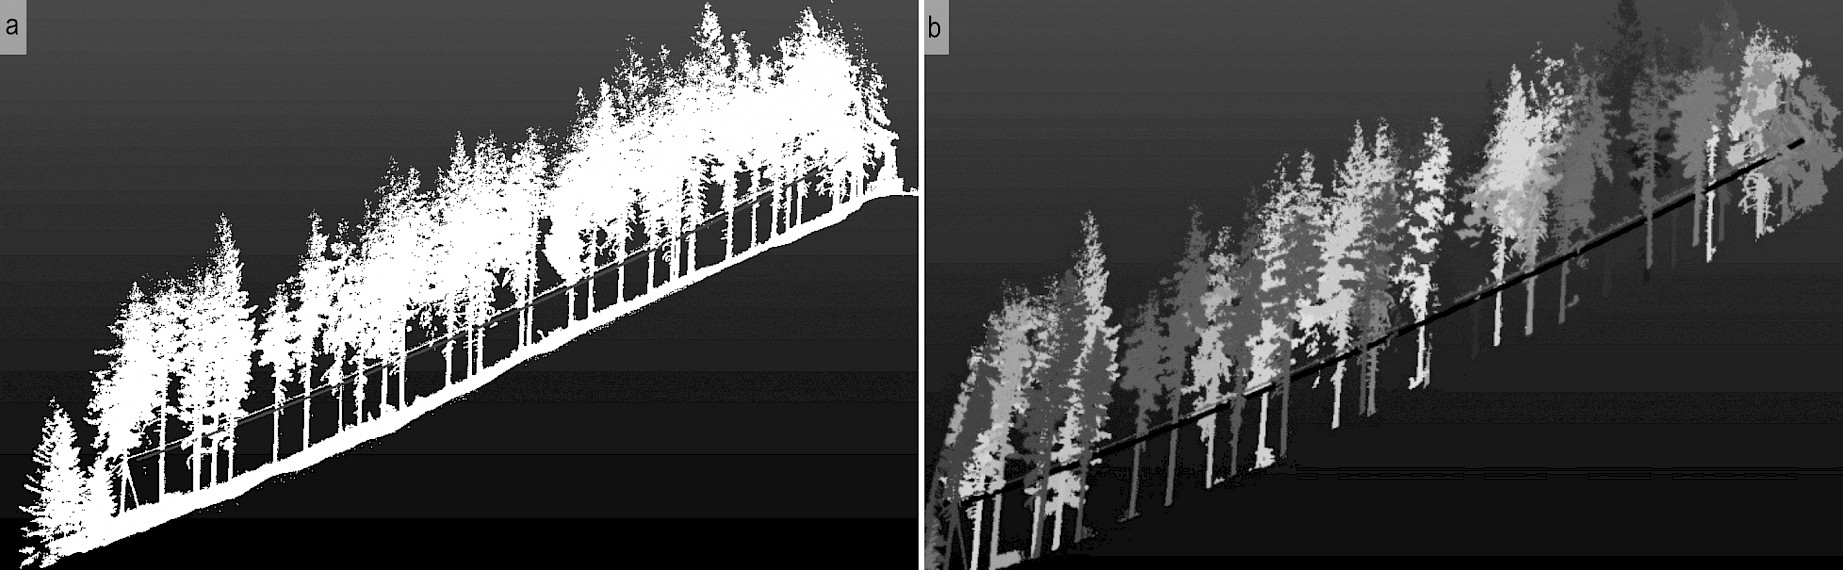
Fig. 3 a) Raw point cloud, b) Point cloud with segmented trees, each colour marks an individual tree
2.4 Reference Data and Accuracy of Tree Detection, DBH and Height Measurement
Reference data for the calculation of the accuracy of the tree detection and the DBH and height measurement was collected via a terrestrial handheld scan of both stands with the GeoSLAM ZEB HORIZON. To enable easy comparison of the hand-held scans and the carriage-based scans, 12 plastic spheres with a diameter of 200 mm mounted on tripods were installed as reference targets for each cable corridor. The hand-held generated point clouds were rotated and translated to the coordinate system of the carriage-based system via the coordinates of the reference spheres using CloudCompare v2.10.2. The final alignment of the tree positions from the ground truth hand-held scans to the carriage-based reference coordinates was performed using the function pppdist() in the R package spatstat (Baddeley and Turner 2005). With the help of the correctly referenced hand-held point cloud, a preliminary stem map was generated using algorithms from Gollob et al. (2020b) to check the automatically recorded tree positions with its true counterparts in the field. In addition, tree species was recorded, and reference DBHs and heights were manually measured. Trees were recorded if their DBH (measured in direction to the slope line with calipers in 1.3 m height) was greater than or equal to a lower threshold of 5 cm. New trees that had not been captured in the preliminary stem map were added manually via the measurement of distances and angles to two other known tree positions. Tree heights were manually measured on a subsample of 243 randomly selected trees using a Vertex IV (Haglöf Sweden AB, Långsele, Sweden).
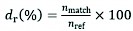
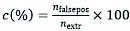
The accuracy of the automatic tree detection was evaluated according to Gollob et al. (2020b) and by using the following measures: tree detection rate dr(%), commission error c(%), and overall accuracy acc(%). These were calculated as follows:
 (1)
(1)
 (2)
(2)
 (3)
(3)
Where:
nmatch is the number of correctly found reference trees
nref is the total number of reference trees
nfalsepos is the number of tree positions that could not be assigned to an existing tree in the ground truth data
nextr is the number of automatically detected tree positions (nmatch+nfalsepos) and
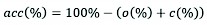
o(%) is the omission error defined as 100% – dr(%).
The detection rate dr(%) measures the proportion of correctly detected tree locations, the commission error c(%) measures the proportion of falsely detected tree locations, and the overall accuracy acc(%) is a combination of the latter two metrics and represents a global quality criterion.
The accuracy and precision of the automatic DBH and height measurements were assessed according to Gollob et al. (2020b) and by means of the root mean square error (RMSE) and bias. RMSE and bias were calculated based on the deviation between the automatic measurement i and the corresponding reference measurement yi:
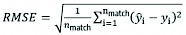 (4)
(4)
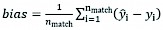 (5)
(5)
In order to examine whether and to what extent the accuracy of the automatic tree detection and the accuracy and precision of the DBH and height measurements were influenced by the distance of a tree to the skyline, the performance measures described above were assessed for a distance ranging from 0 to 30 m. The performance measures were calculated for all 4 scan variants in both stands:
- summarized across all cable corridors per stand
- as well as separately for the different corridors.
3. Results
3.1 Detection of Tree Positions
The analysis of the scanned cable corridors in stand 1 and stand 2 showed that the detection rate over all scan variants strongly depends on the distance from the trees to the skyline (Fig. 4). The detection rates decreased with increasing distance. This decrease occurred earlier and more steeply for the less intensive scan variants (variant 2–4) compared to variant 1. In general, the detection rates of scan variants with scanning during only the uphill movement (variant 3 and 4) and/or a fast carriage speed (variant 2 and 4) have lower detection rates than their counterparts with a scanning during the movement along both directions (variant 1 and 2) and/or a slow carriage speed (variant 1 and 3). Scan variant 4 (fast uphill) had the lowest detection rates and the steepest decrease of the detection functions. A comparison of stand 1 and stand 2 showed a similar range of detection rates over all scan variants. The decrease of detection rates had a similar pattern in both stands. In general, the detection rates of the different scan variants (with the exception of variant 4 in stand 2) were similar for tree distances shorter than 5 m but showed a higher variance for longer distances. Considering the detection rates at distances of 5 m, 10 m, 15 m, 20 m, 25 m and 30 m, variant 1 showed on average the highest values for both stands. The detection rates with scan variant 1 in stand 1 were 94.34%, 95.44 %, 90.29%, 81.47%, 70.23% and 56.95%, respectively. The detection rates with scan variant 1 in stand 2 were 94.97%, 92.16 %, 86.18%, 79.63%, 70.73% and 59.99%, respectively. A map of correctly found, missed, and falsely detected trees can be found in Appendix A, Fig. A1 and Fig. A2 for stand 1 and in Fig. A3 – Fig. A5 for stand 2. For further details on the detection rates of each individual cable corridor, the reader is referred to Appendix A, Fig. A6. In addition, Table A1 shows the average detection rates over all cable corridors and Table A2 shows the detection rates for each individual cable corridor for 5 m, 10 m, 15 m, 20 m, 25 m and 30 m distance.
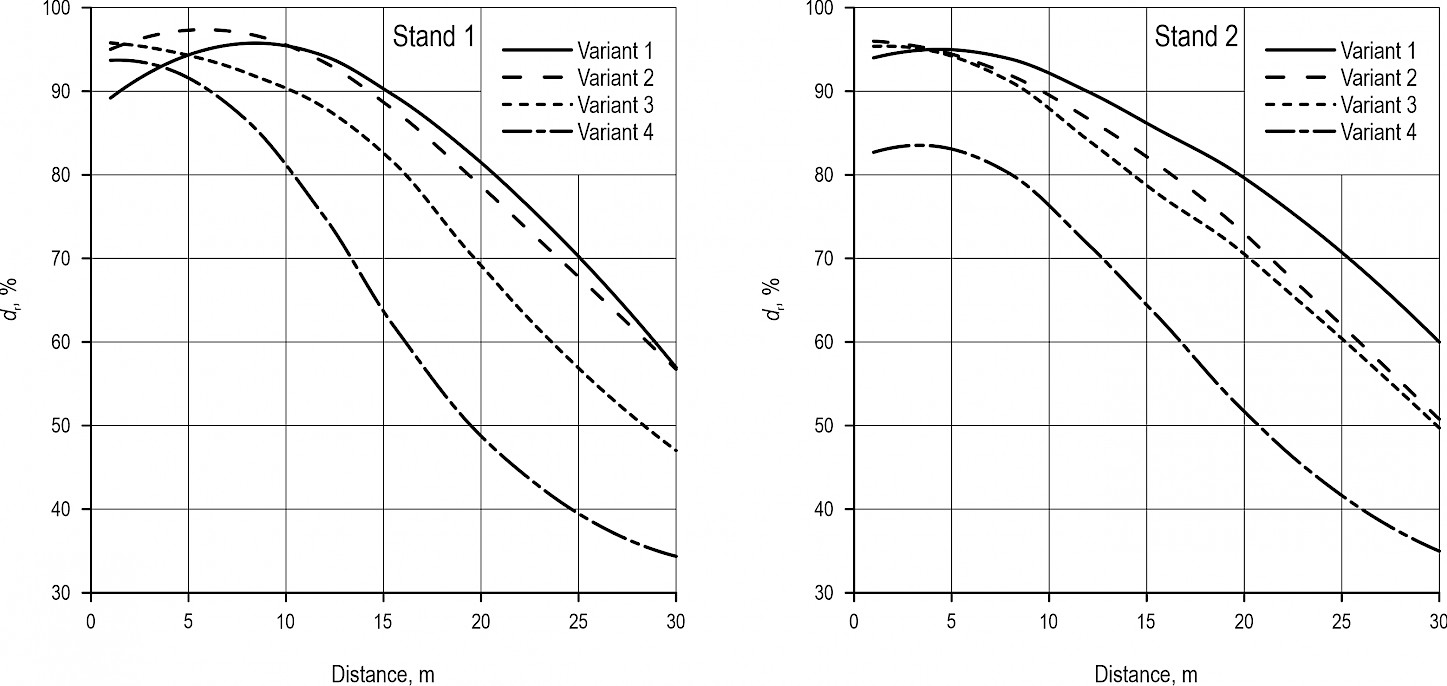
Fig. 4 Detection rates of different scan variants over distance from skyline
The proportion of falsely detected trees (commission error c(%)) decreased with an increasing distance of the trees from the skyline (Fig. 5). The commission error differed only slightly among scan variants, especially for tree distances longer than 8 m, and significant differences only occurred for shorter distances. In general, stand 1 and stand 2 had a similar range and pattern of commission errors over all scan variants. While stand 1, variant 1 (slow downhill/uphill) had the highest commission errors, stand 2 had the highest errors in variant 3 (slow uphill). Using distances of 5 m, 10 m, 15 m, 20 m, 25 m and 30 m, the commission errors with scan variant 4 in stand 1 were 1.52%, 0.58%, 0.52%, 0.49%, 0.49% and 0.51%, respectively. The commission errors with scan variant 2 in stand 2 were 1.62%, 0.98%, 0.72%, 0.62%, 0.59% and 0.62%, respectively. A map of correctly found, missed, and false found trees can be found in Appendix A, Fig. A1 and Fig. A2 for stand 1 and in Fig. A3 – Fig. A5 for stand 2. For further details on the commission errors of each individual cable corridor, the reader is referred to Appendix A, Fig. A7. In addition, Table A3 shows the average commission errors over all cable corridors and Table A4 shows the commission errors for each individual cable corridor for 5 m, 10 m, 15 m, 20 m, 25 m and 30 m distance.
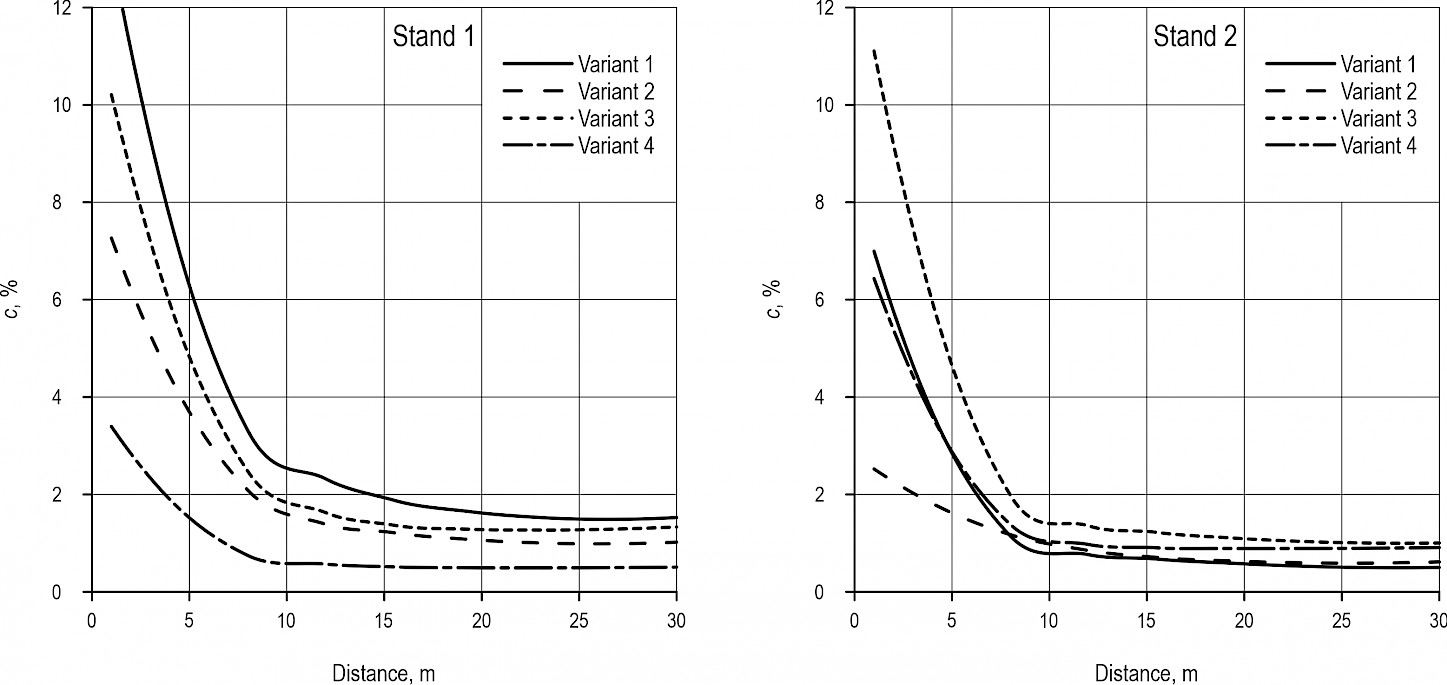
Fig. 5 Commission errors of different scan variants over distance from skyline
Overall accuracy rates (acc(%)), as a summary quality criterion of both the detection and the commission rates, are presented in Fig. 6. Overall accuracies showed a similar curve progression to the detection rate depending on the distance of the trees to the skyline. Variant 2 (fast downhill/uphill) showed on average the highest acc values in stand 1 and the variant 1 (slow downhill/uphill) in stand 2. Using distances of 5 m, 10 m, 15 m, 20 m, 25 m and 30 m, the overall accuracies with scan variant 2 in stand 1 were 93.56%, 94.00%, 87.57%, 77.81%, 67.11% and 56.17%, respectively. The detection rates with scan variant 1 in stand 2 were 92.12%, 91.45%, 85.60%, 79.19%, 70.36% and 59.68%, respectively. For further details on the overall accuracies of each individual cable corridor, the reader is referred to Appendix A, Fig. A8. In addition, Table A5 shows the average overall accuracies over all cable corridors and Table A6 shows the overall accuracies for each individual cable corridor for 5 m, 10 m, 15 m, 20 m, 25 m and 30 m distance.
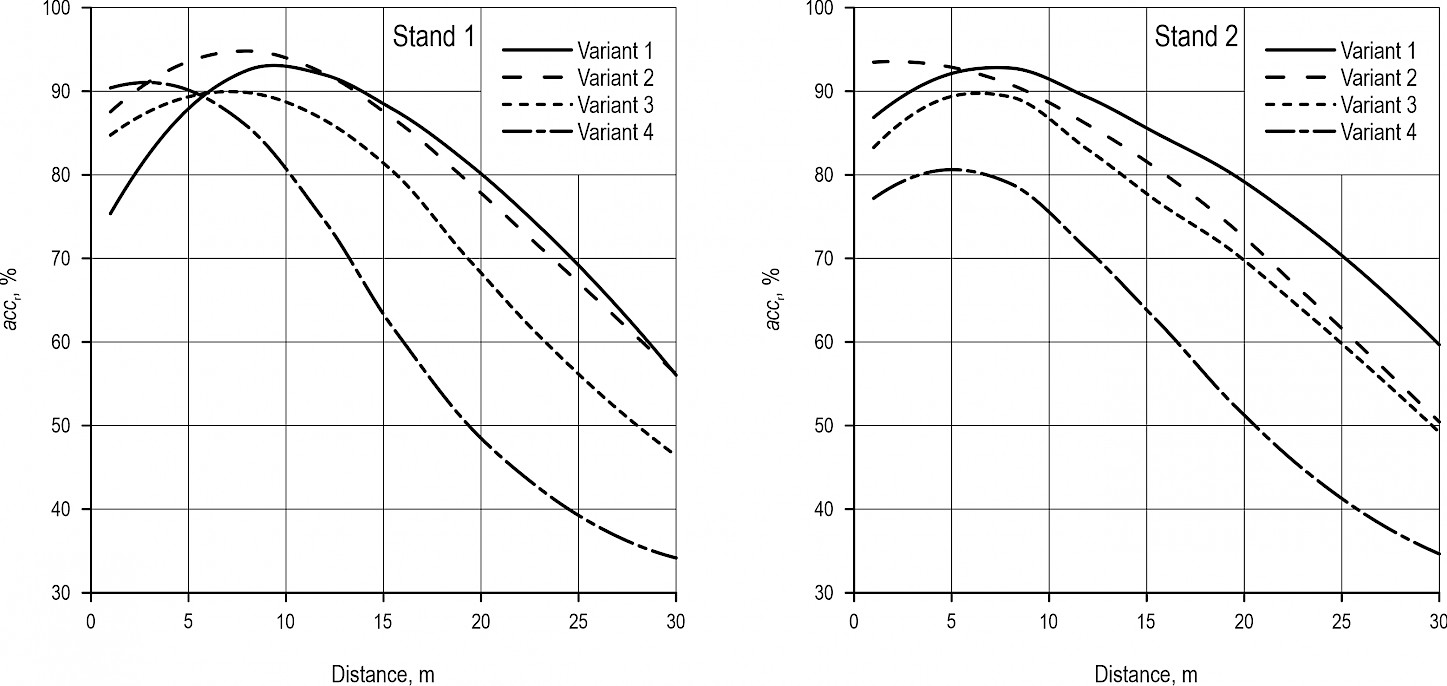
Fig. 6 Overall accuracies of different scan variants over distance from skyline
3.2 Estimation of DBH
The RMSE and bias of the automatic DBH estimation is outlined in Fig. 7 and Fig. 8, respectively. It turned out that, with increasing distance to the skyline, both RMSE and absolute bias increase. In addition, scan variants with a single scan during one direction (variant 3 and 4) and/or faster speed (variant 2 and 4) generally showed a higher RMSE and bias compared to their counterparts. RMSE and bias showed a similar increase in both stands. However, the errors in stand 2 are about 50 to 100% higher compared to stand 1. RMSE and bias also have a stronger increase over the distance in stand 2 compared to stand 1. Comparing the scan variants, average RMSE and bias over the distances of 5 and 10 m were the smallest for variant 1. Using distances of 5 m, 10 m, 15 m, 20 m, 25 m and 30 m, the RMSE with scan variant 1 in stand 1 was 1.47 cm, 1.59 cm, 1.90 cm, 2.25 cm, 2.38 cm and 2.33 cm, respectively. The bias with scan variant 1 in stand 1 was –0.08 cm, –0.10 cm, –0.17 cm, –0.23 cm, –0.25 cm and –0.24 cm, respectively. Using distances of 5 m, 10 m, 15 m, 20 m, 25 m and 30 m, the RMSE with scan variant 1 in stand 2 was 2.02 cm, 2.23 cm, 2.86 cm, 3.56 cm, 4.18 cm and 4.74 cm, respectively. The bias with scan variant 1 in stand 2 was 0.16 cm, 0.24 cm, 0.11 cm, –0.19 cm, –0.52 cm and –0.82 cm, respectively. For further details on RMSE and bias of each individual cable corridor, the reader is referred to Appendix B, Fig. B1 and Fig. B2, respectively. In addition, Tables B1 and B2 show the average RMSE and bias over all cable corridors, respectively. Tables B3 and B4 show the RMSE and bias for each individual cable corridor for 5 m, 10 m, 15 m, 20 m, 25 m and 30 m distance.
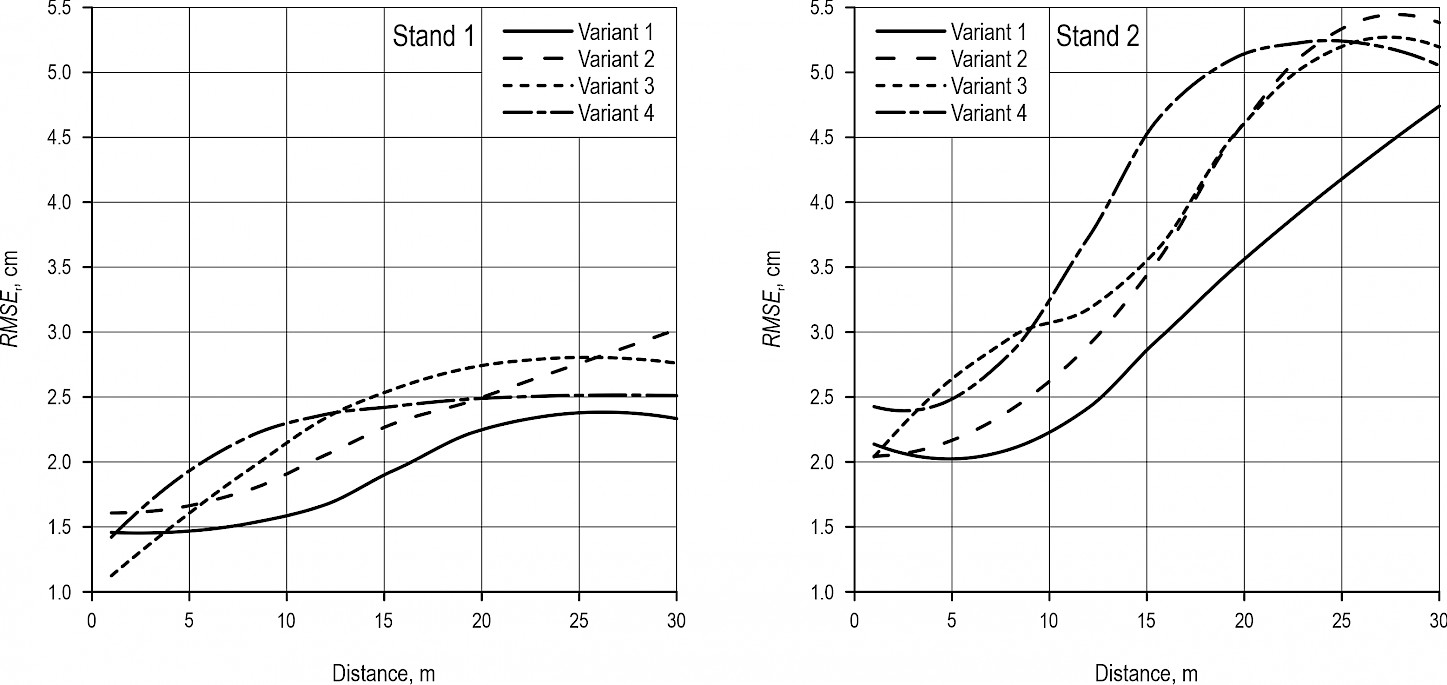
Fig. 7 RMSE of DBH estimation for different scan variants over distance from skyline
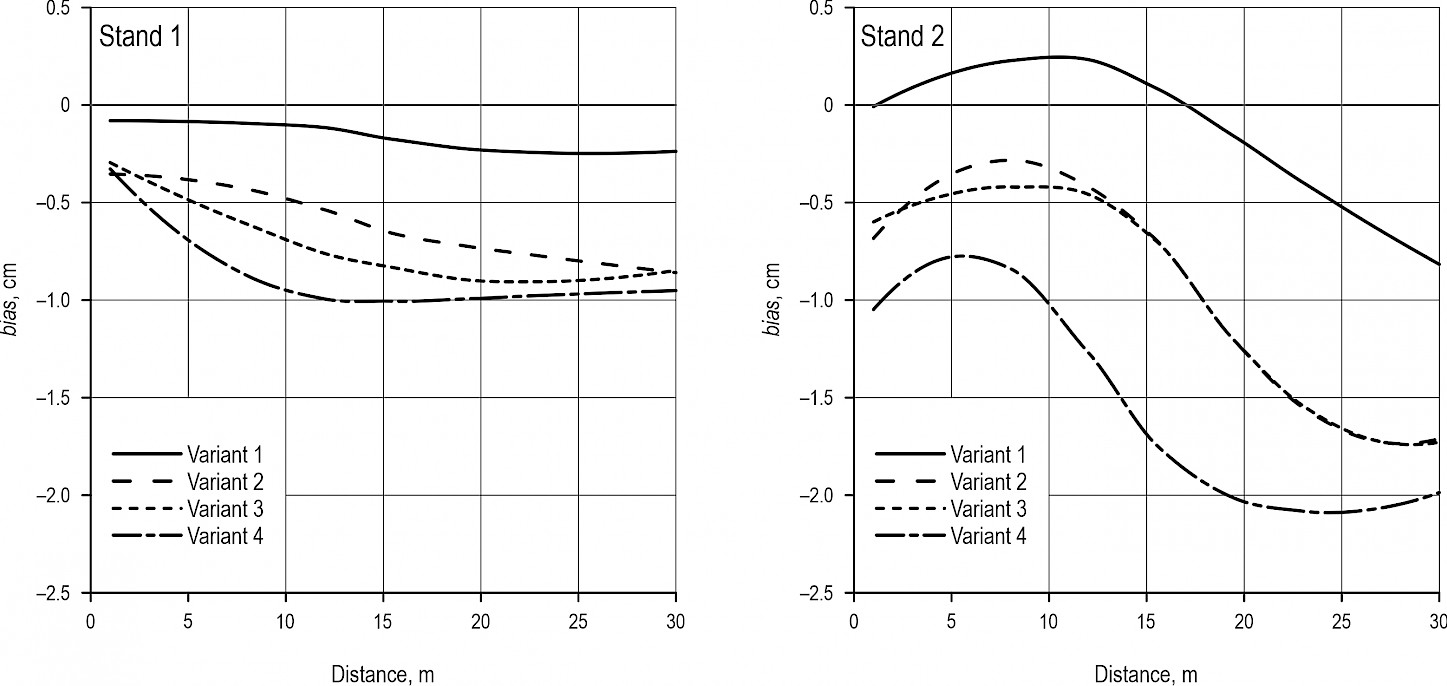
Fig. 8 bias of DBH estimation for different scan variants over distance from skyline
3.3 Estimation of Height
The RMSE and bias values of tree height estimation are given in Fig. 9 and Fig. 10, respectively. While for stand 1 the RMSE and bias were approximately stable over the distance range, stand 2 showed an increasing RMSE and bias for distances smaller than 8 m. For longer distances, the values became constant again. In general, scan variants with a fast speed (variant 2 and 4) showed a higher RMSE and bias compared to their counterparts. The errors in stand 2 are about 50% higher compared to stand 1. Comparing the scan variants, average RMSE and bias over the distances of 5 m, 10 m, 15 m, 20 m, 25 m and 30 m were the smallest for variant 1 (with exception of the bias in stand 1 – best variant: variant 3). Using distances of 5 m, 10 m, 15 m, 20 m, 25 m and 30 m, the RMSE with scan variant 1 in stand 1 was 3.03 m, 2.94 m, 3.19 m, 3.44 m, 3.66 m and 3.86 m, respectively. The bias with scan variant 3 in stand 1 was –0.85 m, –0.89 m, –1.23 m, –1.41 m, –1.47 m and –1.43 m, respectively. Using distances of 5 m, 10 m, 15 m, 20 m, 25 m and 30 m, the RMSE with scan variant 1 in stand 2 was 5.81 m, 4.63 m, 4.60 m, 4.46 m, 4.38 m and 4.41 m, respectively. The bias with scan variant 1 in stand 2 was –1.38 m, –1.18 m, –1.45 m, –1.39 m, –1.49 m and –1.61 m, respectively. For further details on RMSE and bias of each individual cable corridor, the reader is referred to Appendix C, Fig. C1 and Fig. C2, respectively. In addition, Tables C1 and C2 show the average RMSE and bias over all cable corridors, respectively. Tables C3 and C4 show the RMSE and bias for each individual cable corridor for 5 m, 10 m, 15 m, 20 m, 25 m and 30 m distance.
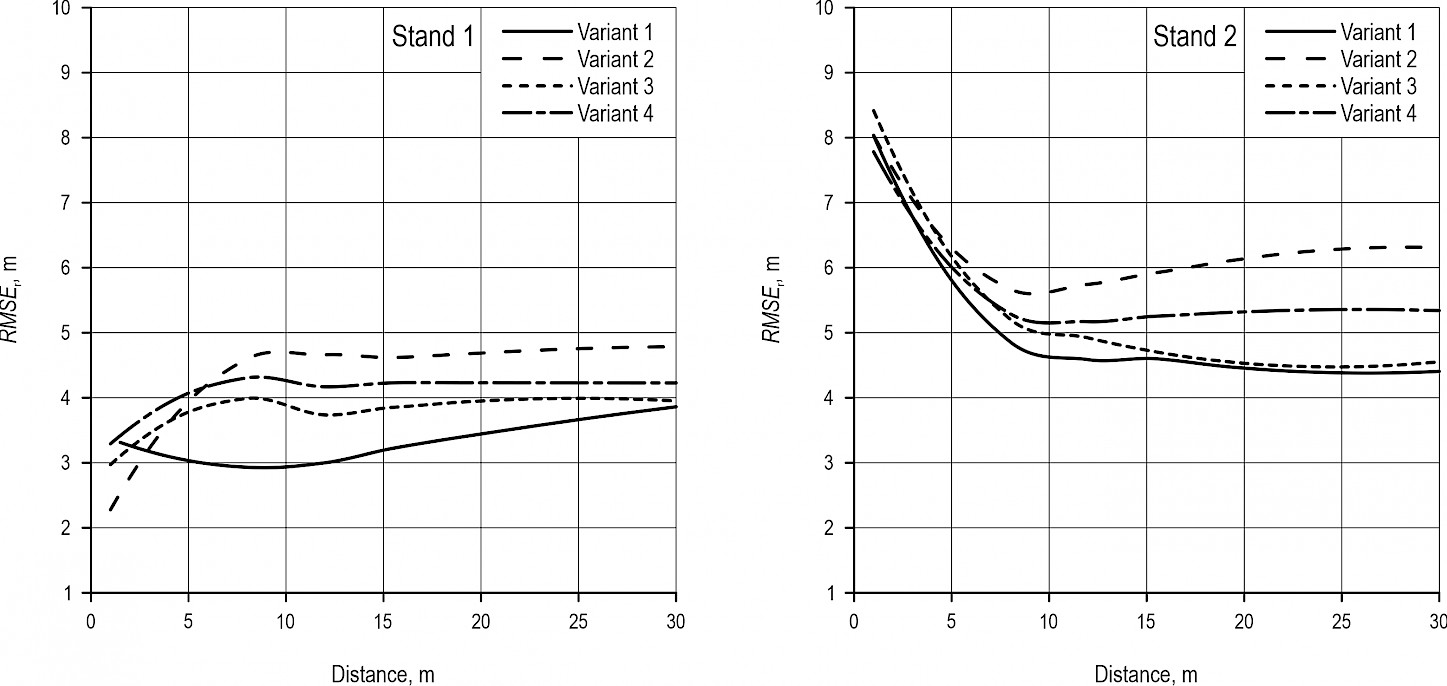
Fig. 9 RMSE of height estimation for different scan variants over distance from skyline
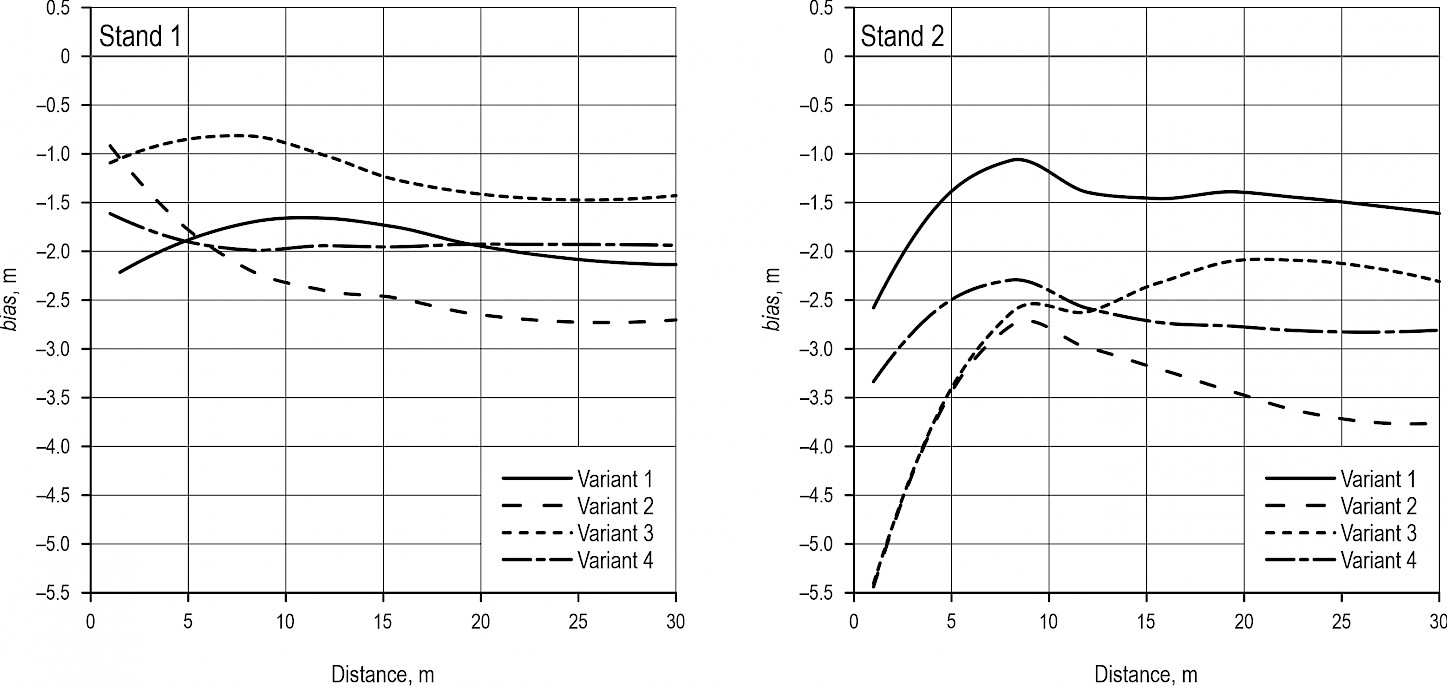
Fig. 10 Bias of height estimation for different scan variants over distance from skyline
4. Discussion
The presented methods for the estimation of individual tree parameters from carriage-based laser scanning data proved to be robust and provided high flexibility under different forest structure scenarios, different cable corridors and scan variants. Single tree parameters were successfully estimated from all existing point clouds. However, scan data could not be processed to point clouds via SLAM on three occasions out of a total of 32 (cable corridor 1 variant 1, cable corridor 2 variant 2, cable corridor 4 variant 3). This is certainly due to the fact that the GeoSLAM ZEB HORIZON scanner used in this study is not designed for applications like this, as it is sensitive to vibrations and especially abrupt shocks. Additional limitations of the scanner are discussed below.
It is important to mention that tree detection, DBH- and height estimation algorithms used in this study were developed and trained based on experimental stands and forest inventory sample plots for forest inventory applications (Ritter et al. 2017, Gollob et al. 2020b, Tockner et al. 2022). It turned out that the routines with the same constant parameter setting were also very suitable for the analysis of carriage-based point clouds, but could of course be optimized for the carriage-based laserscanning data in future experiments.
Regarding individual tree detection and DBH estimation, algorithm performance clearly depended on the distance between the trees and skyline. In general, the detection rate and overall accuracy decreased with increasing distance, while RMSE and bias of the DBH estimates increased with increasing distance. In contrast, tree height estimation was basically unaffected by the distance between the tree and skyline.
Several studies, especially in the context of single scan mode in terrestrial laser scanning in forest inventories (Ducey and Astrup 2013, Astrup et al. 2014, Kershaw et al. 2016, Liang et al. 2016) or scanning with vehicles on roads (Bienert et al. 2021, Pires et al. 2022), likewise confirm the results of this study in terms of distance dependency. As was found in Kankare et al. (2016), the main problem of terrestrial laser scanning data from single scan positions or scans from single straight lines is that the point density decreases with the distance to the scanner. The effect of decreasing point density in this study layout was mainly influenced by the number of movements and the speed of the carriage. Thus, scan variant 1 (slow downhill/uphill) and scan variant 2 (fast downhill/uphill) have about twice the point density compared to their counterparts (only uphill). The influence of carriage speed is similar, so scan variant 1 (slow downhill/uphill) and scan variant 3 (slow uphill) also have significantly higher point densities than their counterparts. Further, it is a fact that the completeness of the point cloud decreases with increasing distance to the scanner/carriage and that occlusion effects due to trees occur ever more frequently. The scanner simply cannot collect 3D data at a certain angle behind a tree. Consequently, trees further away from the skyline had lower point densities and were only partially captured in terms of their 3D shape. As a result, the tree detection algorithm increasingly missed trees, the DBH estimates were imprecise due to incomplete stem cross-sections, and the height estimates were imprecise due to incomplete tree crowns. An example of stem cross-sections for variant 2 over an increasing distance to the skyline can be found in Fig. 11. An example of whole trees and especially crowns for variant 2 over an increasing distance to the skyline is presented in Fig. 12.
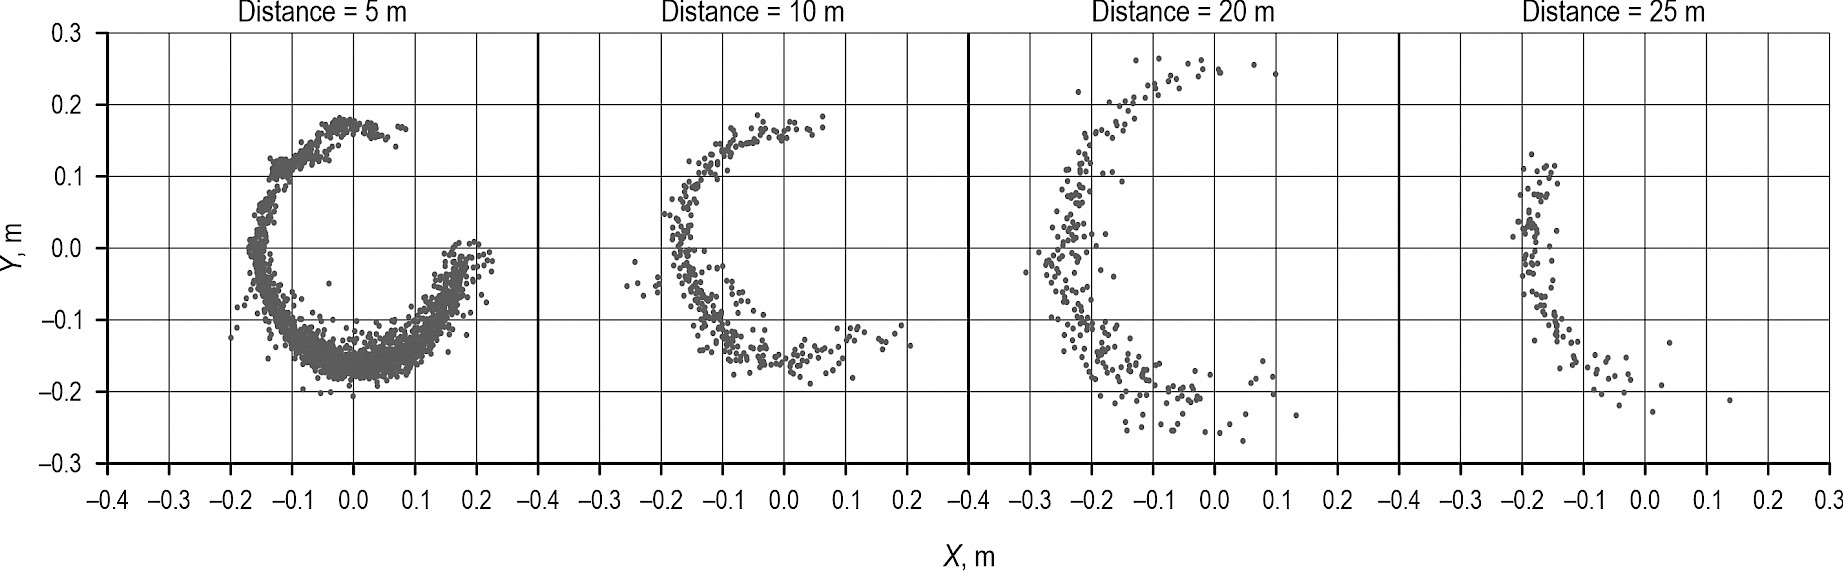
Fig. 11 Stem cross-sections (variant 2) for different distances from skyline

Fig. 12 Individual tree profiles (variant 2) for different distances from skyline
The distance sampling framework (Buckland et al. 2001, Buckland et al. 2004) principally allows for the correction of distance-depending non-detection. It has been succesfully used to model the number of undetected trees (Ducey and Astrup 2013, Astrup et al. 2014, Ritter et al. 2020) in laser scanning applications, as well as the undetected basal area (Ritter et al. 2013) and the undetected volume (Ritter and Saborowski 2012, Ritter and Saborowski 2014) in conventional forest inventory applications. However, only overall stand charateristics (e.g. number of trees per ha, basal area per ha and volume per ha) can be corrected with this approach, while parameters of individual missed trees (e.g. tree position, DBH, and height) cannot be assesed. A reconstruction of the point pattern formed by the tree positions would allow for the assesment of individual missed tree positions, and some studies have already sucessfully adressed this issue in the conventional forest inventoty context (Nothdurft et al. 2010, Bäuerle and Nothdurft 2011). However, for the assessment of DBH and height of individual missed trees, point pattern marks need to be reconstructed; to our best current knowledge this issue has not been adressed in any forest related context yet.
The partly high commission errors, RMSE and bias at small distances up to approx. 5 m, are mainly computationally due to a small divisor (see eq. 1, 2, 4 and 5). There were relatively few trees in the neighborhood of the skyline, which means that even small deviations in tree detection and DBH and height estimation have a strong effect on the accuracy and precision measures.
Across all cable corridors and stands, scan variant 1 (slow downhill/uphill) was superior in terms of estimating single tree parameters. Different coridor spacings are typically used, depending on the extraction method. A corridor spacing of 20 m is typically used in case timber is extracted as whole trees, while a corridor spacing of 30 m is typically used in case of the cut-to-length method (Heinimann et al. 2001). Application in harvesting operations would thus require monitoring of 10 to 15 m (half the distance between individual corridors) to the left and right of the corridor. Within this range of distances, 95.44% and 90.29% of the trees could be correctly detected in stand 1. The respective detection rates in stand 2 were 92.16% und 86.18%. The RMSE of DBH was 1.59 cm and 1.90 cm in stand 1 and 2.23 cm and 2.86 cm in stand 2, respectively. The RMSE of the height was 2.94 m and 3.19 m in stand 1 and 4.63 m and 4.60 m in stand 2, respectively. The poorer performance in stand 2 can be explained mainly by the larger tree dimensions. Due to the larger diameters and larger crowns, there were more occlusion effects and lower point densities with increasing distance. These results are in line with Bienert et al. (2021) (car-mounted mobile laser scanning system), who had the following detection rates as a function of distance from the scanner: 97.1% at 7.7 m distance, 97.0% at 14.3 m distance, 94.0% at 16.8 m distance, and 80.4% at 21.5 m distance. Regarding RMSE of DBH estimation, Bienert et al. (2021) found 3.40 cm in 0 to 20 m distance range and 4.80 cm in 20 to 40 m distance range. Regarding height, the RMSE was 3.12 m in 0 to 20 m distance and 4.11 m in 20 to 40 m distance.
Gollob et al. (2020b) found that small trees with DBH below 15 cm were more often missed than large trees in laser scanning based forest inventories. Fortunately, the total volume of usable timber remains relatively uneffected by this, as the small trees only contribute little to the total volume. The evaluation of the carriage-based laser scanning results from this study was based on manually collected field measurements. DBH estimates obtained from heights other than 1.3 m may provide inaccurate results for laser based estimates and manually calipered reference diameters; these may be due to an imperfect DTM or measuring errors in the field, respectively.
Irregular stems can cause errors in the measured diameter when using calipers due to the direction of measurement (Witzmann et al. 2022). Errors can also easily occur during manual height measurement due to poorly visible crown tops or tilted trees. Another source of error is that manual measurements are still often recorded with pencils on paper and then manually transcribed into electronic data bases (also in this study).
In order to fully exploit the potential of IT systems in the application of timber harvesting, it is important to provide systems that are capable of interpreting and evaluating data autonomously (Gallo et al. 2021). The results of the present study showed that it is possible to collect 3D information of the surrounding forest stand with a laser scanner mounted on a cable yarder carriage. Furthermore, the 3D data could be automatically analyzed, and accurate and precise standing tree variables could be calculated. However, Veal et al. (2001) stated that the goal for digital forestry must be to develop systems that will simultaneously acquire, process, evaluate and share data in the supply chain. This is only partially covered by this study and requires further research, hardware and software development. Developing a fully autonomous carriage-based laser scanning system with simultaneous data acquisition and processing is challenging, and the GeoSLAM ZEB HORIZON scanner used in this study is not designed for such an application, as it is sensitive to vibrations and especially abrupt shocks, which also led to 3 erroneous data acquisitions in this study (cable corridor 1 variant 1, cable corridor 2 variant 2, cable corridor 4 variant 3). Weather resistance, remote control, wireless data transfer and on-the-fly SLAM were also not available. Furthermore, the scanner was relatively expensive with acquisition costs of around € 50,000. This currently limits the use of such a system in operational cable yarding. However, there are already newer hardware and software solutions to face these challenges (Buratowski et al. 2022, Liu et al. 2022) that may also be suitable for carriage-based laser scanning. Also, the algorithms for point cloud analysis are currently too slow for an operational near simultaneous data flow. One scan variant of a cable corridor currently requires about 3 h of computation time on a notebook with 64 GB main memory and an i7-8750H hexa core CPU (Intel Corp., Santa Clara, CA, U.S.A.) to estimate the single tree parameters. More efficient programming languages, more powerful computers, cloud computing but also more efficient program code could drastically reduce this time in the future. Regardless of this, the scanner must be appropriately integrated into the carriage and protected from obstacles and vibrations. This could be done, for example, following Gallo and Mazzetto (2013), who protected a GPS antenna on a carriage with a plastic box with layers of foam. Of course, a compromise between protection and limitation of the scanner field of view has to be found. The carriage speed of scan variant 4 (fast uphill), at 1.13 m/s, was the fastest in this study. Compared to the current state of the art in carriage technology with speeds of up to 12 m/s (most common 3–4 m/s), this was very slow. Performance at higher speeds still needs to be tested. It may be necessary to use scanning systems with higher data acquisition rates to get enough 3D points on the environment. Another option is to perform separate slow scans at the beginning, at the end and in between the operational work with the yarder.
Individual tree data derived from carriage-based laserscanning could also be used to provide the processor operator with a suggestion for value-optimized bucking, as demonstrated by Erber et al. (2022) for motor-manual bucking operations, thus enabling to back-link log with tree data and provide a point of origin for downstream products. In addition, removed and remaining tree data could be used to update the owner’s forest management plan or digital twins of the forest (Rossmann et al. 2009). This study represents a first step towards the digitization of cable yarding with regard to the measuring of standing tree variables in the forest/timber supply chain. Based on this, further important developments can then be undertaken to increase efficiency, improve interfaces and digital data flow. In this sense, the entire point clouds, application videos, photos of the data acquisition, results and reference data of this study were published open access https://doi.org/10.5281/zenodo.7383032. This will allow other research groups to get a feel for the data, test and compare their own algorithms, or develop new algorithms.
5. Conclusions
The major goal of the present study was to investigate the performance of carriage-based laserscanning for estimation of individual tree parameters. Different scan variants were applied, differing in carriage speed and direction of carriage movement. The results of the automatic algorithms were compared with manually collected reference data. It turned out that the scan variant 1, in which the scan was performed during slow carriage movement downwards and back upwards again, is advantageous. The results show that, with carriage-based laser scanning, more than 92% and 86% of the trees can be detected up to a distance of 10 m and 15 m, respectively. The RMSE of DBH estimation was less than 2.23 cm and 2.86 cm up to a distance of 10 m and 15 m, respectively. The RMSE of the height estimation was less than 4.63 m and 4.60 m up to a distance of 10 m and 15 m, respectively. The results of this study can help to further advance the digitization of the timber flow from the standing tree to the sawmill. However, further hardware and software development steps need to be taken in order to be applicable in operational timber harvesting. Laserscanning technology represents the next step towards an efficient and modern monitoring and documentation in timber harvesting, especially in steep terrain. It is also expected that laser scanners will be more often used on forestry machines as soon as the currently developed programs are available, in terms of free software routines, and that the hardware costs will be lower.
Acknowledgments
This study was supported by the project SMARTSKY and was financed by the Austrian Federal Ministry of Agriculture, Regions and Tourism under project number 101680. The authors thank Mr. Hannes Gollob for giving access to his forest and machines used for data collection, as well as technical support of the study.
7. References
Astrup, R., Ducey, M.J., Granhus, A., Ritter, T. von Lüpke, N., 2014: Approaches for estimating stand-level volume using terrestrial laser scanning in a single-scan mode. Canadian Journal of Forest Research 44(6): 666–676. https://doi.org/10.1139/cjfr-2013-0535
Baddeley, A., Turner, R., 2005: spatstat: An R package for analyzing spatial point patterns. Journal of Statistical Software 12(6): 1–42. https://doi.org/10.18637/jss.v012.i06
Balenović, I., Liang, X., Jurjević, L., Hyyppä, J., Seletković, A., Kukko, A., 2020: Hand-held personal laser scanning – current status and perspectives for forest inventory application. Croatian Journal of Forest Engineering 42(1): 165–183. https://doi.org/10.5552/crojfe.2021.858
Bäuerle, H., Nothdurft, A., 2011: Spatial modeling of habitat trees based on line transect sampling and point pattern reconstruction. Canadian Journal of Forest Research 41(4): 715–727. https://doi.org/10.1139/x11-004
Bienert, A., Georgi, L., Kunz, M., von Oheimb, G., Maas, H.-G., 2021: Automatic extraction and measurement of individual trees from mobile laser scanning point clouds of forests. Annals of Botany 128(6): 787–804. https://doi.org/10.1093/aob/mcab087
Borz, S.A., Cheţa, M., Bîrda, M., Proto, A.R., 2022: Classyfing Operational Events in Cable Yarding by a Machine Learning Application to GNSS-Collected Data: A Case Study on Gravity-Assisted Downhill Yarding. Bulletin of the Transilvania University of Brasov, Series II: Forestry, Wood Industry, Agricultural Food Engineering 15(64) no. 1: 13–32. https://doi.org/10.31926/but.fwiafe.2022.15.64.1.2
Buckland, S.T., Anderson, D.R., Burnham, K.P., Laake, J.L., Borchers, D.L., Thomas, L., 2004: Advanced distance sampling: estimating abundance of biological populations. OUP Oxford.
Buckland, S.T., Anderson, D.R., Burnham, K.P., Laake, J.L., Borchers, D.L., Thomas, L., 2001: Introduction to distance sampling: estimating abundance of biological populations.
Buratowski, T., Garus, J., Giergiel, M., Kudriashov, A., 2022: Real-Time 3D Mapping in Isolated Industrial Terrain with Use of Mobile Robotic Vehicle. Electronics 11(13): 2086. https://doi.org/10.3390/electronics11132086
Clark, P.J., Evans, F.C., 1954: Distance to Nearest Neighbor as a Measure of Spatial Relationships in Populations. Ecology 35(4): 445–453. https://doi.org/10.2307/1931034
Ducey, M., Astrup, R., 2013: Adjusting for nondetection in forest inventories derived from terrestrial laser scanning. Canadian Journal of Remote Sensing 39(5): 410–425.
Erber, G., Gollob, C., Krassnitzer, R., Nothdurft, A., Stampfer, K., 2022: Stem-Level Bucking Pattern Optimization in Chainsaw Bucking Based on Terrestrial Laser Scanning Data. Croatian journal of forest engineering 43(2): 287–301. https://doi.org/10.5552/crojfe.2022.1596
Feng, Y., Audy, J.F., 2020: Forestry 4.0: A framework for the forest supply chain toward industry 4.0. Gestao e Producao 27(4): e5677. https://doi.org/10.1590/0104-530X5677-20
Fueldner, K., 1995: Strukturbeschreibung von Buchen-Edellaubholz-Mischwäldern. Georg-August-Universitaet Goettingen.
Gallo, R., Mazzetto, F., 2013: A methodology study for the application of Precision Forestry approach in logging operation chains. EFITA-WCCA-CIGR 2013 Conference »Sustainable Agriculture through ICT Innovation«, Turin, Italy.
Gallo, R., Visser, R., Mazzetto, F., 2021: Developing an Automated Monitoring System for Cable Yarding Systems. Croatian Journal 0f Forest Engineering 42(2): 213–225. https://doi.org/10.5552/crojfe.2021.768
Gollob, C., Ritter, T., Kraßnitzer, R., Tockner, A., Nothdurft, A., 2021: Measurement of Forest Inventory Parameters with Apple iPad Pro and Integrated LiDAR Technology. Remote Sensing 13(16): 3129. https://doi.org/10.3390/rs13163129
Gollob, C., Ritter, T., Nothdurft, A., 2020a: Comparison of 3D point clouds obtained by terrestrial laser scanning and personal laser scanning on forest inventory sample plots. Data 5(4): 103. https://doi.org/10.3390/data5040103
Gollob, C., Ritter, T., Nothdurft, A., 2020b: Forest Inventory with Long Range and High-Speed Personal Laser Scanning (PLS) and Simultaneous Localization and Mapping (SLAM) Technology. Remote Sensing 12(9): 1509. https://doi.org/10.3390/RS12091509
Gollob, C., Ritter, T., Wassermann, C., Nothdurft, A., 2019: Influence of Scanner Position and Plot Size on the Accuracy of Tree Detection and Diameter Estimation Using Terrestrial Laser Scanning on Forest Inventory Plots. Remote Sensing 11(13): 1602. https://doi.org/10.3390/rs11131602
Guerra, F., Marchi, L., Grigolato, S., Gallo, R., 2020: Indirect Payload Estimation in Cable-Logging Operations. Engineering for Rural Development, Jelgava 20 – 22 May, 1914–1919 p. https://doi.org/10.22616/ERDev.2020.19.TF537
Harrill, H., Visser, R., Raymond, K., 2019: New Zealand Cable Logging 2008–2018: a Period of Change. Current Forestry Reports 5(3): 114–123. https://doi.org/10.1007/s40725-019-00092-5
Heinimann, H.R., Stampfer, K., Loschek, J., Caminada, L., 2001: Perspectives on central European cable yarding systems. In: International Mountain Logging and 11th Pacific Northwest Skyline Symposium., 268–279 p.
Holzinger, A., Saranti, A., Angerschmid, A., Retzlaff, C.O., Gronauer, A., Pejakovic, V., Medel-Jimenez, F., Krexner, T., Gollob, C., Stampfer, K., 2022. Digital Transformation in Smart Farm and Forest Operations Needs Human-Centered AI: Challenges and Future Directions. Sensors 22(8): 3043. https://doi.org/10.3390/s22083043
Kankare, V., Puttonen, E., Holopainen, M., Hyyppä, J., 2016: The effect of TLS point cloud sampling on tree detection and diameter measurement accuracy. Remote Sensing Letters 7(5): 495–502. https://doi.org/10.1080/2150704X.2016.1157639
Keefe, R.F., Zimbelman, E.G., Picchi, G., 2022: Use of Individual Tree and Product Level Data to Improve Operational Forestry. Current Forestry Reports 8(2): 148–165. https://doi.org/10.1007/s40725-022-00160-3
Kershaw, J.A., Ducey, M.J., Beers, T.W., Husch, B., 2016: Forest Mensuration. Chichester, UK: John Wiley & Sons, Ltd. 613 p. https://doi.org/10.1002/9781118902028
Liang, X., Kankare, V., Hyyppä, J., Wang, Y., Kukko, A., Haggrén, H., Yu, X., Kaartinen, H., Jaakkola, A., Guan, F., Holopainen, M., Vastaranta, M., 2016: Terrestrial laser scanning in forest inventories. ISPRS Journal of Photogrammetry and Remote Sensing 115: 63–77. https://doi.org/10.1016/j.isprsjprs.2016.01.006
Liang, X., Kukko, A., Balenovic, I., Saarinen, N., Junttila, S., Kankare, V., Holopainen, M., Mokroš, M., Surový, P., Kaartinen, L., Honkavaara, E., Näsi, J., Hollaus, M., Tian, J., Yu, X., Pan, J., Cai, S., Virtanen, J.-P., Wang, Y., Hyyppä, J., 2022: Close-Range Remote Sensing of Forests: The state of the art, challenges, and opportunities for systems and data acquisitions. IEEE Geoscience and Remote Sensing Magazine 10(3): 32–71. https://doi.org/10.1109/MGRS.2022.3168135
Liu, X., Nardari, G.V., Ojeda, F.C., Tao, Y., Zhou, A., Donnelly, T., Qu, C., Chen, S.W., Romero, R.A.F., Taylor, C.J., Kumar, V., 2022: Large-Scale Autonomous Flight with Real-Time Semantic SLAM under Dense Forest Canopy. IEEE Robotics and Automation Letters 7(2): 5512–5519. https://doi.org/10.1109/LRA.2022.3154047
Mologni, O., Marchi, L., Lyons, K.C., Grigolato, S., Cavalli, R., Röser, D., 2021: Skyline Tensile Forces in Cable Logging: Field Observations vs. Software Calculations. Croatian Journal Of Forest Engineering 42(2): 227–243. https://doi.org/10.5552/crojfe.2021.722
Nothdurft, A., Saborowski, J., Nuske, R.S., Stoyan, D., 2010: Density estimation based on k-tree sampling and point pattern reconstruction. Canadian Journal of Forest Research 40(5): 953–967. https://doi.org/10.1139/X10-046
Pires, R. de P., Olofsson, K., Persson, H.J., Lindberg, E., Holmgren, J., 2022: Individual tree detection and estimation of stem attributes with mobile laser scanning along boreal forest roads. ISPRS Journal of Photogrammetry and Remote Sensing 187: 211–224. https://doi.org/10.1016/j.isprsjprs.2022.03.004
R Core Team 2016: R: A Language and Environment for Statistical Computing. Available at: https://www.r-project.org/
Reineke, L.H., 1933: Perfecting a stand-density index for evenage forests. Journal of Agricultural Research 46(7): 627–638.
Ritter, T., Gollob, C., Nothdurft, A., 2020: Towards an optimization of sample plot size and scanner position layout for terrestrial laser scanning in multi‐scan mode. Forests 11(10): 1099. https://doi.org/10.3390/f11101099
Ritter, T., Nothdurft, A., Saborowski, J., 2013: Correcting the nondetection bias of angle count sampling. Canadian Journal of Forest Research 43(4): 344–354. https://doi.org/10.1139/cjfr-2012-0408
Ritter, T., Saborowski, J., 2012: Point transect sampling of deadwood: A comparison with well-established sampling techniques for the estimation of volume and carbon storage in managed forests. European Journal of Forest Research 131(6): 1845–1856. https://doi.org/10.1007/s10342-012-0637-2
Ritter, T., Saborowski, J., 2014: Efficient integration of a deadwood inventory into an existing forest inventory carried out as two-phase sampling for stratification. Forestry 87(4): 571–581. https://doi.org/10.1093/forestry/cpu016
Ritter, T., Schwarz, M., Tockner, A., Leisch, F., Nothdurft, A., 2017: Automatic mapping of forest stands based on three-dimensional point clouds derived from terrestrial laser-scanning. Forests 8(8): 265. https://doi.org/10.3390/f8080265
Rodrigues, C.K., Lopes, E.D.S., Pereira, A.L.N., Sampietro, J.A., 2019: Effect of Individual Tree Volume on Operational Performance of Harvester Processor. Floresta 49(2): 345–352. http://dx.doi.org/10.5380/rf.v49i2.58233
Roßmann, J., Krahwinkler, P., Bücken, A., 2009: Mapping and navigation of mobile robots in natural environments. In: Advances in Robotics Research: Theory, Implementation, Application. Springer Verlag: 43–52. https://doi.org/10.1007/978-3-642-01213-6_5
Rossmann, J., Schluse, M., Schlette, C., 2009: The virtual forest: Robotics and simulation technology as the basis for new approaches to the biological and the technical production in the forest. In Proceedings of the 13th World Multi-Conference Conference on Systems, Cybernetics and Informatics, WMSCI: 43–48.
Ryding, J., Williams, E., Smith, M., Eichhorn, M., 2015: Assessing Handheld Mobile Laser Scanners for Forest Surveys. Remote Sensing 7(1): 1095–1111. https://doi.org/10.3390/rs70101095
Samset, I., 2013: Winch and cable systems. Springer Science \& Business Media.
Shannon, C.E., 1948: A Mathematical Theory of Communication. Bell System Technical Journal 27(3): 379–423. https://doi.org/10.1002/j.1538-7305.1948.tb01338.x
Tockner, A., Gollob, C., Kraßnitzer, R., Ritter, T., Nothdurft, A., 2022: Automatic tree crown segmentation using dense forest point clouds from Personal Laser Scanning (PLS). International Journal of Applied Earth Observation and Geoinformation 114: 103025. https://doi.org/10.1016/j.jag.2022.103025
Varch, T., Erber, G., Visser, R., Spinelli, R., Harrill, H., Stampfer, K., 2021: Advances in Cable Yarding: A Review of Recent Developments in Skyline Carriage Technology. Current Forestry Reports 7(4): 181–194. https://doi.org/10.1007/s40725-021-00150-x
Veal, M.W., Taylor, S.E., McDonald, T.P., McLemore, D.K., Dunn, M.R., 2001: Accuracy of tracking forest machines with GPS. Transactions of the ASAE 44(6): 1903. https://doi.org/10.13031/2013.6978)@2001
Visser, R., Harrill, H., 2017: Cable Yarding in North America and New Zealand: A Review of Developments and Practices. Croatian Journal of Forest Engineering 38(2): 209–217.
Witzmann, S., Matitz, L., Gollob, C., Ritter, T., Kraßnitzer, R., Tockner, A., Stampfer, K., Nothdurft, A., 2022: Accuracy and Precision of Stem Cross-Section Modeling in 3D Point Clouds from TLS and Caliper Measurements for Basal Area Estimation. Remote Sensing 14(8): 1923. https://doi.org/10.3390/rs14081923
© 2023 by the authors. Submitted for possible open access publication under the
terms and conditions of the Creative Commons Attribution (CC BY) license (http://creativecommons.org/licenses/by/4.0/).
Authors' addresses:
Christoph Gollob, PhD *
e-mail: christoph.gollob@boku.ac.at
Ralf Krassnitzer, MSc
e-mail: ralf.krassnitzer@boku.ac.at
Tim Ritter, PhD
e-mail: tim.ritter@boku.ac.at
Andreas Tockner, MSc
e-mail: andreas.tockner@boku.ac.at
Prof. Arne Nothdurft, PhD
e-mail: arne.nothdurft@boku.ac.at
University of Natural Resources and Life Sciences, Vienna
Department of Forest and Soil Sciences
Institute of Forest Growth
Peter Jordan Strasse 82
1190, Vienna
AUSTRIA
Gernot Erber, PhD
e-mail: gernot.erber@boku.ac.at
Martin Kühmaier, PhD
e-mail: martin.kühmaier@boku.ac.at
Ferdinand Hönigsberger, MSc
e-mail: ferdinand.hoenigsberger@boku.ac.at
Thomas Varch, MSc
e-mail: thomas.varch@boku.ac.at
Prof. Andreas Holzinger, PhD
e-mail: andreas.holzinger@boku.ac.at
Prof. Karl Stampfer, PhD
e-mail: karl.stampfer@boku.ac.at
University of Natural Resources and Life Sciences, Vienna
Department of Forest and Soil Sciences
Institute of Forest Engineering
Peter Jordan Strasse 82
1190, Vienna
AUSTRIA
* Corresponding author
Received: November 30, 2022
Accepted: March 30, 2023
Original scientific paper