Impact of Deforestation and Erosion on Some Soil Physicochemical Properties and Microbial Activity on Steep Slopes
doi: 10.5552/crojfe.2024.2311
volume: 45, issue: 2
pp: 13
- Author(s):
-
- Sensoy Huseyin
- Article category:
- Original scientific paper
- Keywords:
- degradation, gully erosion, microbial biomass, soil characteristics
Abstract
HTML
Deforestation and erosion are important indicators of the beginning of land degradation. This study aimed to present the changes in some physical, chemical, and microbial characteristics of the soil on sloping land on which deforestation has led to gully erosion. The study was conducted on dam slopes on which the forest cover had been removed, and gullies subsequently formed. Nine soil samples were taken from deforested and eroded slopes (SDE) and six soil samples were taken from slopes with forest vegetation (SF) for physical and chemical soil analysis. Thus, a total of 15 samples were taken from the study area to determine physical and chemical properties. To determine microbial biomass and activity, a total of 30 samples were taken from the same locations in duplicate. The results revealed that sand particles, bulk density, soil temperature, >2 mm/<2 mm fraction ratio, pH, and electrical conductivity increased markedly, whereas total porosity and organic carbon decreased (p≤0.05) in SDE soils. Moreover, it was found that the average organic carbon content of SDE soils decreased by more than five times compared to SF soils. Microbial biomass carbon and basal respiration in SDE and SF soils indicated a significant difference (p≤0.05). While the metabolic quotient indicated a marked difference (p≤0.05) between SDE and SF soils, the microbial quotient showed no significance (p>0.05). Furthermore, it was found that the most relevant physical and chemical soil characteristics of microbial biomass and activity were bulk density, pH, and organic carbon.
Impact of Deforestation and Erosion on Some Soil Physicochemical Properties and Microbial Activity on Steep Slopes
Huseyin Sensoy
Abstract
Deforestation and erosion are important indicators of the beginning of land degradation. This study aimed to present the changes in some physical, chemical, and microbial characteristics of the soil on sloping land on which deforestation has led to gully erosion. The study was conducted on dam slopes on which the forest cover had been removed, and gullies subsequently formed. Nine soil samples were taken from deforested and eroded slopes (SDE) and six soil samples were taken from slopes with forest vegetation (SF) for physical and chemical soil analysis. Thus, a total of 15 samples were taken from the study area to determine physical and chemical properties. To determine microbial biomass and activity, a total of 30 samples were taken from the same locations in duplicate. The results revealed that sand particles, bulk density, soil temperature, >2 mm/<2 mm fraction ratio, pH, and electrical conductivity increased markedly, whereas total porosity and organic carbon decreased (p≤0.05) in SDE soils. Moreover, it was found that the average organic carbon content of SDE soils decreased by more than five times compared to SF soils. Microbial biomass carbon and basal respiration in SDE and SF soils indicated a significant difference (p≤0.05). While the metabolic quotient indicated a marked difference (p≤0.05) between SDE and SF soils, the microbial quotient showed no significance (p>0.05). Furthermore, it was found that the most relevant physical and chemical soil characteristics of microbial biomass and activity were bulk density, pH, and organic carbon.
Keywords: degradation, gully erosion, microbial biomass, soil characteristics
1. Introduction
Soil erosion indicates not only the loss of topsoil but is also a process that leads to many undesirable phenomena, such as land degradation (Shi et al. 2018, Wen and Zhen 2020), loss of soil nutrients (Ranjan et al. 2021, Zhao et al. 2022a), and pollution of water resources (Owens 2020). Even if restoration practices are performed in an area that has somehow been degraded, it requires 30 years or more to restore microbial biomass (MB) and communities in natural vegetation (Bai et al. 2020, Sanji et al. 2020). Similarly, the levels of soil organic carbon (SOC) content may also be moderate and low even after years of erosion control practices (Zhang et al. 2020). Not only erosion but also global warming (Zhao et al. 2021) and vegetation (Liu et al. 2021) affect SOC (Peng et al. 2018). A loss of SOC content even from small sites may cause great changes in atmospheric CO2 concentration (Lal 2019). Therefore, the conservation of SOC and MB is closely related to the preservation of vegetation and soil in the field. As a matter of fact, eroded areas and bare soil surfaces contain considerably less MB compared to areas covered with forests (Kara et al. 2016). Nevertheless, little is known about the relationship between soil loss and erosion in terms of microbiological characteristics (Merlo et al. 2022), and the effects of erosion on soil properties, such as basal respiration (BR) and metabolic quotient (qCO2), require better clarification (Yao et al. 2019).
BR is an important parameter that characterizes soil MB and activity (Bargali et al. 2018). BR is higher in fertile vegetation (Liu et al. 2021) and biomass in the forest floor, which is a developed formation, and leads to an increase in microbial activity (Liu et al. 2023). Similar studies have reported that BR values in natural forests are higher than those in degraded areas (Sushko et al. 2019, Taghipour et al. 2022). Since BR tends to increase with stand age (Yu et al. 2019), plant richness (Zhang et al. 2019), and activity of aerobic microorganisms (Walkiewicz et al. 2021), there is a close relationship between BR and MB in forests (Smith et al. 2021). In addition, increases in soil carbon content cause a direct increase in BR (Bolat and Sensoy 2019), and it is thus higher in forest areas with higher carbon content than in deforested areas. Even though there are some uncertainties in the relationship between BR and soil erosion (Yao et al. 2019), degraded and eroded areas have much lower MB and activity than areas that maintain their stability (De Oliveira Santos et al. 2022).
qCO2 is the respiration rate per unit biomass and represents the capacity of microbial soil organisms to use organic matter (Xu et al. 2017). Unlike BR, there is a negative correlation between qCO2 and development of plant formations (Liu et al. 2021), and soil organic and microbial carbon content (Mao and Zeng 2010, Jia and Liu 2017). A decrease in qCO2 is an indicator of recovery in disturbed habitats (Hu et al. 2016). In other words, an increase in qCO2 indicates the existence of a problem in the habitat.
Following deforestation or destruction of vegetation, interactions between these factors may also vary depending on different land uses. While heavy and uncontrolled grazing creates serious pressure on pastures (Gonzalez and Ghermandi 2021), many factors such as population growth, intensive road network, agricultural land opening, and devegetation have the potential to cause damage to forests (Ranjan 2018, Savari et al. 2020, Tun et al. 2021). Construction of dams, bridges, and other structures on slopes and in forests may also lead to the loss of vegetation and forests and accelerate the formation of gullies and erosion. Even though such structures are constructed on small sites, they may lead to serious problems and stress on lands outside their boundaries of functional use in the case of vegetation removal for various reasons (Maavara et al. 2020). Lack of vegetation and bareness, especially on steep slopes, trigger erosion (Chen et al. 2018, Ustaoğlu et al. 2021); besides, erosion can accelerate much more rapidly and form gullies in such topographies (Majumdar et al. 2022).
The site at which the study was carried out is within the Black Sea region. This region has a steep and mountainous topography. Since the mountains in the Black Sea Region lie parallel to the sea, many rivers of short length can be found in the region. In recent years, energy production in Turkey has been among the priority targets of the central government. Within the framework of this energy supply policy, dozens of small-scale dams have been established on the small rivers in the Black Sea region (Varol et al. 2022). However, in steep and mountainous regions, natural resources, such as soil and water, may be damaged before and during dam construction. Soil loss and land degradation are also included in the forces causing damage to this site.
This study was carried out on the slopes that were deforested during the construction of the Kirazlıköprü Dam, which was built on the Gökırmak tributary of the Bartın River, located in the northwestern part of Turkey. The construction of the dam began in 1998 (Karakaya 2005) and has had a long construction period due to various bureaucratic reasons, after which it was used to store water even though it has not yet been completed. Deforestation at the dam site, which is located in a topography with steep slopes, started before 1998. This site has been deforested due to several reasons, such as the construction of the dam and roads necessary for dam construction. Afterward, rapid erosion, which still continues as of 2022, started at the site. It is suspected that changes in the soil characteristics on the slopes of the Kirazlıköprü Dam, along with the soil loss during this period of more than twenty years, have occurred. The selected study area is steep with no vegetation covering it, and without a mechanical or vegetative soil holder or protective buffer zone between the area and the stream. The unsurprising result of this situation is the formation of gullies on the site in a relatively short period of time.
The assumption that some physical, chemical, and microbial soil properties of the slope with its natural forest cover and the adjacent deforested slope with serious gullies on its ground may vary considerably within a period of about two decades has been influential in conducting this study. Based on this assumption, the purpose of this study was to compare the soils of a deforested slope with gully erosion and an adjacent forested slope and to reveal whether they have any physical, chemical, and microbial differences.
2. Materials and Methods
2.1 Site Description
Fig. 1 Kirazlıköprü Dam and the deforested areas on the slopes
The study was carried out on the slopes of the Kirazlıköprü Dam, which was built on the Gökırmak tributary of the . This site is located in the south of Bartın City Center at a distance of 16 km. According to the long-term data from Bartın Meteorology Station, in which meteorological data closest to the study area are recorded, the average annual temperature is 12.74°C, and the average annual precipitation is 1039.73 mm (Sensoy and Atesoglu 2018).
Fig. 2 Location of sampling points in the study area
Many deforested areas with their vegetation removed for the construction of the Kirazlıköprü Dam and the nearby expressway on the slopes on both sides of the Gökırmak river (Fig. 1) can be found. Of these areas, a 2.8 hectare west-orientated deforested slope with gullies (SDE) (latitude 41°32'16", longitude 32°28'25", altitude 138 m) and a neighboring native forested slope (SF) (latitude 41°32'21", longitude 32°28'27", altitude 154 m) were selected as the study area (Fig. 2). The steeper slopes in the site within the dam arch could not be selected because the authorities did not allow it, considering the possible dangers for people. Upon removal of the vegetation on SDE, terraces were formed probably for soil conservation purposes. These terraces, sequent gullies, and small cliffs caused the natural slope line of the field to be lost at many points. Therefore, it was difficult to determine a realistic slope value for SDE, yet it was identified to be over 50% at many points. The average slope of SF, which was observed to have a heterogeneous microtopography, was determined to be 45%. The most common tree species on SF are black pine (Pinus nigra Arnold.) and oak (Quercus robur L.). Besides, the other tree species at the site include field maple (Acer campestre L.), rhododendron (Rhododendron ponticum L.), hornbeam (Carpinus betulus L.), hazel (Corylus sp.), and chestnut (Castanea sativa Mill.). On SDE, woody trees such as black pine, oak, and strawberry tree (Arbutus unedo L.) are rare, whereas the distribution of herbaceous blackberry species (Rubus sp.) is highly dense.
There are gullies on SDE with a depth of over 1 m and a width of over 2 m (Fig. 3). A total of four large gully channels with individual gully heads can be found in the site, and the widths of these gully channels vary along the vertical profile of the slope. Apart from this main gully system, a lack of protective vegetation caused rills on the surface of the study site. Although there is a certain canopy cover on the SF slopes, the vegetation does not show a covering feature, except for the blackberry (Rubus) spread in the form of clusters on the SDE slopes.
2.2 Data Collection
SDE and SF soil samples were collected from the topsoil with a depth of 0 to 5 cm as of September 2022. Since SDE is an erosional area with its natural soil structure disturbed, the soil samples were taken from the top of the gully channels that reflected the situation. The subsoil was not included in the study; therefore, no samples were taken from the lateral wall or the bottom of the gullies. During the sampling process, the degraded area on SDE was horizontally divided into three strips with a width of about 100 meters and categorized as upper, middle and lower parts. The purpose was not to compare the upper- middle- lower parts of the slope but rather to take samples all across the degraded area. From each part, three metal cylinder (5×8.0 cm) samples to identify physical -chemical soil properties and three 2 mm sieved soil samples to identify microbial properties were taken at about 50 to 70 m intervals. A total of nine topsoil samples were collected from the site by random systematic sampling. As for the SF soils, a total of six samples were taken at 40 to 50 m intervals in such a way that would correspond to the same elevation as SDE (Fig. 2). The soil samples to be used to determine MB were stored at 4°C until used for the analysis. During sampling, the soil and air temperatures of both SDE and SF were recorded using a digital thermometer in duplicate.
Fig. 3 Gullies formed on SDE
2.3 Determination of Physicochemical and Microbial Soil Properties
To identify the physicochemical properties of the soil, the cylinder samples were sifted with a 2 mm sieve, and the soil parts of >2 mm and <2 mm were weighed. The sand -silt -clay percentages of the samples were determined using a hydrometer based on the Bouyoucos (1962) method. The soil moisture content was measured through the gravimetric method using a soil sample dried at 105°C with a dry air sterilizer (Reynolds 1970). The particle density was found through the pycnometer method using a water vacuum pump (Blake and Hartge 1986), the bulk density was estimated based on cylinder size (5×8.0 cm) and mass, and the total porosity was calculated using the particle and bulk density (Solgi et al. 2018). The pH (soil:water, 1:2.5) and electrical conductivity (soil:water, 1:5) of the soils were measured using a glass-electrode digital multimeter. The SOC content was determined using the chromic acid oxidation method (Walkley and Black 1934).
The MBC was determined using the chloroform fumigation extraction method. Chloroform was used for the fumigation process, after which the samples were extracted with a K2SO4 solution (Vance et al. 1987). The BR was estimated using the sodium hydroxide trap method. For this purpose, the samples were incubated aerobically in a closed glass jar, after which CO2 emitted from the soil was trapped in NaOH and measured via titration with HCl after seven days (Alef 1995). The qCO2 was determined as the ratio between BR and MBC content, and the microbial quotient was taken as the ratio of microbial biomass carbon to soil organic carbon content (MBC/SOC) as explained by several researchers (Anderson and Domsch 1990, Anderson and Domsch 1993).
2.4 Statistical Analyses
In the study, the SPSS 16.0 software package program was used for the statistical analyses. A t-test was performed to identify whether there existed a difference between the physical, chemical, and microbial properties of SDE and SF soils. The relationship between physicochemical soil properties and MB and activity was determined using the Pearson's correlation analysis.
3. Results
3.1 Physical and Chemical Soil Characteristics
The results regarding some physical and chemical properties of SDE and SF soils are presented in Table 1. According to the data, SDE soils are found in sandy clay, and SF soils are in the clay class. It was found that minimum and maximum sand values were 26.14% and 60.93% in SF and SDE soils, respectively, and that the values showed differences between the SDE and SF (p≤0.05). Minimum and maximum clay values were found to be 28.61% and 59.80% in SDE and SF soils, respectively. Even though a difference of approximately 10% was found between the clay averages of SDE and SF soils, this value did not constitute a significant difference (p>0.05). No significant difference between the average silt values of SDE and SF soils (p>0.05) was found. The >2 mm/<2 mm (coarse material) ratio varied between SDE and SF soils (p≤0.05) as shown in Table 1. The mean values for bulk density and total porosity indicated a marked difference (p≤0.05) between SDE and SF soils.
Table 1 Mean values of some physical and chemical soil characteristics in SDE and SF soils
|
Soil Characteristics |
SDE |
SF |
|
Sand, % |
46.9 a |
33.6 b |
|
Silt, % |
14.5 a |
18.1 a |
|
Clay, % |
38.6 a |
48.3 a |
|
Soil texture |
Sandy clay |
Clay |
|
Bulk density, g cm-3 |
1.53 a |
1.16 b |
|
Total porosity, % |
41.69 a |
51.83 b |
|
Soil temperature, °C |
21.90 a |
18.77 b |
|
>2 mm/<2 mm, % |
40.16 a |
22.48 b |
|
pH H2O |
7.72 a |
5.31 b |
|
Electrical conductivity, μS cm-1 |
61.80 a |
39.45 b |
|
Soil organic, C g kg-1 |
4.41 a |
22.53 b |
|
Different letters in the rows indicate significant differences between the groups (p≤0.05) |
||
The minimum and maximum values for the actual pH values of SDE were 7.26 and 7.95, respectively, and SF soils were 4.92 and 5.84, respectively. A significant difference was found between the SDE and SF (p≤0.05). The mean values for electrical conductivity (EC) also indicated a marked difference (p≤0.05) between SDE and SF soils. The SOC content of SF soils was more than five times that of SDE soils with a significant difference (p≤0.05) as shown in Table 1.
3.2 Microbial biomass carbon (MBC) and microbial quotient (MBC/SOC)
The mean values for MBC in SDE and SF soil were determined as 207.42±33.53 μg g-1 and 885.55±44.85 μg g-1, respectively. MBC values were in the range of 66.33 to 563.24 μg g-1 in a total of 18 samples in SDE soils and between 606.33 and 1129.74 μg g-1 in a total of 12 samples in SF soils. The results of the statistical analysis revealed a significant difference between the MBC contents in SDE and SF soils (p≤0.05) as shown in Fig. 4a.

Fig. 4 Mean values for microbial biomass carbon (MBC) – (A) and microbial quotient (MBC/SOC) – (B) in SDE and SF soils. Different letters in parentheses indicate a statistical difference (p≤0.05) between the groups
The microbial quotient (MBC/SOC) was determined as 7.1±1.40% and 4.4±0.39% in SDE and SF soils, respectively. The minimum and maximum MBC/SOC values in SDE soils were 0.6% and 21.7%, respectively, while these values in SF soils ranged between 2.2% and 6.0%, respectively. Even though SDE soils had a higher MBC/SOC ratio than SF soils, no statistically significant difference between the two groups (p>0.05) was found (Fig. 4b).
3.3 Basal Respiration (BR) and Metabolic Quotient (qCO2)
The mean value for BR was found to be 0.292±0.03 μg CO2 – C g-1 h-1 in SDE soils and 0.745±0.11 μg CO2 – C g-1 h-1 in SF soils. The minimum and maximum BR values on SDE soils were calculated to be 0.126 μg CO2 – C and 0.661 μg CO2 – C g-1 h-1 and 0.171 μg CO2 – C g-1 h-1 and 1.404 μg CO2 – C g-1 h-1 in SF soils, respectively. As a result of the statistical analysis, a significant difference was identified between the BR values of SDE and SF soils (p≤0.01) as shown in Fig. 5a. The mean value for qCO2 in SDE and SF soils was determined as 1.897±1.09 and 0.808±0.37 μg CO2 – C g-1 Cmic h-1, respectively. The minimum and maximum qCO2 values were calculated as 0.248 and 4.202 μg CO2 – C g-1 Cmic h-1 in SDE, and 0.282 and 1.343 μg CO2 – C g-1 Cmic h-1 in SF, respectively. The statistical analysis revealed a significant difference between the qCO2 values of SDE and SF soils (p≤0.05) as shown in Fig. 5b.
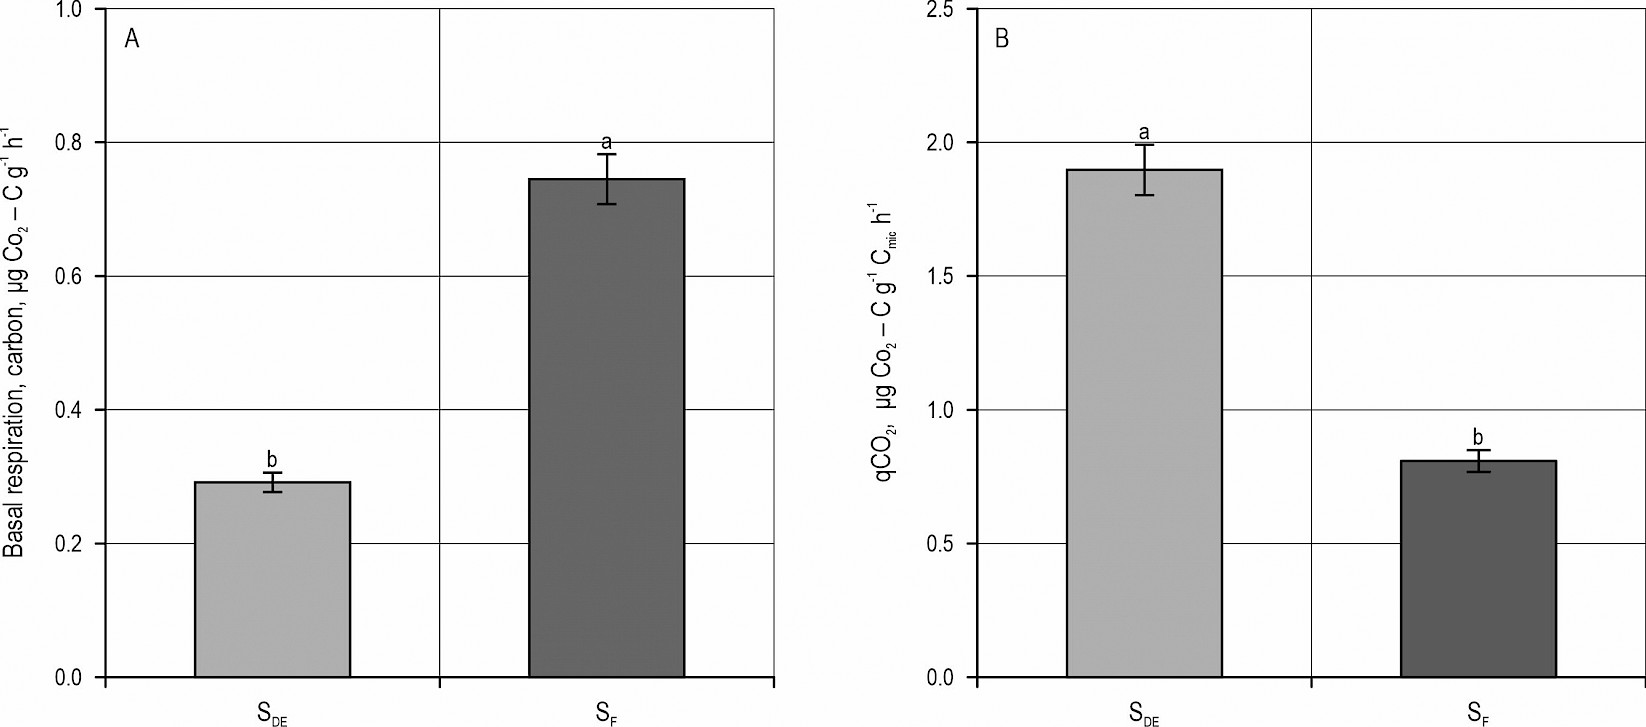
Fig. 5 Mean values for basal respiration (BR) – (A) and metabolic quotient (qCO2) – (B) in SDE and SF soils. Different letters in parenthesis indicate the difference between the groups (p≤0.05)
3.4 Relationship between Physicochemical Soil Characteristics and Microbial Properties
Pearson's correlation analysis revealed a positive correlation between MBC and SOC (r=0.805; p<0.01), and a negative correlation between >2 mm/<2 mm (r=–0.538; p<0.05), sand (r=–0.611; p<0.05), bulk density (r=–0.795, p<0.01), and pH (r=–0.883; p<0.01). A positive correlation was also found between MBC/SOC and bulk density (r=0.518; p<0.05). Moreover, a positive correlation was identified between BR and SOC (r=0.711; p<0.01), yet a negative correlation between bulk density (r=–0.680, p<0.01) and pH (r=–0.592; p<0.05). Furthermore, a positive correlation was found between qCO2 and pH (r=0.570; p<0.05) and sand particles (r=0.579; p<0.05). The correlation between physicochemical and microbial properties is detailed in Table 2.
Table 2 Correlation analysis between physicochemical and microbial characteristics in SDE and SF soils
|
|
BD |
TP |
Sand |
Clay |
>2 mm/ < 2 mm |
pH |
EC |
SOC |
MBC |
BR |
MBC/ SOC |
qCO2 |
|
|
BD |
Pearson |
1 |
–.965** |
0.501 |
–0.326 |
.579* |
.855** |
.525* |
–.857** |
–.795** |
–.680** |
.518* |
0.344 |
|
Sig |
– |
0.000 |
0.057 |
0.235 |
0.024 |
0.000 |
0.044 |
0.000 |
0.000 |
0.005 |
0.048 |
0.209 |
|
|
TP |
Pearson |
–.965** |
1 |
–0.504 |
0.314 |
–0.506 |
–.845** |
–0.483 |
.833** |
.829** |
.641** |
–0.391 |
–0.413 |
|
Sig |
0.000 |
– |
0.055 |
0.255 |
0.054 |
0.000 |
0.068 |
0.000 |
0.000 |
0.010 |
0.150 |
0.126 |
|
|
Sand |
Pearson |
0.501 |
–0.504 |
1 |
–.918** |
0.430 |
.730** |
.722** |
–0.379 |
–.611* |
–0.245 |
–0.152 |
.579* |
|
Sig |
0.057 |
0.055 |
– |
0.000 |
0.109 |
0.002 |
0.002 |
0.164 |
0.016 |
0.379 |
0.589 |
0.024 |
|
|
Clay |
Pearson |
–0.326 |
0.314 |
–.918** |
1 |
–0.245 |
–.559* |
–.751** |
0.149 |
0.378 |
0.011 |
0.303 |
–0.509 |
|
Sig |
0.235 |
0.255 |
0.000 |
– |
0.380 |
0.030 |
0.001 |
0.596 |
0.164 |
0.969 |
0.272 |
0.053 |
|
|
>2 mm/ <2 mm |
Pearson |
.579* |
–0.506 |
0.430 |
–0.245 |
1 |
.628* |
0.425 |
–.576* |
–.538* |
–0.390 |
0.385 |
0.265 |
|
Sig |
0.024 |
0.054 |
0.109 |
0.380 |
– |
0.012 |
0.114 |
0.025 |
0.038 |
0.150 |
0.156 |
0.341 |
|
|
pH |
Pearson |
.855** |
–.845** |
.730** |
–.559* |
.628* |
1 |
.726** |
–.733** |
–.883** |
–.592* |
0.253 |
.570* |
|
Sig |
0.000 |
0.000 |
0.002 |
0.030 |
0.012 |
– |
0.002 |
0.002 |
0.000 |
0.020 |
0.363 |
0.027 |
|
|
EC |
Pearson |
.525* |
–0.483 |
.722** |
–.751** |
0.425 |
.726** |
1 |
–0.364 |
–0.450 |
–0.318 |
0.056 |
0.259 |
|
Sig |
0.044 |
0.068 |
0.002 |
0.001 |
0.114 |
0.002 |
– |
0.182 |
0.092 |
0.249 |
0.844 |
0.351 |
|
|
SOC |
Pearson |
–.857** |
.833** |
–0.379 |
0.149 |
–.576* |
–.733** |
–0.364 |
1 |
.805** |
.711** |
–0.446 |
–0,398 |
|
Sig |
0.000 |
0.000 |
0.164 |
0.596 |
0.025 |
0.002 |
0.182 |
– |
0.000 |
0.003 |
0.096 |
0.142 |
|
|
MBC |
Pearson |
–.795** |
.829** |
–.611* |
0.378 |
–.538* |
–.883** |
–0.450 |
.805** |
1 |
.723** |
–0.057 |
–.658** |
|
Sig |
0.000 |
0.000 |
0.016 |
0.164 |
0.038 |
0.000 |
0.092 |
0.000 |
– |
0.002 |
0.841 |
0.008 |
|
|
BR |
Pearson |
–.680** |
.641** |
–0.245 |
0.011 |
–0.390 |
–.592* |
–0.318 |
.711** |
.723** |
1 |
–0.292 |
–0.074 |
|
Sig |
0.005 |
0.010 |
0.379 |
0.969 |
0.150 |
0.020 |
0.249 |
0.003 |
0.002 |
– |
0.290 |
0.794 |
|
|
MBC/ SOC |
Pearson |
.518* |
–0.391 |
–0.152 |
0.303 |
0.385 |
0.253 |
0.056 |
–0.446 |
–0.057 |
–0.292 |
1 |
–0.339 |
|
Sig |
0.048 |
0.150 |
0.589 |
0.272 |
0.156 |
0.363 |
0.844 |
0.096 |
0.841 |
0.290 |
– |
0.216 |
|
|
qCO2 |
Pearson |
0.344 |
–0.413 |
.579* |
–0.509 |
0.265 |
.570* |
0.259 |
–0.398 |
–.658** |
–0.074 |
–0.339 |
1 |
|
Sig |
0.209 |
0.126 |
0.024 |
0.053 |
0.341 |
0.027 |
0.351 |
0.142 |
0.008 |
0.794 |
0.216 |
– |
|
|
** Correlation is significant at the 0.01 level (2–tailed) |
|||||||||||||
|
* Correlation is significant at the 0.05 level (2–tailed) |
|||||||||||||
4. Discussion
4.1 Physical and Chemical Soil Characteristics
At our study site, SDE was deprived of vegetation for more than twenty years and then exposed to gully erosion; fine materials such as silt and clay were removed, and the remaining content in the area mostly consisted of sand and >2 mm materials (Table 1). It is a result encountered in the heavily eroded areas in which degraded forest soils have a higher coarse fraction and a lower porosity compared to natural forest soils. The bulk density increases in deforested areas (Hajabbasi et al. 1997, Sirajul Haque et al. 2014), and macro pores are especially affected by the severity of the erosion (Xia et al. 2021). Since intense erosion in SDE occurs, it is predicted that the natural topsoil is carried away, and the more compact lower parts remain on the site. To express this possibility as a fact, sampling from different soil depths is needed. While SDE was being deforested, it can be seen that terracing was done on the slope. Therefore, soil compaction is possible due to the presence of heavy machinery at the site. On the other hand, gully erosion affects the porous soil structure (Gan et al. 2019), and the increase in stoniness causes a reduction in the total porosity (Li et al. 2021a). These results indicate that bulk density and total porosity are good indicators for obtaining an evaluation of the eroded area. In this study, the bulk density and the total porosity indicators clearly revealed the current degradation of land, which used to be completely forested about 25 years ago, after the removal of its forest cover. Soil pH values are mostly lower in areas that were planted or are covered with vegetation (Zhao et al. 2022b, Zheng et al. 2022) and areas of higher erosion (Heri-Kazi and Bielders 2021). Under these conditions, the soil structure in the eroded area is under constant stress and varies because gullies and a continuous and rapid transportation accumulation exist, and it becomes more likely for the top and subsoil layers to blend, leading to permeability. On the other hand, nitrogen leaching and storage are persistent in the soils under the natural forest and may lead to a decrease in pH values (Lv et al. 2020). For these reasons, pH values may be low in forest soils (Table 1). EC is an important indicator of soil health (Levi et al. 2020, Xie et al. 2020), and its increase usually depends on the increase of soluble salts in the soil (Asghari Saraskanroud et al. 2017). Since topsoil is generally transported in erosion-prone areas, subsoil can surface, and it is reported that EC and salinity increase toward the middle and lower parts of the soil (Cadaret et al. 2016, Perera et al. 2020). In this study, the fact that the EC value of SDE soils is higher than that of SF soils is considered a result of erosion – deposition events in the gully area and surface of subsoil due to the gullies formed. Many edaphic, topographic and vegetative factors have an impact on SOC. Vegetation and erosion affect the changes in soil organic matter (Dudek et al. 2022), and the SOC content is closely related to the presence or variability of vegetation (Baldassini and Paruelo 2020) and soil erosion (Hamer et al. 2009, Yao et al. 2019, Li et al. 2021b). Soils without vegetation are susceptible to the erosive effect of heavy rainfall. Heavy rainfall is also effective in displacement of SOC (Hancock et al. 2019). This finding implies that erosional areas have a potential for SOC loss. Since the study site has been deforested in addition to the formation of serious gullies, SOC loss will inevitably be much faster and greater. The results regarding the SOC clearly present the degradation over about two decades (Table 1).
4.2 Microbial Biomass Carbon (MBC) and Microbial Quotient (MBC/SOC)
There is a close relationship between soil nutrients and MBC, and it is reported to be stronger than that of BR and qCO2 with the nutrients (Zeng et al. 2015). The fact that MBC values are low in SDE soils can be considered typical and expected because, as a result of deforestation, the vegetation cover in the area and the presence of plant residues decrease, and the organic matter in the topsoil that has been transported by erosion is lost. However, the fact that the proportional difference is more than four times the initial amount indicates how effective the combination of both erosion and deforestation has been on MBC over more than two decades. The soil loss due to erosion also increases the amount of MBC that is lost (Kara et al. 2010). As a result, individual effects due to both factors, namely deforestation and increased erosion, on the MBC content are negative. If it is considered that this negative result is combined in an area in which both deforestation and gully erosion can be observed, it is possible to explain the four times difference in MBC content in the deforested area compared to the area with natural forest (Fig. 4a). This difference was revealed in this study because the presence of soil MBC is affected by the characteristics of vegetation cover (Kara et al. 2016, Bargali et al. 2018, Prommer et al. 2020) and degradation of the soil surface (Zhao et al. 2022a).
MBC/SOC is one of the key determinants of soil quality (Yan et al. 2022) and is considered a good indicator of environmental stress and human pressure on natural resources (Bastida et al. 2008, Zhou et al. 2017). Many factors, including soil characteristics (depth, clay content – Yang et al. 2016, Sun et al. 2020, pH – Tian et al. 2008), vegetation and afforestation (Yang et al. 2016, Kara et al. 2016), and land use (Lepcha and Devi 2020) affect MBC/SOC. Results indicating that the MBC/SOC is lower in deforested areas (Sirajul Haque et al. 2014) have been reported in addition to statistical differences (Kooch et al. 2018). On the other hand, it was found that the MBC/SOC increases with soil loss (Kara et al. 2010). Another important point is that the MBC/SOC may vary along the slope profile. While the microbial quotient is high in the lower and middle parts of slopes, it may be low in the upper parts (Campos et al. 2014). Therefore, the combined effect of deforestation, erosion, and slope characteristics may cause the microbial quotient to be highly variable (Fig. 4b). It can be concluded that the results are shaped depending on the dominant individual factor in the combined effect.
4.3 Basal Respiration (BR) and Metabolic Quotient (qCO2)
and activity in eroded areas can be considered an indicator of low BR in these areas. As a matter of fact, Merlo et al. (2022) reported an inversely proportional relationship between BR and soil loss. The fact is that there is a BR difference between the neighboring SF and SDE soils in this study (Fig. 5a). The richness of the vegetation also affects the high BR value (Yang et al. 2016). Vegetation cover and uneroded topsoil may be the leading factors in higher BR in SF soils, because increasing soil depth or loss of topsoil due to erosion and remaining compacted soil on the field lead to a reduction in BR. The difference in BR between the lower and upper parts of the slope (Sun et al. 2018) may also have affected the higher BR value in SF soils. SDE has more upper slope characteristics as it loses soil more rapidly through erosion.
qCO2 can also vary in a wide range between natural ecosystems like forests and non-natural formations, such as cultivated land (Xu et al. 2017). The fact that bare, unplanted, and eroded areas are affected more by changes in temperature than lands with dense vegetation and forests may contribute to the formation of this wide range of variation because temperature is one of the key factors affecting qCO2 (Li et al. 2020). The marked difference between the average temperature values of SDE and SF soils in the study area also enhances this possibility (Table 1). Besides, due to higher rate of substrate use by MB, qCO2 is lower in forest soils than in bare soils (Hamer et al. 2009). In addition to deforestation, the soil loss caused by gully erosion is another problem in the study area. Substantial amount of nutrients, also including organic carbon, has been lost along with the topsoil (Table 1). The negative correlation between SOC and qCO2 (Jia and Liu 2017) is another factor affecting the process in which SDE soils produce higher qCO2 than SF soils (Fig. 5b). Since an increase in qCO2 is considered an indicator of deforestation, environmental stress, and ecologic problems (Hu et al. 2016, Sanji et al. 2020), the findings obtained from SDE soils within the scope of this study are considered a clear outcome of the degradation caused by deforestation and gully erosion.
4.4 Relationship Between Physicochemical Soil Characteristics and Microbial Properties
It was observed that the most relevant physical and chemical soil characteristics of MB and activity are bulk density, pH, and SOC (Table 2). This study revealed once again that SOC has a close positive relationship with MB and activity. Studies have shown that pH, bulk density, and SOC are prominent parameters in relation to MB (Kara and Bolat 2008, Li et al. 2018). The relationship of bulk density with MBC and BR was identified to be negative, which supports the view that the increase in bulk density supresses microbial life (Boeddinghaus et al. 2015). Loss of topsoil in deforested and eroded areas leads to a decrease in organic matter content, which causes an increase in bulk density (Grüneberg et al. 2014) and thus a decrease in MB (Sanji et al. 2020). It should be noted that deforestation causes the degradation of most soil properties and creates profound changes in dynamic soil properties (Kooch et al. 2018, Veldkamp et al. 2020). As in bulk density, the pH content of soil negatively correlates with MBC and BR but positively correlates with qCO2. Deforestation causes high pH values in soils (Sirajul Haque et al. 2014), and high values of bulk density and pH cause the decrease of SOC values (Lepcha and Devi 2020). This result provides a negative but significant correlation between pH and MB. Previous studies have repeatedly revealed a positive correlation between SOC and MBC and BR (Bargali et al. 2018, Bolat and Sensoy 2019), and this study reaffirms this strong correlation. Two of several essential factors that lead to an increase in SOC and MBC content are the presence of rich vegetation (Prommer et al. 2020) and non-degraded natural soils (Anderson et al. 2008). The phenomenon of erosion causes MBC and soil quality to decline (Mandal et al. 2021). Therefore, the decrease in vegetation and loss of topsoil because of erosion indicate a parallel change in SOC and MB.
5. Conclusions
The impact of deforestation and erosion on physical, chemical and microbial characteristics of topsoil on slopes was investigated in a limited area. In just over two decades, deforestation and erosion have led to a decrease in organic carbon, MBC, and BR, and an increase in MBC/SOC and qCO2 in the topsoil. Many physical and chemical soil characteristics, including sand, pH, EC, temperature, bulk density, porosity, organic carbon, and >2 mm/<2 mm fraction ratio in the topsoil have also been affected by deforestation and erosion during this period. Organic carbon, bulk density, and pH have been the prominent physicochemical soil parameters that affect microbial biomass and activity. Deforestation, which is ignored while the dams are being built, poses a serious risk of causing erosion, especially during long periods of construction. It is concluded that transportation and deposition caused by erosion on the upper, middle, and lower parts of a slope create spatial variations in both physical and chemical soil characteristics.
Acknowledgements
The author would like to thank Dr. Ilyas Bolat for his valuable contribution, support and suggestions throughout the study, and declares that no funds, grants, or other supports have been received during the preparation of this manuscript.
6. References
Alef, K., 1995: Estimation of soil respiration. In: Alef K, Nannipieri P. (eds.) Methods in applied soil microbiology and biochemistry, Academic, , 215–216.
Anderson, T.H, Domsch, K.H., 1990: Application of eco-physiological quotients (qCO2 and qD) on microbial biomasses from soils of different cropping histories. Soil Biol. Biochem. 22(2): 251–255. https://doi.org/10.1016/0038-0717(90)90094-G
Anderson, T.H., Domsch, K.H., 1993: The metabolic quotient for CO2 (qCO2) as a specific activity parameter to assess the effects of environmental conditions, such as pH, on the microbial biomass of the forest soils. Soil Biol. Biochem. 25(3): 393–395. https://doi.org/10.1016/0038-0717(93)90140-7
Anderson, J.D., Ingram, L.J., Stahl, P.D., 2008: Influence of reclamation management practices on microbial biomass carbon and soil organic carbon accumulation in semiarid mined lands of Wyoming. App. Soil Ecol. 40(2): 387–397. https://doi.org/10.1016/j.apsoil.2008.06.008
Asghari Saraskanroud, S., Zeinali, B., Mohammadnejad, V., 2017: Analysis physical and chemical properties of soil and morphometric impacts on gully erosion. Desert 22(2): 157–166. https://doi.org/10.22059/JDESERT.2017.64179
Bai, Y., Zha, X., Chen, S., 2020: Effects of the vegetation restoration years on soil microbial community composition and biomass in degraded lands in Changting County, China. J. For. Res. 31(4): 1295–1308. https://doi.org/10.1007/s11676-019-00879-z
Baldassini, P., Paruelo, J.M., 2020: Deforestation and current management practices reduce soil organic carbon in the semi-arid Chaco, Argentina. Agric. Syst. 178: 102749. https://doi.org/10.1016/j.agsy.2019.102749
Bargali, K., Manral, V., Padalia, K., Bargali, S.S., Upadhyay, V.P., 2018: Effect of vegetation type and season on microbial biomass carbon in Central Himalayan forest soils, India. Catena 171: 125–135. https://doi.org/10.1016/j.catena.2018.07.001
Bastida, F., Zsolnay, A., Hernandez, T., Garcia, C., 2008: Past, present and future of soil quality indices: A biological perspective. Geoderma 147(3–4): 159–171. https://doi.org/10.1016/j.geoderma.2008.08.007
Blake, G.R., Hartge, K.H., 1986: Particle density. In: »Klute A (ed.) Methods of Soil Analysis«, American Society of Agronomy, Madison; 377–382. https://doi.org/10.2136/sssabookser5.1.2ed.c14
Boeddinghaus, R.S., Nunan, N., Berner, D., Marhan, S. Kandeler, E., 2015: Do general spatial relationships for microbial biomass and soil enzyme activities exist in temperate grassland soils? Soil Biol. Biochem. 88: 430–440. https://doi.org/10.1016/j.soilbio.2015.05.026
Bolat, I., Sensoy, H., 2019: Microbial biomass soil content and activity under black alder and sessile oak in the western Black Sea Region of Turkey. Int. J. Environ. Res. 13: 781–791. https://doi.org/10.1007/s41742-019-00216-6
Bouyoucos, G.J., 1962: Hydrometer method improved for making particle size analysis of soils. Agron. J. 54(5): 464–465. https://doi.org/10.2134/agronj1962.00021962005400050028x
Cadaret, E.M., Nouwakpo, S.K., McGwire, K.C., Weltz, M.A., Blank, R.R., 2016: Experimental investigation of the effect of vegetation on soil, sediment erosion, and salt transport processes in the Upper Colorado River Basin Mancos Shale formation, Price, Utah, USA. Catena 147: 650–662. https://doi.org/10.1016/j.catena.2016.08.024
Campos, A.C., Etchevers, J.B., Oleschko, K.L., Hidalgo, C.M., 2014: Soil microbial biomass and nitrogen mineralization rates along an altitudinal gradient on the Cofre de Perote Volcano (Mexico): The importance of landscape position and land use, Land Degrad. Dev. 25(6): 581–593. https://doi.org/10.1002/ldr.2185
Chen, H., Zhang, X., Abla, M., Lü, D., Yan, R., Ren, Q., Ren, Z., Yang, Y., Zhao, W., Lin, P., Liu, B. Yang, X., 2018: Effects of vegetation and rainfall types on surface runoff and soil erosion on steep slopes on the Loess Plateau, China. Catena 170: 141–149. https://doi.org/10.1016/j.catena.2018.06.006
De Oliveira Santos, T., Fracetto, F.J.C., de Souza Junior, V.S., de Araujo Filho, J.C., Lira Junior, M.A., Mendes Junior, J.P., Neto, M.S., da Silva, Y.R.O., do Rego Barros, F.M., Fracetto, G.G.M., 2022: Carbon and nitrogen stocks and microbial indicators in tropical semiarid degraded Luvisols. Catena 210: 105885. https://doi.org/10.1016/j.catena.2021.105885
Dudek, M., Labaz, B., Bednik, M., Medynska-Juraszek, A., 2022: Humic substances as indicator of degradation rate of chernozems in south-eastern Poland. Agronomy 12(3): 733. https://doi.org/10.3390/agronomy12030733
Gan, M., Jia, Y., Shao, M., Guo, C., Li, T., 2019: Permanent gully increases the heterogeneity of soil water retention capacity across a slope-gully system. Agric. Ecosyst. Environ. 272: 206–217. https://doi.org/10.1016/j.agee.2018.10.007
Gonzalez, S.L., Ghermandi, L., 2021: Overgrazing causes a reduction in the vegetation cover and seed bank of Patagonian grasslands. Plant and Soil 464(1/2): 75–87. https://doi.org/10.1007/s11104-021-04931-y
Grüneberg, E., Ziche, D., Wellbrock, N., 2014: Organic carbon stocks and sequestration rates of forest soils in Germany. Glob. Chang. Biol. 20(8): 2644–2662. https://doi.org/10.1111/gcb.12558
Hajabbasi, M.A., Jalalian, A., Karimzadeh, H.R., 1997: Deforestation effects on soil physical and chemical properties, Lordegan, Iran. Plant and Soil 190: 301–308. https://doi.org/10.1023/A:1004243702208
Hamer, U., Makeschin, F., An, S., Zheng, F., 2009: Microbial activity and community structure in degraded soils on the Loess Plateau of China. J. Plant Nutr. Soil Sci. 172(1): 118–126. https://doi.org/10.1002/jpln.200700340
Hancock., G.R., Kunkel, V., Wells, T., Martinez, C., 2019: Soil organic carbon and soil erosion – Understanding change at the large catchment scale. Geoderma 343: 60–71. https://doi.org/10.1016/j.geoderma.2019.02.012
Heri-Kazi, A.B., Bielders, C.L., 2021: Cropland characteristics and extent of soil loss by rill and gully erosion in smallholder farms in the KIVU highlands, D.R. Congo. Geoderma Reg. 26: e00404. https://doi.org/10.1016/j.geodrs.2021.e00404
Hu, N., Li, H., Tang, Z., Li, Z., Li, G., Jiang, Y., Hu, X., Lou, Y., 2016: Community size, activity and C:N stoichiometry of soil microorganisms following reforestation in a Karst region. Eur. J. Soil Biol. 73: 77–83. https://doi.org/10.1016/j.ejsobi.2016.01.007
Jia, G., Liu, X., 2017: Soil microbial biomass and metabolic quotient across a gradient of the duration of annually cyclic drainage of hillslope riparian zone in the three gorges reservoir area. Ecol. Eng. 99: 366–373. https://doi.org/10.1016/j.ecoleng.2016.11.063
Kara, O., Bolat, I., 2008: The effect of different land uses on soil microbial biomass carbon and nitrogen in Bartın province. Turk. J. Agric. For. 32(4): 281–288.
Kara, O., Sensoy, H., Bolat, I., 2010: Slope length effects on microbial biomass and activity of eroded sediments. J. Soils Sediments 10: 434–439. https://doi.org/10.1007/s11368-010-0192-8
Kara, O., Babur, E., Altun, L., Seyis, M., 2016: Effects of afforestation on microbial biomass C and respiration in eroded soils of Turkey. J. Sustain. For. 35(6): 385–396. https://doi.org/10.1080/10549811.2016.1190759
Karakaya, K., 2005: Numerical simulation of the Kirazlıköprü dam failure on the Gökırmak River. Master's Thesis, Middle East Technical University, Ankara, Turkey, 117 p.
Kooch, Y., Tavakoli, M., Akbarinia, M., 2018: Microbial/biochemical indicators showing perceptible deterioration in the topsoil due to deforestation. Ecol. Ind. 91: 84–91. https://doi.org/10.1016/j.ecolind.2018.03.084
Lal, R., 2019: Accelerated soil erosion as a source of atmospheric CO2. Soil Till. Res. 188: 35–40. https://doi.org/10.1016/j.still.2018.02.001
Lepcha, N.T., Devi, N.B., 2020: Effect of land use, season, and soil depth on soil microbial biomass carbon of Eastern Himalayas. Ecol. Process. 9: 65. https://doi.org/10.1186/s13717-020-00269-y
Levi, N., Karnieli, A., Paz-Kagan, T., 2020: Using reflectance spectroscopy for detecting land-use effects on soil quality in drylands. Soil Tillage Res. 199: 104571. https://doi.org/10.1016/j.still.2020.104571
Li, J., Tong, X., Awasthi, M.K., Wu, F., Ha, S., Ma, J., Sun, X., He, C., 2018: Dynamics of soil microbial biomass and enzyme activities along a chronosequence of desertified land revegetation. Ecol. Eng. 111: 22–30. https://doi.org/10.1016/j.ecoleng.2017.11.006
Li, J., Nie, M., Pendall, E., Reich, P.B., Pei, J., Noh, N.J., Zhu, T., Li, B., Fang, C., 2020: Biogeographic variation in temperature sensitivity of decomposition in forest soils. Glob. Chang. Biol. 26(3): 1873–1885. https://doi.org/10.1111/gcb.14838
Li, J., Han, Z., Zhong, S., Gao, P., Wei, C., 2021a: Pore size distribution and pore functional characteristics of soils as affected by rock fragments in the hilly regions of the Sichuan Basin, China. Can. J. Soil Sci. 101(1): 74–83. https://doi.org/10.1139/cjss-2019-0167
Li, Y., Duan, X., Li, Y., Li, Y., Zhang, L., 2021b: Interactive effects of land use and soil erosion on soil organic carbon in the dry-hot valley region of southern China. Catena 201: 105187. https://doi.org/10.1016/j.catena.2021.105187
Liu, Y., Yang, H., Xing, Z., Zou, Y., Cui, Z., 2021: Vegetation degradation of Guanshan grassland suppresses the microbial biomass and activity of soil. Land 10(2): 203. https://doi.org/10.3390/land10020203
Liu, Y., Song, X., Wang, K., He, Z., Pan, Y., Li, J., Hai, X., Dong, L., Shangguan, Z., Deng, L., 2023: Changes in soil microbial metabolic activity following long-term forest succession on the central Loess Plateau, China. Land Degrad. Dev. 34(3): 723–735. https://doi.org/10.1002/ldr.4489
Lv, H., Zhao, Y., Wang, Y., Wan, L., Wang, J., Butterbach-Bahl, K., Lin, S., 2020: Conventional flooding irrigation and over fertilization drives soil pH decrease not only in the top- but also in subsoil layers in solar greenhouse vegetable production systems. Geoderma 363: 114156. https://doi.org/10.1016/j.geoderma.2019.114156
Maavara, T., Chen, Q., Van Meter, K., Brown, L.E., Zhang, J., Ni, J., Zarfl, C., 2020: River dam impacts on biogeochemical cycling. Nat. Rev. Earth Environ. 1: 103–116. https://doi.org/10.1038/s43017-019-0019-0
Majumdar, S., Kose, M., Chatterjee, U., 2022: Gully erosion mapping by multi-criteria decision analysis techniques and geoinformatics in Adana province, Turkey. Earth Syst. Environ. 6(3): 759–770. https://doi.org/10.1007/s41748-020-00198-y
Mandal, D., Chandrakala, M., Alam, N.M., Roy, T., Mandal, U., 2021: Assessment of soil quality and productivity in different phases of soil erosion with the focus on land degradation neutrality in tropical humid region of India. Catena 204: 105440. https://doi.org/10.1016/j.catena.2021.105440
Mao, R., Zeng, D.H., 2010: Changes in soil particulate organic matter, microbial biomass, and activity following afforestation of marginal agricultural lands in a semi-arid area of northeast China. Environ. Manag. 46: 110–116. https://doi.org/10.1007/s00267-010-9504-4
Merlo, M.N., Avanzi, J.C., da Silva, L.C.M., da Silva Aragao, O.O., Borghi, E., de Souza Moreira, F.M., Thebaldi, M.S., de Resende, A.V., Silva, M.L.N., Silva, B.M., 2022: Microbiological properties in cropping systems and their relationship with water erosion in the Brazilian Cerrado. Water 14(4): 614. https://doi.org/10.3390/w14040614
Owens, P.N., 2020: Soil erosion and sediment dynamics in the Anthropocene: a review of human impacts during a period of rapid global environmental change. J. Soils Sediments 20: 4115–4143. https://doi.org/10.1007/s11368-020-02815-9
Peng, F., Xue, X., You, Q., Huang, C., Dong, S., Liao, J., Duan, H., Atsushi, T., Wang, T., 2018: Changes of soil properties regulate the soil organic carbon loss with grassland degradation on the Qinghai-Tibet Plateau. Ecol. Ind. 93: 572–580. https://doi.org/10.1016/j.ecolind.2018.05.047
Perera, K.H.K., Udeshani, W.A.C., Piyathilake, I.D.U.H., Wimalasiri, G.E.M., Kadupitiya, H.K., Udayakumara, E.P.N., Gunatilake, S.K., 2020: Assessing soil quality and soil erosion hazards in the Moneragala District, Sri Lanka. SN Appl. Sci. 2(12): 2175. https://doi.org/10.1007/s42452-020-03926-1
Prommer, J., Walker, T.W.N., Wanek, W., Braun, J., Zezula, D., Hu, Y., Hofhansl, F., Richter, A., 2020: Increased microbial growth, biomass, and turnover drive soil organic carbon accumulation at higher plant diversity. Glob. Chang. Biol. 26(2): 669–681. https://doi.org/10.1111/gcb.14777
Ranjan, R., 2018: The role of political-industry nexus in promoting illegal extraction of mineral resources and deforestation: a case of iron ore mining in Goa. Resour. Pol. 57: 122–136. https://doi.org/10.1016/j.resourpol.2018.02.010
Ranjan, R., Sharma, N.K., Kumar, A., Pramanik, M., Mehta, H., Ojasvi, P.R., Yadav, R.S., 2021: Evaluation of maize-based intercropping on runoff, soil loss, and yield in foothills of the Indian sub-Himalayas. Exp. Agric. 57(2): 69–84. https://doi.org/10.1017/S0014479721000053
Reynolds, S.G., 1970: The gravimetric method of soil moisture determination Part I A study of equipment, and methodological problems. J. Hydrol. 11(3): 258–273. https://doi.org/10.1016/0022-1694(70)90066-1
Sanji, R., Kooch, Y., Rey, A., 2020: Impact of forest degradation and reforestation with Alnus and Quercus species on soil quality and function in northern Iran. Ecol. Ind. 112: 106132. https://doi.org/10.1016/j.ecolind.2020.106132
Savari, M., Damaneh, H.E., Damaneh, H.E., 2020: Factors influencing local people's participation in sustainable forest management. Arab. J. Geosci. 13(13): 513. https://doi.org/10.1007/s12517-020-05519-z
Sensoy, H., Atesoglu, A., 2018: A review of climate type variability from Bartın region. J. Bartin Faculty For. 20(3): 576–582. https://doi.org/10.24011/barofd.439619
Shi, W., Huang, M., Wu, L., 2018: Prediction of storm-based nutrient loss incorporating the estimated runoff and soil loss at a slope scale on the Loess Plateau. Land Degrad. Dev. 29(9): 2899–2910. https://doi.org/10.1002/ldr.3028
Sirajul Haque, S.M., Gupta, S.D., Miah, S., 2014: Deforestation effects on biological and other important soil properties in an upland watershed of Bangladesh. J. For. Res. 25(4): 877–885. https://doi.org/10.1007/s11676-014-0534-2
Smith, L.C., Orgiazzi, A., Eisenhauer, N., Cesarz, S., Lochner, A., Jones, A., Bastida, F., Patoine, G., Reitz, T., Buscot, F., Rillig, M.C., Heintz-Buschart, A., Lehmann, A., Guerra, C.A., 2021: Large-scale drivers of relationships between soil microbial properties and organic carbon across Europe. Glob. Ecol. Biogeogr. 30(10): 2070–2083. https://doi.org/10.1111/geb.13371
Solgi, A., Naghdi, R., Labelle, E.R., Tsioras, P.A., Salehi, A., 2018: Comparison of sampling methods used to evaluate forest soil bulk density. Croat. J. For. Eng. 39(2): 247–254.
Sun, Q., Wang, R., Hu, Y., Yao, L., Guo, S., 2018: Spatial variations of soil respiration and temperature sensitivity along a steep slope of the semiarid Loess Plateau. Plos One. 13(4): e0195400. https://doi.org/10.1371/journal.pone.0195400
Sun, T., Wang, Y., Hui, D., Jing, X., Feng, W., 2020: Soil properties rather than climate and ecosystem type control the vertical variations of soil organic carbon, microbial carbon, and microbial quotient. Soil Biol. Biochem. 148: 107905. https://doi.org/10.1016/j.soilbio.2020.107905
Sushko, S.V., Ananyeva, N.D., Ivashchenko, K.V., Kudeyarov, V.N., 2019: Soil CO2 emission, microbial biomass, and basal respiration of chernozems under different land uses. Eurasian Soil Sci. 52(9): 1091–1100. https://doi.org/10.1134/S1064229319090096
Taghipour, K., Heydari, M., Kooch, Y., Fathizad, H., Heung, B., Taghizadeh-Mehrjardi, R., 2022: Assessing changes in soil quality between protected and degraded forests using digital soil mapping for semiarid oak forests, Iran. Catena 213: 106204, https://doi.org/10.1016/j.catena.2022.106204
Tian, Y., Haibara, K., Toda, H., Ding, F., Liu, Y., Choi, D., 2008: Microbial biomass and activity along a natural pH gradient in forest soils in a karst region of the upper Yangtze River, China. J. For. Res. 13(4): 205–214. https://doi.org/10.1007/s10310-008-0073-9
Tun, Z.N., Dargusch, P., McMoran, D., McAlpine, C., Hill, G., 2021: Patterns and drivers of deforestation and forest degradation in Myanmar. Sustainability 13(14): 7539. https://doi.org/10.3390/su13147539
Ustaoğlu, B., Ikiel, C., Atalay Dutucu, A., Koç, D.E., 2021: Erosion susceptibility analysis in Datça and Bozburun Peninsulas, Turkey. Iran. J. Sci. Technol. Trans: Sci. 45(2): 557–570. https://doi.org/10.1007/s40995-020-01053-5
Vance, E.D., Brookes, P.C., Jenkinson, D.S., 1987: An extraction method for measuring soil microbial biomass C. Soil Biol. Biochem. 19(6): 703–707. https://doi.org/10.1016/0038-0717(87)90052-6
Varol, M., Ustaoğlu, F., Tokatlı, C., 2022: Ecological risks and controlling factors of trace elements in sediments of dam lakes in the Black Sea Region (Turkey). Environ. Res. 205: 112478. https://doi.org/10.1016/j.envres.2021.112478
Veldkamp, E., Schmidt, M., Powers, J.S., Corre, M.D., 2020: Deforestation and reforestation impacts on soils in the tropics. Nat. Rev. Earth Env. 1(11): 590–605. https://doi.org/10.1038/s43017-020-0091-5
Walkiewicz, A., Bulak, P., Brzezinska, M., Khalil, M.I., Osborne, B., 2021: Variations in soil properties and CO2 emissions of a temperate forest gully soil along a topographical gradient. Forests 12(2): 226. https://doi.org/10.3390/f12020226
Walkley, A., Black, I.A., 1934: An examination of the Degtjareff method for determining soil organic matter, and a proposed modification of the chromic acid titration method. Soil Sci. 37(1): 29–38.
Wen, X., Zhen, L., 2020: Soil erosion control practices in the Chinese Loess Plateau: A systematic review. Environ. Dev. 34: 100493. https://doi.org/10.1016/j.envdev.2019.100493
Xia, J., Cai, C., Wei, Y., Zhou, Y., Gu, J., Xiong, Y., Zhou, X., 2021: Variations of soil hydraulic properties along granitic slopes in Benggang erosion areas. J. Soils Sediments 21: 1177–1189. https://doi.org/10.1007/s11368-020-02843-5
Xie, X., Pu, L., Zhu, M., Wu, T., Xu, Y., Wang, X., 2020: Effect of long-term reclamation on soil quality in agricultural reclaimed coastal saline soil, Eastern China. J. Soils Sediments 20: 3909–3920. https://doi.org/10.1007/s11368-020-02698-w
Xu, X., Schimel, J.P., Janssens, I.A., Song, X., Song, C., Yu, G., Sinsabaugh, R.L., Tang, D., Zhang, X. Thornton, P.E., 2017: Global pattern and controls of soil microbial metabolic quotient. Ecol. Monogr. 87(3): 429–441. https://doi.org/10.1002/ecm.1258
Yan, Y., Wang, C., Zhang, J., Sun, Y., Xu, X., Zhu, N., Cai, Y., Xu, D., Wang, X., Xin, X., Chen, J., 2022: Response of soil microbial biomass C, N, and P and microbial quotient to agriculture and agricultural abandonment in a meadow steppe of northeast China. Soil Till. Res. 223: 105475. https://doi.org/10.1016/j.still.2022.105475
Yang, N., Zou, D., Yang, M., Lin, Z., 2016: Variations in soil microbial biomass carbon and soil dissolved organic carbon in the re-vegetation of hilly slopes with purple soil. Plos One 11(12): e0166536. https://doi.org/10.1371/journal.pone.0166536
Yao, X., Yu, K., Wang, G., Deng, Y., Lai, Z., Chen, Y., Jiang, Y., Liu, J., 2019: Effects of soil erosion and reforestation on soil respiration, organic carbon and nitrogen stocks in an eroded area of Southern China. Sci. Total Environ. 683: 98–108. https://doi.org/10.1016/j.scitotenv.2019.05.221
Yu, K., Yao, X., Deng, Y., Lai, Z., Lin, L., Liu, J., 2019: Effects of stand age on soil respiration in Pinus massoniana plantations in the hilly red soil region of Southern China. Catena 178: 313–321. https://doi.org/10.1016/j.catena.2019.03.038
Zeng, Z., Wang, S., Zhang, C., Tang, H., Li, X., Wu, Z., Luo, J., 2015: Soil microbial activity and nutrients of evergreen broad-leaf forests in mid-subtropical region of China. J. For. Res. 26(3): 673–678. https://doi.org/10.1007/s11676-015-0060-x
Zhang, C., Wang, J., Liu, G., Song, Z., Fang, L., 2019: Impact of soil leachate on microbial biomass and diversity affected by plant diversity. Plant Soil 439: 505–523. https://doi.org/10.1007/s11104-019-04032-x
Zhang, J., Zhang, M., Huang, S., Zha, X., 2020: Assessing spatial variability of soil organic carbon and total nitrogen in eroded hilly region of subtropical China. Plos One 15(12): e0244322. https://doi.org/10.1371/journal.pone.0244322
Zhao, F., Wu, Y., Hui, J., Sivakumar, B., Meng, X., Liu, S., 2021: Projected soil organic carbon loss in response to climate warming and soil water content in a loess watershed. Carbon Balance Manag. 16: 24. https://doi.org/10.1186/s13021-021-00187-2
Zhao, P., Li, L., Lin, L., Zhai, G., Cruse, R.M., Wang, E., 2022a: Response of surface soil nutrients and organic carbon fractions to tillage erosion vs. water erosion in an agricultural landscape. Soil Sci. Soc. Am. J. 86(6): 1470–1482. https://doi.org/10.1002/saj2.20461
Zhao, J., Luo, D., Yu, Y., Yang, S., Zhang, J., Cao, G., 2022b: Soil pH changes in a small catchment on the Chinese Loess Plateau after long-term vegetation rehabilitation. Ecol. Eng. 175: 106503. https://doi.org/10.1016/j.ecoleng.2021.106503
Zheng, X., Yan, M., Lin, C., Guo, B., Ding, H., Yu, J., Peng, S., Sveen, T.R., Zhang, Y., 2022: Vegetation restoration types affect soil bacterial community composition and diversity in degraded lands in subtropical of China. Restor. Ecol. 30(1): e13494. https://doi.org/10.1111/rec.13494
Zhou, H., Zhang, D., Wang, P., Liu, X., Cheng, K., Li, L., Zheng, J., Zhang, X., Zheng, J., Crowley, D., van Zwieten, L., Pan, G., 2017: Changes in microbial biomass and the metabolic quotient with biochar addition to agricultural soils: A Meta-analysis. Agric. Ecosyst. Environ. 239: 80–89. https://doi.org/10.1016/j.agee.2017.01.006
© 2023 by the authors. Submitted for possible open access publication under the
terms and conditions of the Creative Commons Attribution (CC BY) license (http://creativecommons.org/licenses/by/4.0/).
Author's address:
Huseyin Sensoy, PhD *
e-mail: hsensoy61@gmail.com
Bartın University
Faculty of Forestry
Forest Engineering
Agdaci Yerleskesi
74100, Bartın
TÜRKIYE
Received: April 05, 2023
Accepted: November 09, 2023
Original scientific paper