The Use of Recycled Wood as a Factor in Production Efficiency of Manufacturers in V4 Countries
doi: 10.5552/crojfe.2024.2395
volume: 45, issue: 2
pp: 12
- Author(s):
-
- Staňková Michaela
- Pipíška Tomáš
- Article category:
- Original scientific paper
- Keywords:
- efficiency, recycle material, technology, V4 countries
Abstract
HTML
This article deals with a quantitative assessment of the production efficiency of wood-processing enterprises in the V4 countries. Efficiency was calculated through a non-parametric method of data envelopment analysis. This method allows the construction of an efficiency frontier without having to make any assumptions about its shape. The analyses are based on the financial statements of individual companies from 2018 to 2021. Efficiency assessments are therefore based on the actual performance of individual companies (i.e., quantities of output, costs, and capital). This micro perspective allows us to examine differences in efficiency not only by country but also by company size. A total of 10 companies have been selected in the V4 countries that can be identified as actively using recycled material in their production. The results of our empirical analyses show that this group of »recyclers« performs better than other market players in terms of median efficiency. Even in 2020, which can be marked as the beginning of the Covid-19 pandemic, overall, these companies had better results. Our results also show that the efficiency is significantly affected by company size (which is also reflected in economies of scale).
The Use of Recycled Wood as a Factor in Production Efficiency of Manufacturers in V4 Countries
Michaela Staňková, Tomáš Pipíška
Abstract
This article deals with a quantitative assessment of the production efficiency of wood-processing enterprises in the V4 countries. Efficiency was calculated through a non-parametric method of data envelopment analysis. This method allows the construction of an efficiency frontier without having to make any assumptions about its shape. The analyses are based on the financial statements of individual companies from 2018 to 2021. Efficiency assessments are therefore based on the actual performance of individual companies (i.e., quantities of output, costs, and capital). This micro perspective allows us to examine differences in efficiency not only by country but also by company size. A total of 10 companies have been selected in the V4 countries that can be identified as actively using recycled material in their production. The results of our empirical analyses show that this group of »recyclers« performs better than other market players in terms of median efficiency. Even in 2020, which can be marked as the beginning of the Covid-19 pandemic, overall, these companies had better results. Our results also show that the efficiency is significantly affected by company size (which is also reflected in economies of scale).
Keywords: efficiency, recycle material, technology, V4 countries
1. Introduction
Over recent decades, environmental changes and the bark beetle calamity have marked the start of a new era for forestry and wood-based composites. The wood-based composite industry that mainly uses spruce began to face new challenges. The lack of spruce opened up possibilities for using recycled wood. So much wood was incorporated into buildings in the past that, with the deconstruction of old buildings these days, the potential to reuse it arises. Another source of wood for recycling is packaging materials (pallets, wooden boxes, etc.). Wood waste, especially in the large construction parts of buildings, is a long-term CO2 sink and potential source of raw material. Wood waste can help to solve some of the problems with increasing wood consumption. The benefit is that wood extraction is distant from the forests and the utilization of the recycled wood in wood-based composites production increases the ecological demand for these products (Kim and Song 2014). The use of recycled wood is still at a low level; it is mostly incorporated in the middle layers of particleboards (Wan et al. 2014, Iždinský et al. 2020) or used as a source of energy (Hossain and Poon 2018). The low use of this resource is due to several different reasons. Manufacturing companies have to face issues of contamination (e.g. fasteners, coatings) and material diversity (e.g. wood species), which makes the manufacturing process more challenging. Another area of concern is logistics, as sources for this material are often widely dispersed and therefore accumulation/consolidation is usually problematic.
Some companies (Kronospan and Egger can be mentioned) are using recycled wood to make wood-based composites. For example, Egger claims to incorporate up to 30% recycled wood in its particleboard (EGGER 2023). Kronospan – Novopan Træindustri (Denmark) – transformed over 270,000 tons of recycled wood into new particleboard in 2021 (Kronospan 2021). However, these companies had to significantly modify their original production lines in order to systematically use recycled wood as an input material. Although financial data on these investments are not available, it can be assumed that the money involved was considerable. Given that particleboard production can be considered low-margin commodity production, it is assumed that economies of scale (and therefore potentially the size of the company) will have a significant impact on the profitability of the company.
The market for wood-based composites and the use of recycled wood in their production is inconsistent across the world. In the US, recycled wood is rarely used in production, in Western Europe the demand is enormous, while in Eastern European countries it is decreasing. Based on this knowledge, the four countries of the Visegrad Group (V4) – Czechia, Hungary, Poland and Slovakia – were selected to analyse production efficiency because there is some homogeneity and similar conditions in the wood-based panel industries in these countries.
A recent industry-wide challenge was the Covid-19 pandemic, which affected timber prices – see, for example, Tao et al. (2021). The production of oriented strand board (OSB) presents an example of dramatic change. When Covid-19 began and the price of the virgin material for the production of OSB increased, its retail price tripled. The same price trend was observed in particleboard production, although it uses a significant amount of recycled wood whose price actually remained stable. Considering the amount of wood incorporated in traditional brick-and-wood buildings, this price stability makes recycled wood from demolition a potentially valuable source of material for wood-based composite production. During the pandemic years there was a problem not only with the price of wood but also with its volume. There was not enough material on the market for OSB production and some companies recorded a lower output, which affected the final price of the product. It can therefore be assumed that the use of recycled material may have represented a certain competitive advantage for companies during the pandemic and had a positive effect on their performance during this difficult period.
Increasing emphasis is placed these days on the possibilities of recycling materials and, in general, on developing a circular economy. There are considerable efforts to develop new composite materials from already used sources – see, for example, Kromoser et al. (2022) or Iždinský et al. (2020). However, such studies only cover one side of the matter, typically the technical side. Without adequate economic analysis, it is not possible to adequately investigate whether the widespread use of these materials is realistic in business practice. The market for wood production is not sufficiently researched in this respect. There is only information from the construction sector about problems with low material efficiency (meaning in terms of yield and conversion efficiency) (Hertwich 2019) or labour productivity (Křetínská and Staňková 2021). Some research focuses on a specific area of efficiency, for example Risse et al. (2019), who looked at eco-efficiency, or Švajlenka and Kozlovská (2020), who examined efficiency associated with sustainability in the field of wood construction. However, most of the research carried out to date has been qualitative and has typically lacked a micro-economic view of enterprises in the wood manufacturing sector.
In contrast to other studies, this article will focus on the quantitative analysis of the production possibilities of individual companies and evaluate the efficiency of individual entities in the market. The evaluation of efficiency (referred to as production efficiency or in some sources as technical efficiency) has been used with success in various related fields. In the European manufacturing sector, for example, the metallurgical sector has been studied by Krejčí and Staňková (2022) and Bracke et al. (2019), while the automotive sector is in the scope of Kovárník and Staňková (2023) and Neves et al. (2022). Unfortunately, there are not yet similar studies on the wood production sector in European countries.
Unlike studies such as Krejčí and Staňková (2022) or Bracke et al. (2019), this paper will not focus on aggregated macro-data, but instead our analyses will be based on the financial micro-data of individual companies, which will allow us to bring a more detailed economic perspective to the investigated issue, because working with data on individual companies also allows us to investigate other aspects affecting efficiency. It is possible to follow the research of Staňková et al. (2022), where the efficiency of the forestry and logging sector was compared in different countries as well as with regard to the size of the company. The main objective of this article can be divided into the following areas:
calculating the efficiency of companies in the wood manufacturing sector
comparing efficiency at the level of individual countries
evaluating efficiency by company size
comparing the efficiency of companies using recycled material with others in the market
testing our hypothesis that, during the pandemic, the use of recycled material created an advantage for companies with a positive effect on their performance.
Our research is not just a matter of compiling a ranking of companies operating in a given sector, but a comprehensive view of the investigated issue, which will make it possible to find out whether the use of recycled materials facilitates the healthy functioning of companies in this sector.
The structure of this paper is as follows: the Methods and Data sections describe the data as well as the non-parametric and parametric methods used to obtain the results (including robustness checks). The Empirical Results chapter presents the results of the efficiency analysis both from the perspective of individual countries and relative to company size. This chapter also includes an assessment of the efficiency of companies with a high recycled material rate compared to other competitors in the sector. The results of our analyses are reviewed in the Discussion section. Finally, brief conclusions are provided.
2. Materials and Methods
2.1 Methods of Efficiency Evaluation
Both parametric and non-parametric methods can be used to evaluate efficiency. However, each approach makes different assumptions and therefore has strengths and weaknesses. However, all methods have in common that they compare a company's production output from specific inputs. On the basis of this information, an efficiency frontier (similar to the production possibilities frontier) is drawn up, which represents the area of full efficiency of the company. Inefficiency is then measured precisely against this frontier. The result of the calculation varies depending on the method used.
The method most often used in practice is non-parametric data envelopment analysis (DEA) (Odeck and Brathen 2012). In the first 40 years after it was developed (i.e., 1978 to 2016), this method was used in more than 10,000 published research papers (Emrouznejad and Yang 2018). Due to the wide application of this method in various scientific fields, we used it for our analyses.
When applying the DEA method, it is necessary to make several assumptions, specifically regarding the method of measuring inefficiency, the orientation of the model and the expected returns to scale. Given that the dataset includes companies of various sizes, a model assuming variable returns to scale was chosen. In the case of inefficient units, the state of full efficiency was derived using the radial method of measurement, which assumes (depending on the model orientation setting) either a proportional reduction of inputs or, on the contrary, a proportional increase of outputs of the monitored company. If, in terms of the resulting calculations, the company under investigation is in the set of feasible solutions (it is therefore marked as inefficient), it is possible to link the company to the origin (point 0) through this method of measurement by means of a straight line that also crosses the efficiency frontier at a certain point. This point then represents the potential ideal state (production volume and input volume) for this inefficient company. If the model is set with output orientation, the inefficient company will have to increase its outputs to the level of the newly found point due to the guided line. Conversely, if a model with an input orientation is choosen, the company will have to reduce the amount of inputs used.
The final area that needed to be addressed was the orientation of the model itself. As companies in the selected sector (i.e., NACE Code 16: Manufacture of wood and of products of wood and cork, except furniture; manufacture of articles of straw and plaiting materials) have more influence over their inputs, input orientation of the model like in Obi and Visser (2018) was chosen. Selecting the setting in this way made it a so-called Banker, Charnes, and Cooper (BCC) model (Banker et al. 1984) with input orientation, where the efficiency of the company o (o=1, ..., n) is evaluated by solving the linear program:
![]() (1)
(1)
subject to
 (2)
(2)
 (3)
(3)
 (4)
(4)
 (5)
(5)
Where:
 are the given input and output matrices
e is a row vector with all elements unity
λ is a column vector with all elements non-negative
θ is a scalar.
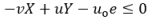
The dual form of this linear program can be expressed as:
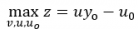 (6)
(6)
subject to
 (7)
(7)
 (8)
(8)
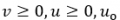 (9)
(9)
Where:
v and u vectors of input and output weights
z and uo scalars
uo can take on arbitrary values, as it represents a deviation from the constant return to scale.
Using the model set up in this way, the best companies get an efficiency score (in the objective function) equal to one. As it can be assumed that several companies will achieve this result, in order to make a comparison between them, the BCC-input model was estimated in a variant of the so-called super-efficiency models. These are modified models in which one of the units is excluded as a point for constructing the efficiency frontier. To construct the efficiency frontier in the model with super-efficiency, the weights of this particular unit are set to equal zero – which leads to this unit being omitted from the set of monitored units; thus, the shape of the efficiency frontier is modified. Thanks to this, the best companies can obtain efficiencies (in the objective function) higher than 1 and thus be super-efficient.
The use of the non-parametric DEA method, in contrast with competing approaches, allowed us also to calculate the Malmquist productivity index, which can be decomposed to analyse not only changes in the efficiency of individual companies, but also changes in their production possibilities. The Malmquist index allows the calculation of growth coefficients in two different time periods. This calculation allowed us to test the hypothesis that companies with a high recycled material recovery rate had an advantage at the time of the Covid-19 pandemic, so for the period 2020 (which can be considered as the beginning of the pandemic in Europe) the Malmquist index was calculated. To calculate the index from 2019 to 2020, it was necessary to construct four linear programming problems (i.e., solve the four BCC DEA models described above) combining information from two time periods. The Malmquist index (MI) can be defined as the geometric mean of two efficiency ratios (E), where one is the efficiency change measured by the 2019 technology and the other is the efficiency change measured by the 2020 technology:
 (10)
(10)
Technical details regarding the DEA method and models used can be found in Cooper et al. (2007). DEA models were constructed in the program DEA SolverPRO version 15f.
2.2 Further Analysis of BCC-input Model Results
The efficiency values obtained using the BCC-input model were further investigated to see if a link could be found between the level of efficiency and the size of the company. The size of the company was determined according to a commonly used metric that takes into account both the number of employees in the company and its annual turnover and total assets. Detailed values for the breakdown of enterprises can be found directly in the Orbis Bureau van Dijk database.
We also examined whether the level of efficiency was different in different countries. For this purpose, it was possible to use ANOVA analysis. However, it could be assumed that the resulting efficiency values would not meet the assumption of normality, so instead of ANOVA analysis, its non-parametric version, i.e., Kruskal–Wallis analysis, was used as in Kovárník and Staňková (2023). This test uses ranks of data, rather than numeric values, to compute the test statistics. As a result, the chi-square statistic is used instead of the F-statistic used in classical ANOVA.
The Kruskal–Wallis test made it possible to test whether the country or the size of the company was a statistically significant factor in the evaluation of efficiency. However, it was necessary to use another tool for detailed analysis when determining the differences between individual pairs. Similarly to Landekić et al. (2023), we used a test based on counted ranks, i.e., the Mann-Whitney test, to test the hypothesis that companies using a high degree of recycled material have greater efficiency than their market competitors. The same procedure can be applied to results obtained by calculating the Malmquist production index. Thus, these tests were also used to test the last sub-objective, i.e., the hypothesis of the better performance of companies using recycled materials at the start of the Covid-19 pandemic.
All the tests mentioned were compiled in the MATLAB computing system (version 2023a). The technical details of the calculation can be found under the »kruskalwallis« and »multcompare« functions.
2.3 Checking the Robustness of Efficiency Results
The DEA method (and thus also the derived efficiency values) is criticised mainly because of its deterministic nature. The calculated efficiency is taken as relative. Even for units labelled as efficient, there is still room for improvement. Because of this property, the DEA method is very sensitive to outliers/leverage points or to the omission of an important variable. Staňková (2020) therefore recommends checking the robustness of the results using the competitive parametric stochastic frontier analysis (SFA) method, which reflects the fact that there are random influences beyond the control of individual companies that affect their level of output. Each company is exposed to different influences. However, it can be assumed that these act randomly and can be described by a joint probability distribution.
However, the SFA method is criticised mainly because the econometric estimation of efficiency can produce inconsistent parameter estimates. This problem can at least be minimised when working with panel models as in Staňková and Hampel (2021). Due to the unbalanced data set (a detailed description of the dataset is given in Section 2.4), it was not possible to use SFA panel models according to Greene (2005). For this reason, we replicated the procedure from Staňková et al. (2022) and used the pooled SFA model. Kumbhakar et al. (2015) define a production function-based SFA model using two equations:
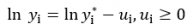 (11)
(11)
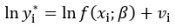 (12)
(12)
Where:
yi represents the observed (real) output scalar of the i-th unit (i=1,…,I)
xi is the vector of N inputs of the unit I
β is a vector of technological parameters
ui represents the inefficiency of the i-th unit
vi is a random error (noise) with zero mean value
f(xi;β) represents the production frontier (defined using a specific production function).
Due to the nature of the data, the Cobb-Douglas form was chosen as the functional form for the production function, which is one of the most common in practice. For the other settings of the SFA method, we used the most proven procedures in practice. To estimate the efficiency, we used the procedure according to Jondrow et al. (1982) and assumed a half-normal probability distribution for the inefficiency term. Technical details regarding SFA models and related procedures can be found in Kumbhakar et al. (2015). The models described in this section were estimated using the STATA computing system (version SE 16) using the »sfcross« function.
2.4 Data Used
Annual financial data for the analyses were obtained from the Orbis Bureau van Dijk database, which collects various pieces of information about companies including accounting information (corresponding to information from, for example, the balance sheet and the profit and loss statement). Our analyses covered the years 2018 to 2021, the four most recent periods available. In this time frame, we found data for ten companies included among the key companies using recycled material. Table 1 shows these companies that include representatives from all countries in the V4 group. Slovakia is represented by KRONOSPAN, S.R.O., Hungary by KRONOSPAN-MOFA and a total of three companies were selected from the Czech Republic: DREVOZPRACUJICI DRUZSTVO, KRONOSPAN OSB, SPOL. S R.O. and KRONOSPAN CR, SPOL. S R.O. The remaining companies in Table 1 are listed as Polish companies. Unfortunately, the two Kronospan companies did not provide the necessary information for 2021. As we did not want to lose information about the remaining years of these companies, we decided to use an unbalanced panel of data.
Table 1 List of companies included in the category of companies using recycled material
|
DREVOZPRACUJICI DRUZSTVO |
KRONOSPAN POLSKA SP. Z O.O. |
|
KRONOSPAN OSB, SPOL. S R.O. |
KRONOSPAN OSB SP. Z O.O. |
|
KRONOSPAN CR, SPOL. S R.O. |
KRONOSPAN KO SP. Z O.O. |
|
KRONOSPAN-MOFA |
EGGER BISKUPIEC SP. Z O.O. |
|
KRONOSPAN MIELEC SP. Z O.O. |
KRONOSPAN, S.R.O. |
The data set was subsequently expanded to include information on other companies in the V4 countries involved in NACE Code 16 activity. Limiting our scope to V4 countries provided sufficient homogeneity, which is a prerequisite for the methods used. At the same time, it also provided a sufficient number of observations in individual groups – i.e., both by geographical area (country) and by company size: see Table 2. In total, we had data from 1843 companies. Small businesses are most abundantly represented in this sector. The most representatives are those from Slovakia.
Table 2 Number of companies in individual countries and number of companies by size
|
Factor |
Number of companies (reduced in 2021) |
Total (reduced in 2021) |
|
Country |
Czech Rep. 109 (107); Hungary 47, Poland 331, Slovakia 1356 |
1843 (1841) |
|
Size |
Very large 22 (20); large 77; medium 474; small 1270 |
1843 (1841) |
Taking into account the availability of data, we selected a total of five variables that have a significant effect on the transformation process of the company. Each company's output is represented by the variable operating revenue (turnover). Four input variables were selected. The labour factor represents the cost of employees, so possible differences were considered in wage levels between countries. The capital factor was conceived in its tangible form – in accounting, it was thus conceived as the total assets of the company. In order to take into account the different financial strategies of the companies, a variable representing the company's equity capital was added. Due to multicollinearity, it was not appropriate to combine total capital, equity capital and foreign resources in the models at the same time. However, as evidenced by the results of Staňková and Hampel (2018), the combination of two variables already allows the model to take into account the different financial strategies of companies. Finally, a variable was selected to include material costs. This variable is key to evaluating efficiency taking different input materials into account. All variables were included in the models in thousands of euros. An overview of the variables, including references to publications from other sectors in which the selected variables have been successfully used previously, can be found in Table 3.
Table 3 List of variables including studies where they were used
|
Variable |
Source |
|
Operating revenue (turnover) |
Gaebert and Staňková (2020), Mariani and Visani (2019), Storto (2018), Khoshnevis and Teirlinck (2018) |
|
Cost of employees |
Kováník and Staňková (2023), Zhong et al. (2022), Staňková and Hampel (2020) |
|
Total assets |
Staňková et al. (2022), Stefanoni and Voltes-Dorta (2021), Varvařovská and Staňková (2021) |
|
Capital (equity) |
Lan et al. (2022), Staňková et al. (2022), Wanke et al. (2020), Staňková and Hampel (2018) |
|
Material costs |
Baležentis et al. (2022), Gong et al. (2019), Staňková and Hampel (2018) 1 |
|
1 In our study, as well as in Staňková and Hampel (2018), the total material costs were taken. In studies by Baležentis et al. (2022) and Gong et al. (2019) only part of material costs was used |
|
3. Results
If the focus was to be on the evaluation of the entire sector in all V4 countries, according to the DEA BCC input-oriented model, the median (in)efficiency would be around 32%. However, in each year, several companies were marked as efficient or outright super-efficient. Their percentage ranged from 12% to 14%. For example, SWISS KRONO SP. Z O.O., KRONOSPAN POLSKA SP. Z O.O., KONSIT A.S. and SIMPLY CONSULT, S.R.O. ranked among the top companies throughout the monitored period.
In more detailed analyses, it was found that Czech companies generally achieved the highest efficiency results: see Table 4 with median values. Hungary had the highest median efficiency only in 2018, but in the 2019 and 2020 year, the Czech Republic was the contry with the highest median efficiency. However, during testing, it was found that the differences between individual countries are not statistically significant in any of the monitored periods. It can therefore be concluded that the country factor is not statistically significant for efficiency analysis in this sector. On the contrary, analyses based on company size have already proven to be statistically significant. Table 5 shows the median values for individual companies according to their size.
Table 4 Median DEA BCC efficiency values for individual countries
|
Year |
Country |
Median |
Year |
Country |
Median |
|
2018 |
Czech Rep. |
0.3242 |
2018 |
Hungary |
0.3832 |
|
2019 |
Czech Rep. |
0.3446 |
2019 |
Hungary |
0.3161 |
|
2020 |
Czech Rep. |
0.3720 |
2020 |
Hungary |
0.3674 |
|
2021 |
Czech Rep. |
0.3203 |
2021 |
Hungary |
0.3109 |
|
2018 |
Poland |
0.3149 |
2018 |
Slovakia |
0.3065 |
|
2019 |
Poland |
0.3058 |
2019 |
Slovakia |
0.3167 |
|
2020 |
Poland |
0.3296 |
2020 |
Slovakia |
0.3271 |
|
2021 |
Poland |
0.3183 |
2021 |
Slovakia |
0.3270 |
From the results given in Table 5, it is evident that very large and large companies achieved higher efficiency levels than smaller ones. The Kruskal-Wallis test confirmed the significance of the company size factor in all monitored periods (all p-values <0.001). By testing individual pairs, it was confirmed that there were two groups of companies in terms of efficiency. One group consists of very large and large companies, which do not have a statistically significant difference between them but show a significant difference from small and medium-sized companies. There was no statistically significant difference in the level of efficiency between small and medium-sized companies. These identified links were unchanged throughout the monitored period.
Table 5 Median DEA BCC efficiency values according to company size
|
Year |
Company size |
Median |
Year |
Company size |
Median |
|
2018 |
Very large |
0.8296 |
2018 |
Large |
0.6050 |
|
2019 |
Very large |
0.7952 |
2019 |
Large |
0.5856 |
|
2020 |
Very large |
0.7887 |
2020 |
Large |
0.6204 |
|
2021 |
Very large |
0.8437 |
2021 |
Large |
0.5773 |
|
2018 |
Medium sized |
0.2978 |
2018 |
Small |
0.2902 |
|
2019 |
Medium sized |
0.2986 |
2019 |
Small |
0.3063 |
|
2020 |
Medium sized |
0.3290 |
2020 |
Small |
0.3110 |
|
2021 |
Medium sized |
0.3054 |
2021 |
Small |
0.3193 |
3.1 Comparison of Efficiency Based on Recycled Material Use
To compare the efficiency of the 10 selected companies (hereinafter referred to as »recyclers«), it was necessary to take into account the results obtained above. All 10 companies fall into the categories of large or very large companies, which were found to have a higher level of efficiency than smaller businesses. For this reason, small and medium-sized enterprises were completely excluded from this sub-analysis. In Table 6, the results are recorded separately for "recyclers" and other very large and large companies.
The biggest difference between the two groups can be seen in 2018, when the disparity in medians was over 30 percentage points. In 2019 and 2020, the differences were reduced to the level of 20 percentage points; in 2021, the differences were very similar to the situation in 2018. These differences were statistically verified. On the basis of the Mann-Whitney test (with a commonly used 5% level of significance), it can be stated that the recyclers had notably higher efficiency values in all observed years than other larger companies in the sector: see the p-values in Table 6.
Table 6 Median DEA BCC efficiency values of two artificially created groups – recyclers and other larger companies
|
Year |
Group |
Median |
p-value |
|
2018 |
Recyclers |
0.9458 |
0.0127 |
|
Others |
0.6411 |
||
|
2019 |
Recyclers |
0.8635 |
0.0281 |
|
Others |
0.6286 |
||
|
2020 |
Recyclers |
0.8551 |
0.0106 |
|
Others |
0.6595 |
||
|
2021 |
Recyclers |
0.8956 |
0.0042 |
|
Others |
0.6031 |
For these two defined groups, the impact of the Covid-19 pandemic on their performance in 2020 was investigated by decomposing the Malmquist index. Our hypothesis is that due to the large amount of recycled material, which maintained a relatively constant price during the pandemic, recyclers achieved better performance. The median results of the Malmquist index itself as well as its two components (changes in efficiency and changes in the production possibilities frontier) for the period 2019/2020 are reported in Table 7.
Table 7 Medians of the Malmquist index, efficiency changes and shifts in the production possibilities frontier of the two groups – recyclers and other larger companies – for the period 2019/2020
|
Variable |
Group |
Median |
p-value |
|
Malmquist index |
Recyclers |
1.0160 |
0.0245 |
|
Others |
0.9629 |
||
|
Efficiency change |
Recyclers |
1.0488 |
0.3232 |
|
Others |
1.0428 |
||
|
Frontier shift |
Recyclers |
0.9771 |
0.0245 |
|
Others |
0.9253 |
It was confirmed that recyclers had higher median values in all three monitored indicators. In the case of a frontier shift, the median value was less than one, indicating a decline in production possibilities (which occurred for both groups of companies) triggered by the Covid-19 pandemic. However, the decline is not as substantial for recyclers as for other companies. Moreover, according to the p-value, this is a statistically significantly better result for recycler enterprises. In terms of efficiency, the two groups produced almost identical results, which is confirmed by the p-value that does not reject the null hypothesis of equality of medians. As the Malmquist index is composed of both components, it is logical that due to the better performance of recyclers in terms of production possibilities, the index itself is higher for this group. In addition, the recyclers had a median Malmquist index value greater than one, indicating an improvement in the overall performance of this group of companies. In contrast, the median value for the other large companies was less than one, i.e., in general the companies in this group deteriorated in their performance. According to the p-value, the better overall performance of recyclers is statistically significant.
3.2 Checking the Robustness of Results
The main findings from the results of the BCC input-oriented model were verified using the competitive SFA method to ensure their robustness. The first significant finding in the evaluation of efficiency was the identification of the size of the company as a factor influencing efficiency. Table 8 shows the median efficiency values found using the SFA model. In the case of the SFA method, the differences between individual categories were not as significant in absolute values as in the case of the DEA method. However, even according to the SFA method, it can be seen that as the size of the company increases, so does the level of efficiency. According to the Kruskal-Wallis test, even in the case of the SFA method, the company size factor is statistically significant (all p-values <0.001).
Table 8 Median SFA efficiency values according to company size
|
Year |
Company size |
Median |
Year |
Company size |
Median |
|
2018 |
Very large |
0.7440 |
2018 |
Large |
0.7299 |
|
2019 |
Very large |
0.7399 |
2019 |
Large |
0.7243 |
|
2020 |
Very large |
0.7366 |
2020 |
Large |
0.7236 |
|
2021 |
Very large |
0.7473 |
2021 |
Large |
0.7333 |
|
2018 |
Medium sized |
0.7155 |
2018 |
Small |
0.7023 |
|
2019 |
Medium sized |
0.7131 |
2019 |
Small |
0.6973 |
|
2020 |
Medium sized |
0.7102 |
2020 |
Small |
0.6907 |
|
2021 |
Medium sized |
0.7174 |
2021 |
Small |
0.6916 |
The only difference was identified in sub-analyses using the Mann-Whitney test. Based on the results of the SFA model, only small companies were separated. Here, too, two groups were created, but with the difference that one group consisted of small companies and the other group of medium-sized, large and very large companies.
The second significant finding was related to the efficiency of the 10 selected companies from Table 1. The median efficiencies of these companies (and their competitors) can be found in Table 9 based on the results of the SFA method. Even in this case, the median efficiencies of the 10 selected companies are greater than those of others in the sector. At the standard 5% level of significance, these values are statistically significantly higher.
Table 9 Median SFA efficiency values of two groups – recyclers and other larger companies
|
Year |
Group |
Median |
p-value |
|
2018 |
Recyclers |
0.7339 |
0.0457 |
|
Others |
0.7083 |
||
|
2019 |
Recyclers |
0.7388 |
0.0437 |
|
Others |
0.7047 |
||
|
2020 |
Recyclers |
0.7408 |
0.0216 |
|
Others |
0.7002 |
||
|
2021 |
Recyclers |
0.7473 |
0.0131 |
|
Others |
0.7037 |
4. Discussion
Our analysis showed that there were no statistically significant differences in the level of efficiency across the V4 countries, perhaps as a consequence of the increasing interdependence of the V4 economies. According to Long et al. (2019), Li et al. (2017) and Kaplinsky and Readman (2005), globalisation is an important issue in the woodworking sector. According to Long et al. (2019), who conducted one of the most comprehensive analysis of the global market between 2004 and 2016, there are still significant disparities in the world, mainly due to unevenly distributed forest resources. Li et al. (2017) state that economic integration must go hand in hand with forest transformation to achieve globalisation. The economies of the V4 countries are already so interconnected that their enterprises have very similar conditions for their production activities and the geographical aspect has become irrelevant when assessing production efficiency. The production process and sales are now dispersed across national borders. For example, a company with its headquarters and production in the Czech Republic imports materials from Poland and sells the final products not only in the Czech Republic but also in Germany.
Although there are no differences across the V4 countries, significant differences in the level of efficiency with respect to company size have been identified. This is associated with other economic sectors that use a different technology or have a different business focus (Kovárník and Staňková 2023 and Shao and Lin 2016). In the sector we analysed (NACE code 16), investment in new technologies that will affect the production process of companies is certainly essential. Yumauchi et al. (2009) point out that it is necessary to consider not only the cost of purchasing new equipment (machines or other techniques), but also the considerable cost of training workers. As these are significant investments in absolute terms, they are most affordable by large companies. Based on our results, the efficiency of large companies is therefore generally higher than that of smaller competitors.
However, according to Thatcher and Oliver (2015), strategy in investing in manufacturing companies is a more complex issue than productivity and efficiency. They stress that this problem cannot be generalised implying that a new investment will automatically increase the productivity and efficiency of the enterprise. Their research has shown that in some cases investment in certain efficiency-enhancing technologies may be expected to decrease the productivity of profit-maximising companies. The main problem they see is that investments in technology that reduce fixed costs do not sufficiently motivate the company to tend to improve the quality of its products, as it is often satisfied with increasing profitability.
When assessing the return on investment, it is also necessary to take into account the time aspect. The increase in productivity, and consequently efficiency, comes only with a certain delay after the investment is made (Bartrel 2000), which is also a problem for small enterprises operating with a lower capital base. Large enterprises can afford to be loss-making for a certain period of time and still be able to finance production and pay workers. Small businesses cannot afford »business risk« on such a scale. According to Pirola et al. (2020), small and medium-sized enterprises (SMEs) have additional weaknesses compared to their larger competitors. According to their research, the managements of Italian SMEs have some difficulty in finding and implementing an appropriate strategy to respond to the Fourth Industrial Revolution. Researchers have found similar results in other geographic areas. For example, in Ghana by Quaye and Mensah (2019) and in the UK by Galbraith et al. (2017). It can therefore be assumed that the same problem is occurring in the V4 countries, which is reflected in very low efficiency of SMEs in our analysis.
Our empirical results show that within the category of large and very large companies, our selected group of companies that actively use recycled material outperforms the other companies in this category. The use of recycled material can be an economically crucial aspect for companies to achieve full efficiency. Timber prices have risen steadily in recent years (Sommerhuber et al. 2015). As already mentioned, there was another dramatic increase in the price of this material during the pandemic (Tao et al. 2021). The active use of recycled wood material can thus represent a major competitive advantage for companies, as the price for this material is lower than for non-recycled material. This was reflected in our analysis through higher median efficiency values. However, companies need to have adequately prepared production lines for production from recycled material, which requires significant upfront investment. These investments are typical for large companies that have sufficient capital and can afford to take some risk in their financial strategy (including temporary losses in accounting). National governments should therefore focus their attention on SMEs and seek to actively support these enterprises to engage in production using recycled materials.
The statistically significant out-performance of recyclers was also observed in the context of changes in the production possibilities frontier (for the period 2019/2020) and consequently in the overall Malmquist index. Thus, it can be concluded that the use of this material was a benefit to companies even during the Covid-19 pandemic. We believe that these companies have not fewer problems from fluctuations in supply prices and probably also with obtaining supplies of recycled material.
In order to fully address the impact of the Covid-19 pandemic, it would be advisable to repeat the analysis several years after its onset. As our research only covers the period from 2018 to 2021, the possibilities of assessing the impact of the pandemic are limited. The use of DEA method, which is a deterministic method, can also be considered as another limitation in our research. This method is very susceptible to the correctness of the data and hence the choice of input and output variables. To minimise the subjectivity of variable selection, we chose the variables that have already been used (either in the selected sector or at least in economically related sectors). Even when choosing a specific DEA model setup, we followed the recommendations of other researchers. The choice of a particular model setting determines the resulting efficiency values of individual companies. We believe that, given the type of data, an adequate model has been chosen that gives realistic results.
5. Conclusions
This article deals with a quantitative assessment of the production efficiency of wood processing enterprises in the V4 countries. The results of these analyses showed that there are no statistically significant differences in efficiency across V4 countries in this sector. Conversely, statistically significant differences in efficiency by company size were identified through the inclusion of a micro perspective. It was also found that the 10 companies identified as »recyclers« performed consistently better based on efficiency assessment. The use of this material gave them some competitive advantage even in the uncertain times of the Covid-19 pandemic. The use of recycled materials therefore has positive impacts not only in terms of the environment, but also in terms of business performance. National governments should therefore focus on supporting small and medium-sized enterprises in particular to transform their production lines and adapt to production based on the use of these materials.
Acknowledgments
This article was supported by the grant No. A-MIVP-2021-002 of the Grant Agency of Gregor Johann Mendel by Mendel University in Brno.
6. References
Banker, R., Charnes, A., Cooper, W., 1984: Some models for estimating technical and scale inefficiencies in data envelopment analysis. Management science 30(9): 1078–1092. http://dx.doi.org/10.1287/mnsc.30.9.1078
Bartel, A.P., 2002: Measuring the Employer's Return on Investments in Training: Evidence from the Literature. Industrial Relations: A Journal of Economy and Society 39(3): 375–551. https://doi.org/10.1111/0019-8676.00178
Baležentis, T., Dabkienė, V., Štreimikienė, D., 2022: Eco-efficiency and shadow price of greenhouse gas emissions in Lithuanian dairy farms: An application of the slacks-based measure. Journal of Cleaner Production 356: 131857. https://doi.org/10.1016/j.jclepro.2022.131857
Bracke, S., Radetzky, M., Rosebrock, C., Ulutas, B., 2019: Efficiency and effectivity of high precision grinding manufacturing processes: An approach based on combined DEA and cluster analyses. Procedia CIRP 79: 292–297. https://doi.org/10.1016/j.procir.2019.02.069
Cooper, W.W., Seiford, M.L., Tone, K., 2007: Data envelopment analysis: a comprehensive text with models, applications, references and DEA-solver software, 2nd ed.; New York: Springer.
EGGER, 2023: Available online: https://www.egger.com/ (accessed on 10 April 2023)
Emrouznejad, A., Yang, G., 2018: A survey and analysis of the first 40 years of scholarly literature in DEA: 1978–2016. Socio-Economic Planning Sciences 61: 4–8. https://doi.org/10.1016/j.seps.2017.01.008
Galbraith, B., McAdam, R., Woods, J., McGowan, T., 2017: Putting policy into practice: an exploratory study of SME innovation support in a peripheral UK region. Entrepreneurship and Regional Development 29(7–8): 668–691. https://doi.org/10.1080/08985626.2017.1325939
Gaebert, T., Staňková, M., 2020: Efficiency Development in the German Pharmaceutical Market. Acta Universitatis agriculturae et silviculturae Mendelianae Brunensis 68(5): 877–884. https://doi.org/10.11118/actaun202068050877
Gong, X., Wu, X., Luo, M., 2019: Company performance and environmental efficiency: A case study for shipping enterprises. Transport Policy 82: 96–106. https://doi.org/10.1016/j.tranpol.2018.04.008
Greene, W.H., 2005: Reconsidering heterogeneity in panel data estimators of the stochastic frontier model. Journal of Econometrics 126(2): 269–303. https://doi.org/10.1016/j.jeconom.2004.05.003
Hertwich, E.H., Ali, S., Ciacci, L., Fishman, T., Heeren, N., Masanet, E., Asghari, F.N., Olivetti, E., Pauliuk, S., Tu, Q., 2019: Material efficiency strategies to reducing greenhouse gas emissions associated with buildings, vehicles, and electronics – a review. Environmental Research Letters 14(4): 043004. https://doi.org/10.1088/1748-9326/ab0fe3
Hossain, M.U., Poon, C.S., 2018: Comparative LCA of wood waste management strategies generated from building construction activities. Journal of Cleaner Production 177: 387–397. https://doi.org/10.1016/j.jclepro.2017.12.233
Iždinský, J., Vidholdová, Z., Reinprecht, L., 2020: Particleboards from Recycled Wood. Forests 11(11): 1166. https://doi.org/10.3390/f11111166
Jondrow, J., Lovell, C.A.K., Materov, I.S., Schmidt, P., 1982: On the estimation of technical inefficiency in the stochastic frontier production function model. Journal of Econometrics 19(2–3): 233–238. https://doi.org/10.1016/0304-4076(82)90004-5
Kaplinsky, R., Readman, J., 2005: Globalization and upgrading: what can (and cannot) be learnt from international trade statistics in the wood furniture sector? Industrial and Corporate Change 14(4): 679–703. https://doi.org/10.1093/icc/dth065
Khoshnevis, P., Teirlinck, P., 2018: Performance evaluation of R&D active firms. Socio-Economic Planning Sciences 61: 16–28. https://doi.org/10.1016/j.seps.2017.01.005
Kim, M.H., Song, H.B., 2014: Analysis of global warming potential for wood waste recycling systems. Journal of Cleaner Production 69: 199–207. https://doi.org/10.1016/j.jclepro.2014.01.039
Kovárník, R., Staňková, M., 2023: Efficiency of the Automotive Industry in the Visegrad Group. LOGI – Scientific Journal on Transport and Logistics 14(1): 12–23. https://doi.org/10.2478/logi-2023-0002
Krejčí, M., Staňková, M., 2022: The Position of the Czech Republic within the Metallurgical Sector. In Mathematical Methods in Economics 2022: Conference Proceedings. Vysoká škola polytechnická Jihlava, 193–198 p.
Kromoser, B., Reichenbach, S., Hellmayr, R., Myna, R., Wimmer, R., 2022: Circular economy in wood construction – Additive manufacturing of fully recyclable walls made from renewables: Proof of concept and preliminary data. Construction and Building Materials 344: 128219. https://doi.org/10.1016/j.conbuildmat.2022.128219
Kronospan, 2021: Sustainability Report 2021. Available online: https://www.kronospan-se.se/Files/Images/kronospan/Download/Baeredygtighedsrapport_2021_Kronospan_UK.pdf (accessed on 5 April 2023)
Křetínská, M., Staňková, M., 2021: Evaluation of the Construction Sector: a Data Envelopment Analysis Approach. In Mathematical Methods in Economics 2021: Conference Proceedings. Česká zemědělská univerzita v Praze, 287–292 p.
Kumbhakar, S.C., Wang, H., Horncastle, A.P., 2015: A Practitioner's Guide to Stochastic Frontier Analysis Using Stata, 1st ed.; Cambridge: Cambridge University Press.
Lan, X., Li, Z., Wang, Z., 2022: An investigation of the innovation efficacy of Chinese photovoltaic enterprises employing three-stage data envelopment analysis (DEA). Energy Reports 8(7): 456–465. https://doi.org/10.1016/j.egyr.2022.05.093
Landekić, M., Šporčić, M., Bačić, M., Pandur, Z., Bakarić, M., 2023: Workability and Physical Wellbeing Among Chainsaw Operators in Croatia. Croatian Journal of Forest Engineering 44(1): 83–94. https://doi.org/10.5552/crojfe.2023.2073
Li, L., Liu, J., Long, H., de Jong, W., Youn, Y., 2017: Economic globalization, trade and forest transition-the case of nine Asian countries. Forest Policy and Economics 76: 7–13. https://doi.org/10.1016/j.forpol.2015.12.006
Long, T., Pan, H., Dong, C., Qin, T., Ma, P., 2019: Exploring the competitive evolution of global wood forest product trade based on complex network analysis. Physica A: Statistical Mechanics and its Applications 525: 1224–1232. https://doi.org/10.1016/j.physa.2019.04.187
Mariani, M.M., Visani, F., 2019: Embedding eWOM into efficiency DEA modelling: An application to the hospitality sector. International Journal of Hospitality Management 80: 1–12. https://doi.org/10.1016/j.ijhm.2019.01.002
Neves, S.A., Marques, A.C., Moutinho, V., 2020: Two-stage DEA model to evaluate technical efficiency on deployment of battery electric vehicles in the EU countrie. Transportation Research Part D: Transport and Environment 86: 102489. https://doi.org/10.1016/j.trd.2020.102489
Obi, O.F., Visser, R., 2018: Including Exogenous Factors in the Evaluation of Harvesting Crew Technical Efficiency using a Multi-Step Data Envelopment Analysis Procedure. Croatian Journal of Forest Engineering 39(2): 153–162.
Odeck, J., Brathen, S., 2012: A meta-analysis of DEA and SFA studies of the technical efficiency of seaports: A comparison of fixed and random-effects regression models. Transportation Research Part A: Policy and Practice 46(10): 1574–1585. https://doi.org/10.1016/j.tra.2012.08.006
Pirola, F., Cimini, C., Pinto, R., 2020: Digital readiness assessment of Italian SMEs: a case-study research. Journal of Manufacturing Technology Management 31(5): 1045–1083. https://doi.org/10.1108/JMTM-09-2018-0305
Quaye, D., Mensah, I., 2019: Marketing innovation and sustainable competitive advantage of manufacturing SMEs in Ghana. Management Decision 57(7): 1535–1553. https://doi.org/10.1108/MD-08-2017-0784
Risse, M., Weber-Blaschke, G., Richter, K., 2019: Eco-efficiency analysis of recycling recovered solid wood from construction into laminated timber products. Science of The Total Environment 661: 107–119. https://doi.org/10.1016/j.scitotenv.2019.01.117
Shao, B.B.M., Lin, W.T., 2016: Assessing output performance of information technology service industries: Productivity, innovation and catch-up. International Journal of Production Economics 172: 43–53. https://doi.org/10.1016/j.ijpe.2015.10.026
Sommerhuber, P.F., Welling, J., Krause, A., 2015: Substitution potentials of recycled HDPE and wood particles from post-consumer packaging waste in Wood–Plastic Composites. Waste Management 46: 76–85. https://doi.org/10.1016/j.wasman.2015.09.011
Staňková, M., 2020: Efficiency Comparison and Efficiency Development of the Metallurgical Industry in the EU: Parametric and Non-parametric Approaches. Acta Universitatis agriculturae et silviculturae Mendelianae Brunensis 68(4): 765–774. https://doi.org/10.11118/actaun202068040765
Staňková, M., Hampel, D., 2021: On the Influence of Model Setting on Stochastic Frontier Analysis. Mathematical Methods in the Applied Sciences 44(1): 274–283. https://doi.org/10.1002/mma.6730
Staňková, M., Hampel, D., 2020: Efficiency Assessment of the UK Travel Agency Companies – Data Envelopment Analysis Approach. In Mathematical Methods in Economics 2020: Conference Proceedings. Mendelova univerzita v Brně, 550–556 p.
Staňková, M., Hampel, D., 2018: Efficiency Comparison in the Development of Building Projects Sector. In Mathematical Methods in Economics 2018: Conference Proceedings. MatfyzPress, 503–508 p.
Staňková, M., Hampel, D., Janová, J., 2022: Micro-Data Efficiency Evaluation of Forest Companies: The Case of Central Europe. Croatian Journal of Forest Engineering 43(2): 441–456. https://doi.org/10.5552/crojfe.2022.1541
Stefanoni, S., Voltes-Dorta, A., 2021: Technical efficiency of car manufacturers under environmental and sustainability pressures: A Data Envelopment Analysis approach. Journal of Cleaner Production 311: 127589. https://doi.org/10.1016/j.jclepro.2021.127589
Storto, C., 2018: Ownership structure and the technical, cost, and revenue efficiency of Italian airports. Utilities Policy 50: 175–193. https://doi.org/10.1016/j.jup.2018.01.003
Švajlenka, J., Kozlovská, M., 2020: Evaluation of the efficiency and sustainability of timber-based construction. Journal of Cleaner Production 259: 120835. https://doi.org/10.1016/j.jclepro.2020.120835
Tao, C., Diao, G., Cheng, B., 2021: The Dynamic Impacts of the COVID-19 Pandemic on Log Prices in China: An Analysis Based on the TVP-VAR Model. Forests 12(4): 449. https://doi.org/10.3390/f12040449
Thatcher, M.E., Oliver, J.R., 2015: The Impact of Technology Investments on a Firm's Production Efficiency, Product Quality, and Productivity. Journal of Management Information Systems 18(2): 17–45. https://doi.org/10.1080/07421222.2001.11045685
Varvařovská, V., Staňková, M., 2020: Does the Involvement of »Green Energy« Increase the Productivity of Companies in the Production of the Electricity Sector?. European journal of business science and technology 7(2): 152–164. https://doi.org/10.11118/ejobsat.2021.012
Wan, H., Wang, X.M., Barry, A., Shen, J., 2014: Recycling wood composite panels: Characterizing recycled materials. BioResources 9(4): 7554–7565. https://doi.org/10.15376/biores.9.4.7554-7565
Wanke, P., Tsionas, M.G., Chen, Z., Antunes, J.J.M., 2020: Dynamic network DEA and SFA models for accounting and financial indicators with an analysis of super-efficiency in stochastic frontiers: An efficiency comparison in OECD banking. International Review of Economics & Finance 69: 456–468. https://doi.org/10.1016/j.iref.2020.06.002
Yamauchi, F., Poapongsakorn, N., Srianant, N., 2009: Technical Change and the Returns and Investments in Firm-level Training: Evidence from Thailand. The Journal of Development Studies 45(10): 1633–1650. https://doi.org/10.1080/00220380903012748
Zhong, M., Huang, G., He, R., 2022: The technological innovation efficiency of China's lithium-ion battery listed enterprises: Evidence from a three-stage DEA model and micro-data. Energy 246: 123331. https://doi.org/10.1016/j.energy.2022.123331
© 2023 by the authors. Submitted for possible open access publication under the
terms and conditions of the Creative Commons Attribution (CC BY) license (http://creativecommons.org/licenses/by/4.0/).
Authors' addresses:
Michaela Staňková, PhD *
e-mail: michaela.stankova@mendelu.cz
Mendel University in Brno
Faculty of Business and Economics
Department of Statistics and Operation Analysis
Zemědělská 1
613 00, Brno
CZECH REPUBLIC
Tomáš Pipíška, PhD *
e-mail: tomas.pipiska@mendelu.cz
Mendel University in Brno
Faculty of Forestry and Wood Technology
Department of Wood Science and Technology
Zemědělská 1
613 00, Brno
CZECH REPUBLIC
* Corresponding authors
Received: July 03, 2023
Accepted: September 21, 2023
Original scientific paper