Using Cut-to-Length (CTL) Harvester Production Data in Forest Inventories
doi: 10.5552/crojfe.2024.2319
volume: 45, issue: 2
pp: 17
- Author(s):
-
- Strubergs Aigars
- Zimelis Agris
- Kaleja Santa
- Ivanovs Janis
- Sisenis Linards
- Lazdiņš Andis
- Article category:
- Original scientific paper
- Keywords:
- harvesters, forest inventory, StanForD 2010, information system, thinning, HprGallring
Abstract
HTML
Determining forest stand characteristics after thinning, in order to assess the quality of the work and update the inventory data of the thinned stand, is one of the few forest management tasks for which an efficient and accurate automation solution has not yet been developed. Currently, forest stand characteristics are determined by a certified inventory expert using manual instruments such as a range finder, digital or manual calliper, and a Bitterlich gauge. Manual measurements add a significant cost to forest management, and automating this process could increase the competitiveness of forest owners in the global timber market, helping reduce human error and providing more detailed information on the condition of stands and the distribution of trees of different dimensions in a stand.
The aim of the study is to adapt a method developed in Sweden for the automated estimation of forest stand characteristics after thinning using the HprGallring software to Latvian conditions and to determine accuracy of the modelling-based prediction of stand characteristics.
In the study, the height, number, diameter, and species of individual trees after thinning were determined using the sample plot method (according to methods applied in forest resources monitoring) and using photogrammetry as reference data for the study. In some felling areas, the diameters of all trees were measured before and after felling. The data obtained using different methods were compared with updated stand characteristics in the Forest resource database updated by certified inventory experts using plot measurement method.
According to the results of the study, HprGallring can provide the data necessary for updating the forest inventory database after thinning, but the accuracy of the modelled projections, as compared to manual measurements, are not yet within the uncertainty range as required by the forest inventory regulations. The average tree height, as indicated in the State Forest Register, matches the HprGallring estimates within the regulatory uncertainty limits in 67% of Scots pine (Pinus sylvestris L.) stands, 65% of Norway spruce (Picea abies (L.) H.Karst.) stands, and 48% of Birch (Betula sp.) stands. The diameter of an average tree after thinning estimated by the HprGallring is larger than that according to the manual measurement. The average diameter estimated using HprGallring in pine stands matches the data in State Forest Register in 40% of the assessed areas, in 47% for spruce stands, and 35% of birch stands. The accuracy of the predictions needs to be improved to make HprGallring usable in forest inventory, but even now it provides valuable spatial information about the distribution of trees of different dimensions and species within stands, enabling more accurate planning of management methods and spatial redesigning of the forest compartments.
Using Cut-to-Length (CTL) Harvester Production Data in Forest Inventories
Aigars Strubergs, Agris Zimelis, Santa Kaleja, Janis Ivanovs, Linards Sisenis, Andis Lazdins
Abstract
Determining forest stand characteristics after thinning, in order to assess the quality of the work and update the inventory data of the thinned stand, is one of the few forest management tasks for which an efficient and accurate automation solution has not yet been developed. Currently, forest stand characteristics are determined by a certified inventory expert using manual instruments such as a range finder, digital or manual calliper, and a Bitterlich gauge. Manual measurements add a significant cost to forest management, and automating this process could increase the competitiveness of forest owners in the global timber market, helping reduce human error and providing more detailed information on the condition of stands and the distribution of trees of different dimensions in a stand.
The aim of the study is to adapt a method developed in Sweden for the automated estimation of forest stand characteristics after thinning using the HprGallring software to Latvian conditions and to determine accuracy of the modelling-based prediction of stand characteristics.
In the study, the height, number, diameter, and species of individual trees after thinning were determined using the sample plot method (according to methods applied in forest resources monitoring) and using photogrammetry as reference data for the study. In some felling areas, the diameters of all trees were measured before and after felling. The data obtained using different methods were compared with updated stand characteristics in the Forest resource database updated by certified inventory experts using plot measurement method.
According to the results of the study, HprGallring can provide the data necessary for updating the forest inventory database after thinning, but the accuracy of the modelled projections, as compared to manual measurements, are not yet within the uncertainty range as required by the forest inventory regulations. The average tree height, as indicated in the State Forest Register, matches the HprGallring estimates within the regulatory uncertainty limits in 67% of Scots pine (Pinus sylvestris L.) stands, 65% of Norway spruce (Picea abies (L.) H.Karst.) stands, and 48% of Birch (Betula sp.) stands. The diameter of an average tree after thinning estimated by the HprGallring is larger than that according to the manual measurement. The average diameter estimated using HprGallring in pine stands matches the data in State Forest Register in 40% of the assessed areas, in 47% for spruce stands, and 35% of birch stands. The accuracy of the predictions needs to be improved to make HprGallring usable in forest inventory, but even now it provides valuable spatial information about the distribution of trees of different dimensions and species within stands, enabling more accurate planning of management methods and spatial redesigning of the forest compartments.
Keywords: harvesters, forest inventory, StanForD 2010, information system, thinning, HprGallring
1. Introduction
Rapid developments in technology encompass the forest sector and will, in the foreseeable future, make it possible to monitor the basal area of remaining stands and update forest stand characteristics instantaneously during the harvesting process. Kemmerer and Labelle (2021) concluded in their review article that there are very few studies where data automatically obtained by harvesters are used in forest inventory. As recognized and reflected in publications by several researchers (e.g., Kiljunen 2002, Maltamo et al. 2010, Siipilehto et al. 2016), the reconstruction of the stand structure is the first step to ensure the essential link for the most effective use of the data automatically obtained by the harvester. Harvester data allows the calculation of the total length of the stem between the stump and the last sawing point, but does not allow the reconstruction of the entire length of the trunk (Lu et al. 2018). HprGallring application is one of the few software aimed to reconstruct a stand inventory data using harvester production files. The HprGallring software was adapted in Sweden as a solution to determine forest stand characteristics in thinning within felling areas using harvester production files. The software uses harvester production files created according to the StanForD2010 standard. The software also assesses the quality of the thinning, including the area of the corridors, compliance with the thinning implementation from the top or bottom, and the compliance of the requirement to remaining basal area. The capabilities of the software were demonstrated in Sweden, mainly in the thinning of coniferous stands, and it was adapted to Swedish forest management and growth models and according to mensuration requirements in Sweden. So, in order to assess whether the software can be recommended for use in Latvia in line with the Latvian regulations governing the accuracy of forest inventory, different methods should be compared for determining stand characteristics in thinning areas, including harvester production files, to assess the accuracy and possible reasons for discrepancies.
The stand characteristics can be based on harvester data and field measurements acquired using mainly the sample plot approach (Stendahl and Dahlin 2002, Murphy et al. 2006, Holopainen et al. 2010, Delmaire and Labelle 2022) and remote sensing based methods (Rasinmäki and Melkas 2005, Holmgren et al. 2012, Barth and Holmgren 2013). The harvester measurements are automated. The information system of the harvester records operator's activities, felling head and other sensor readings, including the tree species, diameter, trunk length, harvester location coordinates and, in modern harvesters, the angle of rotation of the crane tower relative to the harvester's longitudinal axis (Arlinger et al. 2012). For some machines, the distance of the harvester felling head from the base machine is also recorded, so the location of every harvested tree can be recorded with centimetres accuracy. The harvester control software constructs the trunk model using a log length and diameter measurements.
To implement this function and to improve the mechanism for automated calculation of stand characteristics, a complete solution for the analysis of production files that comply with StanForD2010, the HprGallring software, was developed. The software can be integrated into the harvester control system or other computer, and can reconstruct the stand before and after thinning using the trunk model, the position of the felled trees, and other parameters recorded by the harvester.
The locations of the trees is determined by the HprGallring using a GPS receiver (Olivera et al. 2016, Hauglin et al. 2017), a tower turning sensor and arm position sensors, if available (Olivera and Visser 2014). The minimum requirement for the machinery is the ability to record the coordinates of the harvester position during the felling of each tree. Using these data, HprGallring breaks down the stand into 13x13 m sectors and calculates a factor for each sector, which represents the intensity of the thinning. This indicator can be calculated if it is known whether the trees were felled within the strip road or outside it, which is determined using the tower turning angle data, assuming a certain threshold value, at which the felled trees are within or outside the strip road. If the tower turning angle is not known, the program makes the assumption based on the proportion of trees. The Swedish study demonstrated good results, regardless of the harvester measurement method (Bhuiyan et al. 2016). Comparing the manually acquired data with the HprGallring estimate, the study found a systemic bias of less than 2.2%. The standard deviation for the indicators calculated using HprGallring differed from the manually obtained data by 4–14%, and in some cases, by as much as 20%. The study could not identify the reasons for the difference of up to 20% in some harvest sites (Köppler 2017).
The HprGallring software can model the basal area of a stand based on the position of the felled trees; however, the accuracy of the modelling depends on the dimensions of the felled trees and their conformity to the mean tree dimensions of the stand – the smaller the difference from the average, the more accurate the result of the modelling (Köppler 2017, Larsson 2017).
Köppler's study describes the differences that arise in determining the length and area of the strip road. In some cases errors were found, but these were not significant. It should be emphasised that the width of strip road is a fixed value in the HprGallring software, meaning that the strip road area is mainly determined by the length and location of the strip road. In Sweden, (Köppler 2017) the width of the strip road is measured using a method similar to the one used in Latvia (AS »Latvijas valsts meži« 2008), whereby the total width is determined by the distance between the dominant trees on the opposite sides of the strip road. In the study, the calculation of the width of the strip road is based on 9 objects, discarding the lowest and highest values. As a result, the average strip road width is from 4.8 m to 4.4 m. The smallest value is used as the default in HprGallring (Köppler 2017).
Another Swedish study compared 12 coastal stands. Manual measurements were done in 9 stands. The study demonstrated that data modelled by HprGallring are significantly different from manually acquired data in 42% of stands. In four of the 12 stands, the difference in tree height exceeded 2 m. The study concluded that the HprGallring needs to be improved in order to describe the stand characteristics of stands with a relatively small number of trees. One of the positive findings of the study was the positive attitude of operators to use automatic quality control tools (instantaneous determination of remaining basal area and tree height) in thinning, thus reducing the need to manually check the remaining basal area with a Bitterlich gauge or other tools (Burström 2016).
The goal of the study is to evaluate the possibility (accuracy and applicability in different conditions) to produce harvester data that comply with the StanForD2010 standard to assess the forest inventory data using HprGallring software in order to reduce the amount of work and the costs associated with the mensuration activities as discussed by Rasinmäki and Melkas (2005) during elaboration of updated forest inventory data after thinning and to evaluate the possibility to use HprGallring in the thinning quality control, to partially or fully replace the manual retrieval of data by the sample plot method as concluded by Holmgren et al. (2012).
2. Materials and Methods
2.1 Data Mining
Harvester data processed by the HprGallring were used for the comparison of stand characteristics, measurements made by certified inventory experts (further in the text – manual measurements) and photogrammetric measurements (remote sensing). The harvester data were collected automatically during thinning. The data included in the report prepared by the harvester were the tree species, diameter and height. Using the length and diameter data, the harvester control software constructed a trunk model, but the model had a negligible effect on the calculation by the HprGallring, since the trunk volume was calculated as the sum of the volume of the trunk sections (produced logs). The HprGallring software reconstructed the stand before and after thinning using the trunk models, the species composition, and the location of the trees to be felled. The HprGallring software can be installed in the harvester control system, providing the possibility to monitor the quality of the work during harvesting. To use this feature, the harvester must fell at least 0.5 ha for training data. The software is able to track the remaining basal area. It is important that the felling area is homogeneous and that the rest of the felling area is not different from the area used for the training data.
The data provided by the forest owner provides for the reflection of the main indicators of taxation of the stands before and after thinning. For the purposes of the study, the situation before maintenance felling was characterized and the stand characteristics were updated after thinning (after 2020). Stands representing seven age groups were selected for the study (Table 1). Information from 386 stands are used for analysis. Only felling sites consisting of one compartment are used in the study.
Table 1 Distribution of felling groups according to stand age
|
Group name |
Age, years |
|
|
from |
to |
|
|
Group 1 |
10 |
19 |
|
Group 2 |
20 |
29 |
|
Group 3 |
30 |
39 |
|
Group 4 |
40 |
49 |
|
Group 5 |
50 |
59 |
|
Group 6 |
60 |
69 |
|
Group 7 |
70 |
79 |
2.2 Design of Measurement Plots
After the selection of the felling areas, sample plots were established to determine the stand characteristics and for the calibration tree height models in the remote sensing projection. The centre of the sample plot was determined using a Garmin GPS eTrex 30 receiver. The diameter of the trees was measured by holding a tree calliper in a position relative to the centre (Fig. 1).
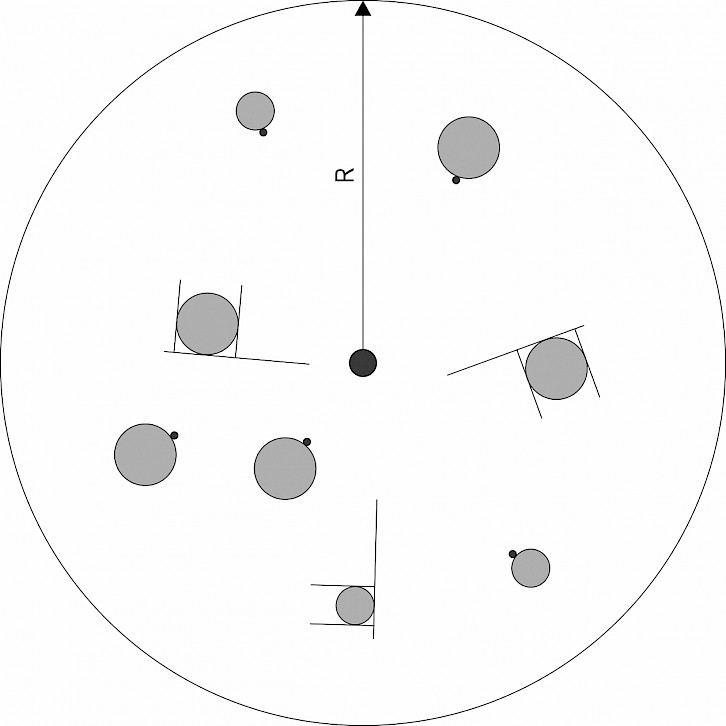
Fig. 1 Diameter measurements in manual measurement plots
The height of the tree was measured from the root collar to the top using Vertex 5, with an uncertainty of ±0.5 m. The number of sample plots depends on the area and the heterogeneity of the stand. At least one plot per hectare was set up. Exceptions were done in situations when the stand characteristics of the stand differed significantly within a sub-compartment of more than 0.5 ha, where additional plots were established in those parts of the stand.
The area of the sample plot (SP) is 200 m2 (R – 7.98 m). Within SP, trees were measured and broken down by species –pine, spruce, birch, aspen, black alder, grey alder, hardwood deciduous species considered separately, and softwood deciduous species likewise combined. The diameters were measured at 1.3 m from the root collar.
2.3 Width of Strip-Road
After thinning, the width of the strip road was determined in a 10 m long strip according to the following instructions:
measure the shortest distance between the axis of a wheel track in strip-road and the nearest tree of the stand (Fig. 2, left); then measure the distance between the middle of the same track to the nearest tree on the other side of the strip road, and then add the two measurements to get the total width (AS »Latvijas valsts meži« 2008)
measure the shortest distance between the middle of the harvesting machine wheel track and the nearest dominant tree stump in the stand (Fig. 2, centre). If the distance is less than 1 m, the width of the strip road is marked as 4 m
measure the shortest distance between the centre of the harvesting machine wheel track and the nearest stump of a dominant tree species (Fig. 2, right). If the distance is more than 1 metre, then measure the shortest distance between the centre of the harvesting machine wheel track and the nearest dominant tree, and measure the distance from the centre of the same track to the nearest tree on the other side, adding the two measurements to get the total width.
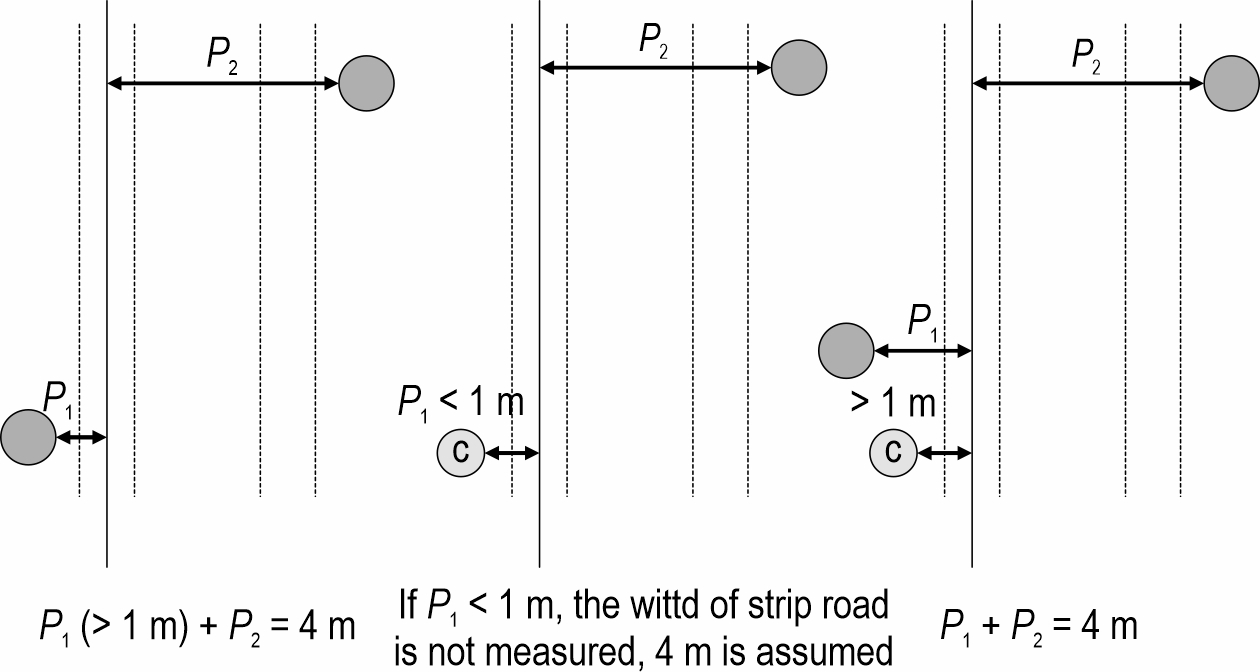
Fig. 2 Measuring the width of the strip road
2.4 HprGallring Software
The most comprehensive study in Swedish assessed the accuracy of HprGallring in 41 stands. The study surveyed all trees within at least 1 ha in each stand. The results showed slight differences between the harvester data and the manual measurements. The smallest deviations were found in the basal area and the diameter of the average tree, while the biggest deviations were found for the number of trees. The accuracy of the estimate increases significantly if the species composition and dimensions of the felled trees are not significantly different from the stand mean values (Larsson 2017).
During thinning, the harvester produced a StanForD2010-compliant production log file (.hpr), which recorded the coordinates of the trees felled (harvester position at the time of felling), the arm turn angle relative to the longitudinal axis of the harvester, and, less commonly, the angle of the boom of the arm. In our study, the last feature was not available. The resulting file was processed in HprGallring to get the stand characteristics at a sub-compartment level combining areas with similar tree height and dominant species, which were then manually merged into legally determined compartments. Data processing procedures were the following:
data import using »open .hpr file directly« function
in view mode, the software displayed the stand characteristics, the volume and number of harvested trees, the location of the trees felled and other parameters
the imported files could be saved for further processing
analysis of the inventory and produced amount broken down by felling areas using the »Prognosis data to shape file« function
analysis of the spatial location of trees using the »Hpr-file to tex-file« function.
To calculate the stand characteristics at a stand level (average tree height and diameter, number of trees and basal area), the spatial point data layer previously created using HprGallring were imported into QGIS, where the spatial data layer describing compartment borders according to the State Forest Register was added using the »Join attributes by location« function. In each sector, the centre was marked using the »Centroids« function, which contained basic information about the plot, with average tree height, diameter, and stand basal area. At the plot level, the diameter, height, and basal area were calculated using the »Point statistics for polygons« function. The created layer was exported to the database, and basic information from the State Forest Register was added during the processing.
2.5 Estimation of Tree Height and Number of Trees Using Photogrammetry
During the study, 57 stands with harvester production files located mostly in North-Eastern part of Latvia (Fig. 3) were photogrammetrically surveyed using Mavic 2 Zoom drone equipped with a 12MP RGB camera. Flights took place at an altitude of 100 m; the flight speed was 3.5 m/s, the frontal overlap of the captured images was 90%, and the lateral overlap was 80%. To achieve greater accuracy, ground markers were used, with coordinates determined using the RTK GPS system. Agisoft Metashape Pro 1.6.3 was used to process the data and create a photogrammetric digital suface model (DSM). The resulting surface models have a horizontal resolution of 0.1 m.
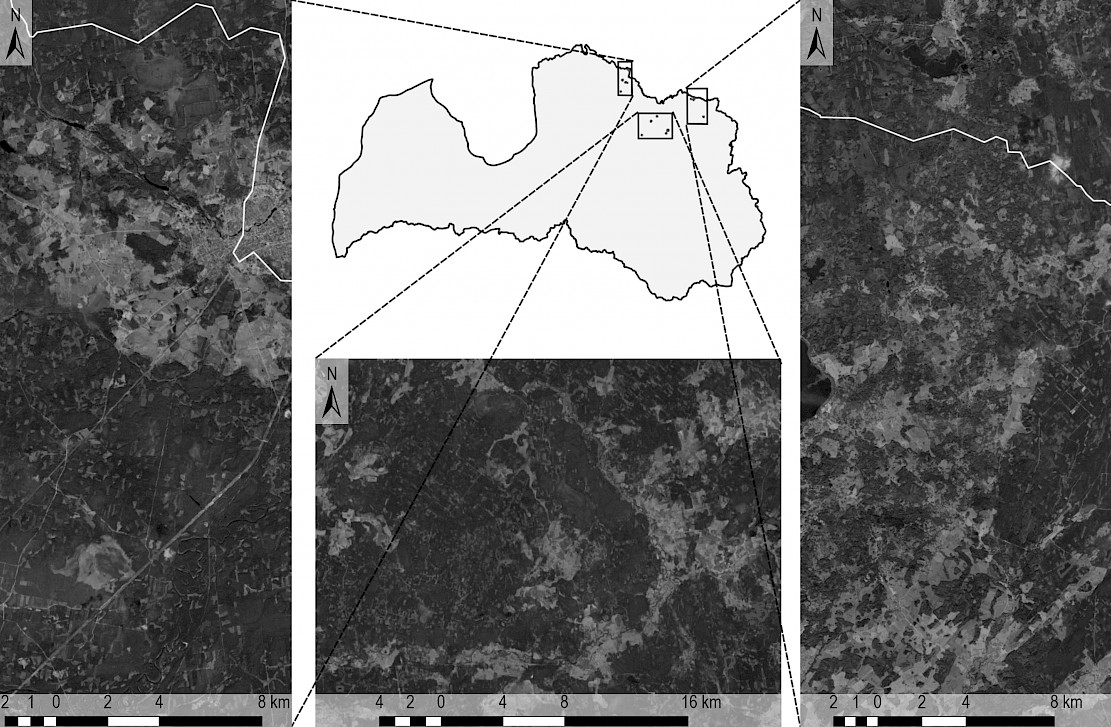
Fig. 3 Location of photogrammetrically surveyed stands
The canopy height model (CHM), which shows canopy height after thinning (Fig. 4), was created using digital elevation models (DEM) produced using LiDAR data stored by the Latvian Geospatial Information Agency (LGIA).
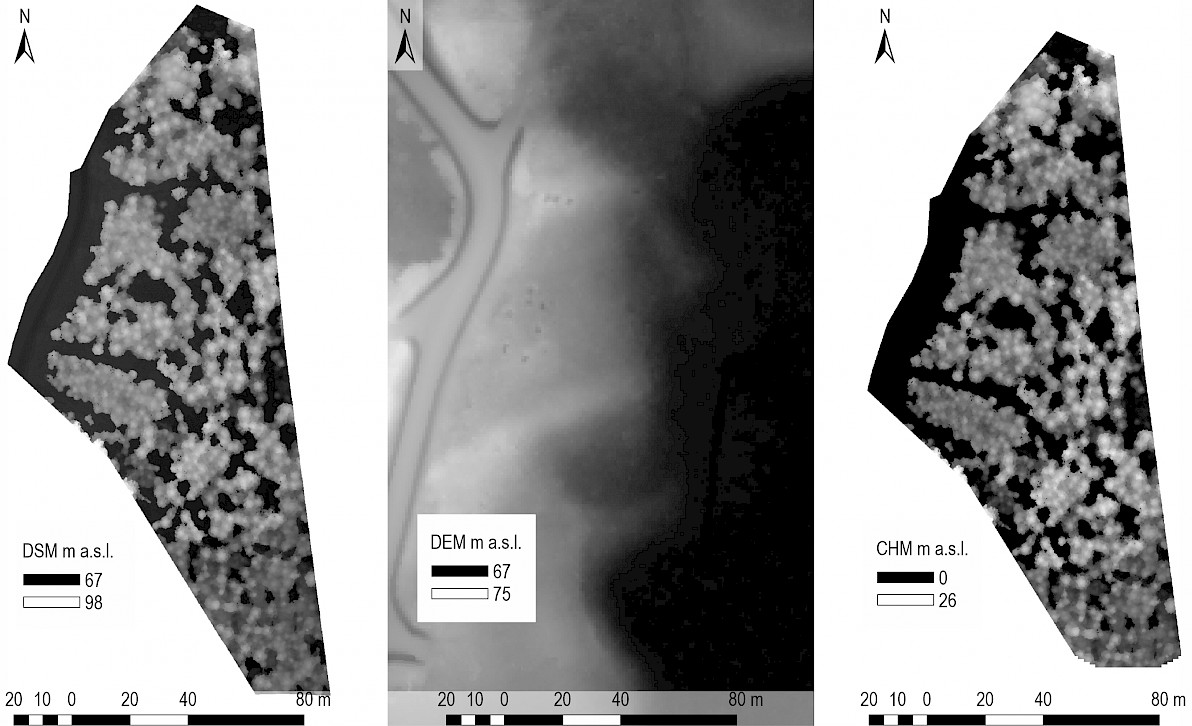
Fig. 4 Example of production of a canopy height model (CHM)
The photogrammetric data analysis revealed a »tilting« of the CHM produced, as the markers placed under the tree canopies were sometimes not visible in the captured images. To prevent the CHM »tilting«, the raster data layers were overlaid on a 20x20 m grid and the height of the Earth's surface was determined for each cell using the 2nd elevation percentile (Fig. 5). If the CHM model was correct, the land surface value was close to 0, while deviations from 0 pointed at inaccuracies. Next, an elevation mismatch surface was generated using the cell grid centroids. The interpolated surface was subtracted from the previously generated CHM, resulting in an updated CHM model.
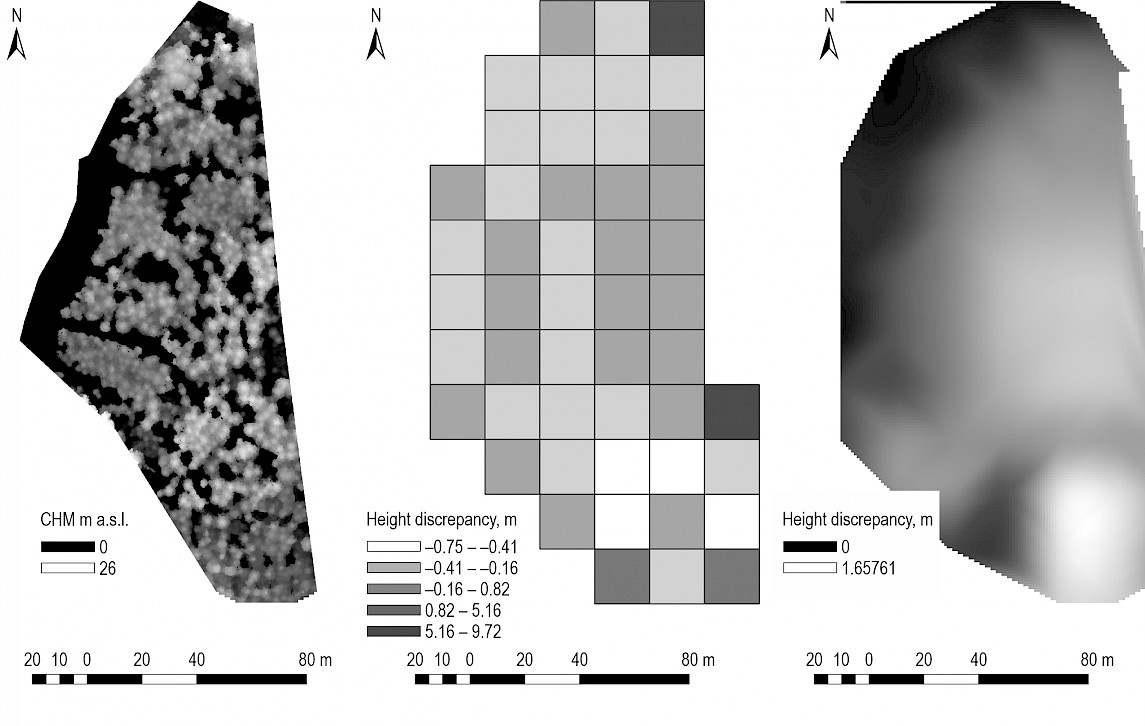
Fig. 5 Example of correction in canopy height model
Individual trees were identified using the methodology described in 2017 by Ivanovs et al. 2019. On the left, Fig. 6 shows the CHM model, and on the right, the model developed using a neighbour analysis tool, looking for the maximum CHM values with a radius of 11 cells. The figure shows the individual trees found in the area and their photogrammetrically determined heights. This function was used to identify individual trees and their height after thinning. To ensure sufficient accuracy, the distance between trees should be at least 2 m, and accordingly, the method cannot be applied in young and non-thinned stands.
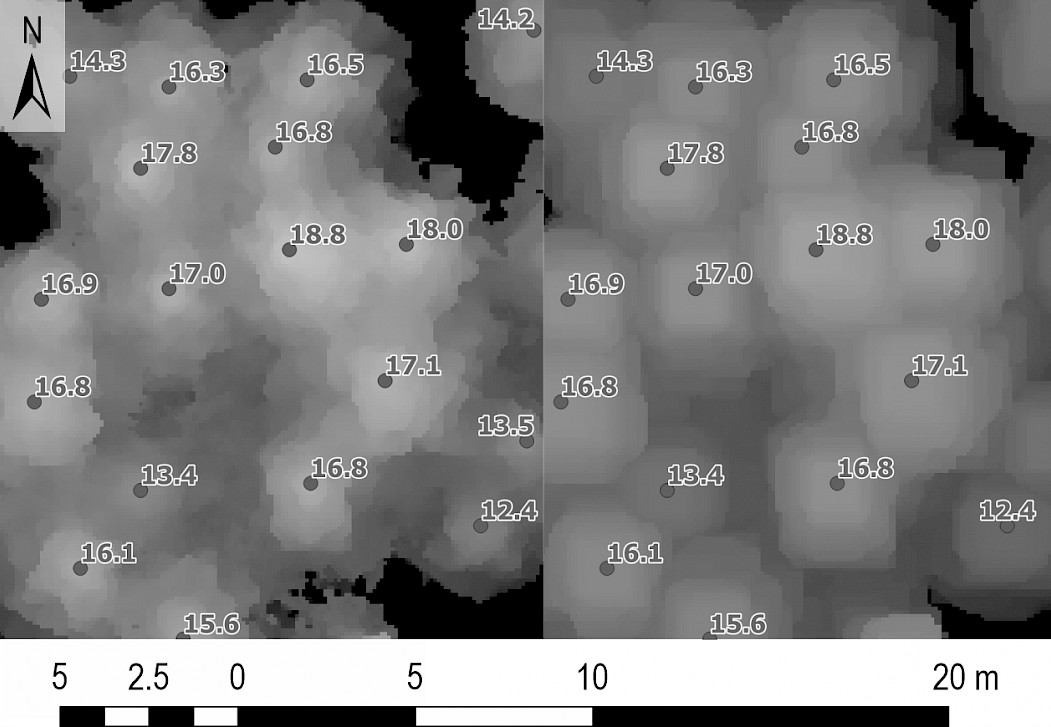
Fig. 6 Example of identification of individual trees
The photogrammetrically retrieved number and height of trees were compared with the trees measured manually in the circular sample plots. There are mutual biases between the manually and photogrammetrically measured tree coordinates due to the precision of determining the plots and the fact that the manually surveyed tree coordinates were determined relative to the tree trunk, while the photogrammetrically surveyed tree coordinates were determined relative to tops of trees. A statistical comparison of the numbers and heights of trees obtained photogrammetrically versus manually showed no statistically significant differences between the datasets, and these data were used for comparison with the HprGallring prediction and the manual measurement data by the certified forest inventory experts.
2.6 Data Processing
The tree height control measurements were done based on the arithmetic mean height equation by T. Lorey, in which the height of each tree is included based on its basal area (Liepa 2018)
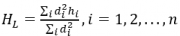 (1)
(1)
Where:
di d
hi a.
Measured data from the sample plots were used to present the tree diameter calculation curve for each stand, and the developed equation was used to calculate the diameter based on the remote sensing data describing the dominant species in the stand and height of the trees. The study includes a calculation of individual regression equations for each stand to ensure higher precision, while species are not separated since they cannot be determined in photogrammetric data.
Data from HprGallring used for the analysis:
data required for comparison of stand characteristics before thinning – remaining basal area (BA_Remain), extracted basal area (BA_Extract), harvested stock and remaining growing stock of the stand
data required for comparing the stand characteristics after thinning – basal area of the remaining stand (BA_Remain), mean diameter of remaining trees (Dbw_Remain), mean height of remaining trees (Hbw_Remain), and remaining number of trees (Stems_Remain).
The basal area of the stand was calculated according Cabinet Regulation No 935 (Ministru kabineta noteikumi Nr.935, 2012).
To compare the stand inventory data, the harvester predictions and remote sensing-based estimates (tree height and number of trees) were compared with manual measurement data acquired according to legal requirements. Descriptive statistics (arithmetic mean, standard deviation and number of observations) were used to describe the mean values. For the summary statistics, the Wilcoxon signed rank test was used to describe the differences between the traits or sample sets studied. Spearman's rank correlation test was used to determine the correlation or relationships, which was used for the mutual comparison (RMSE) of the data obtained in Latvia and the sample set used in similar studies in Sweden
 (2)
(2)
Where:
Xbaze manual measurement data
XGallring HprGallring prediction.
3. Results
3.1 Pre-Processing of Data
HprGallring generated stand inventory data in 13x13 m segments, averaging the stand characteristics for each segment. It should be noted that, in a situation where the height of the trees of one part of the stand or the type of thinning (from below or above) is different, the obtained results can also differ significantly. The example in Fig. 7 shows pine stand where the average tree height calculated by HprGallring is 19.8 m, according to the remote sensing data – 24.1 m, and according to the manual measurement data – 25.0 m.
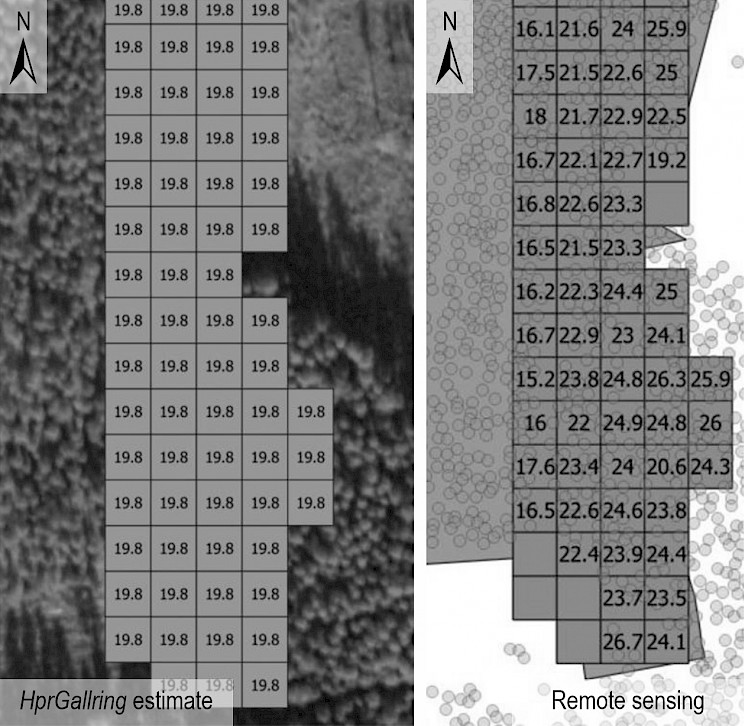
Fig. 7 Screenshot from QGIS showing tree height
The difference can be explained by the dilution method. Specifically, thinning was done from below, cutting down the thinnest and most stunted trees. As there was almost no cutting of dominant trees on the strip road, the harvester software predicted inappropriate stand characteristics.
The study also observed differences in areas adjacent to the road or between adjacent plots where the difference in between stands was significant. For example, the difference between the remaining tree height predicted by the harvester and the remote sensing data at the edges of the felling area was significant. This is due to the influence of the adjacent stands in cases where the plot boundaries were not precisely defined; for example, in the lower corner of Fig. 8, the tree height of 15 m was determined by remote sensing because the thinned compartment was adjacent to a young stand with an average tree height of 11 m, resulting in a decrease in the average tree height in the studied compartment.
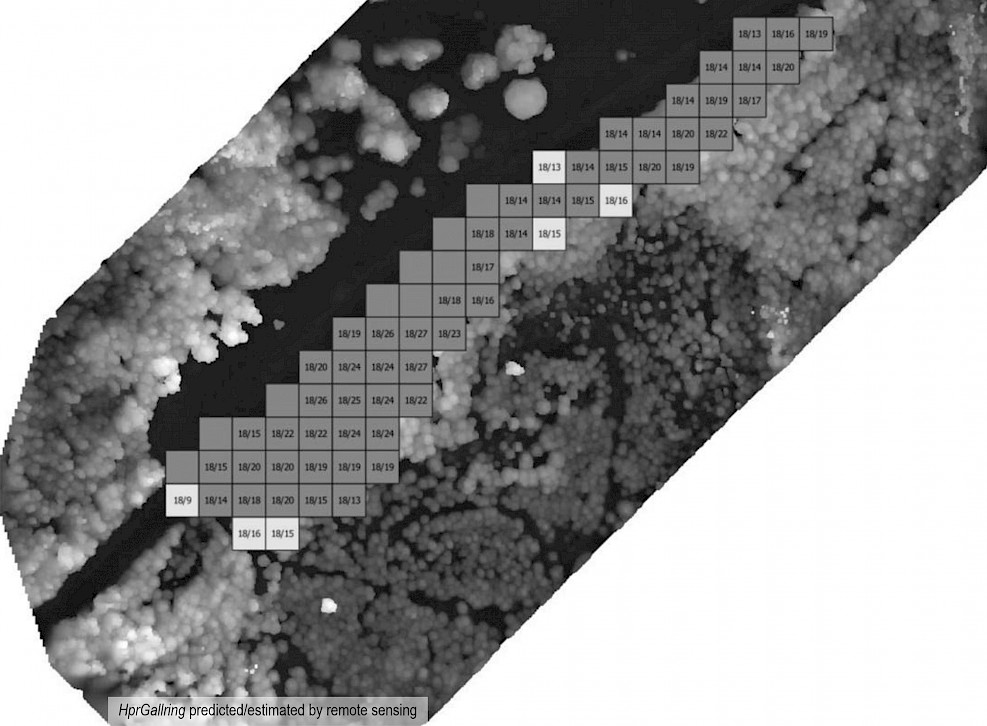
Fig. 8 Average height of trees at edges of felling areas
In other cases, significant differences between the heights predicted by HprGallring and remote sensing data appeared in larger or smaller openings and in areas where no trees of dominant species were harvested.
3.2 Comparison of Stand Characteristics after Thinning
The most important indicators included in the evaluation were the average remaining tree height, diameter and basal area. The data analysis included manual measurement at a plot level, HprGallring projection at felling area level and remote sensing data at a compartment level. In situations when the thinning was done in merged compartments, the felling area was additionally divided into compartments. Data from 389 objects were used to determine the average tree height, average diameter and stand cross-sectional area by manual surveying and HprGallring, while for 49 objects, data was obtained using remote sensing.
The study found significant differences between the stand characteristics acquired by manual measurement, remote sensing and HprGallring estimates.
3.3 Differences of Average Tree Height
According to the manual measurement, the average tree height in the evaluated compartments was 20.5±4.3 m, and according to HprGallring calculations it was 20.3±3.8 m; the difference was significant (p<0.05). With a 10% error threshold, HprGallring achieved compliance with manual measurement data in 64% of the stands, at a 12% error threshold – in 72% of the stands, and at a 15% error threshold – in 81% of the stands. The correlation between the manual measurement data and the HprGallring prediction was high, at r=0.84 (p=0.00). Pine stands have the highest correlation coefficient, at 0.86 (p=0.00), spruce stands, 0.71 (p=0.00), and birch stands, 0.61 (p=0.00).
Fig. 9 shows the uncertainty in the mean tree height values when comparing the manual measurement data, the HprGallring prediction, and the remote sensing data. With such data dispersion, it was not yet possible to meet the requirements of the Cabinet Regulations for determining the average tree height in stands after thinning based only on the HprGallring or remote sensing predictions, assuming that manual measurements were correct.
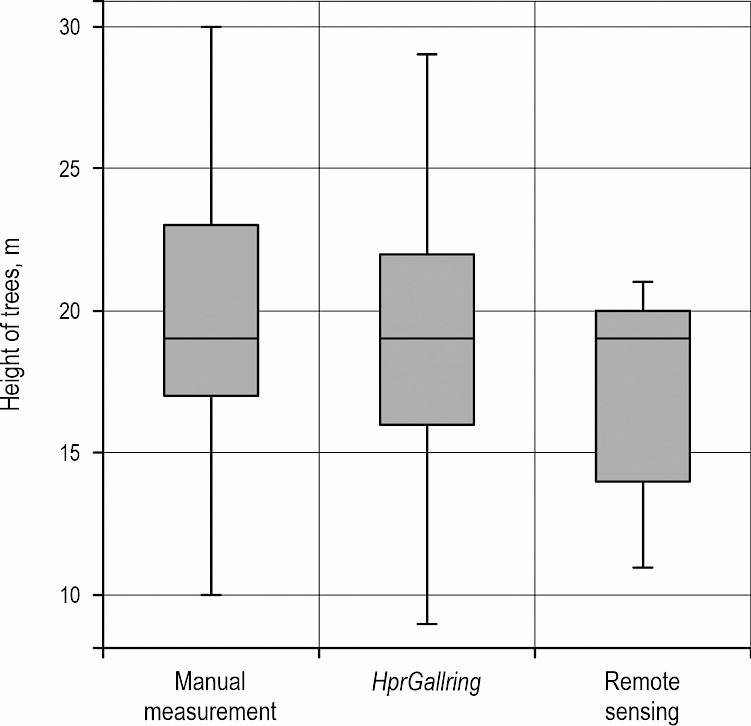
Fig. 9 Mean stand tree height dispersion values
As the next step, a comparison of tree height depending on the dominant species was carried out to compare the accuracy of the projection depending on the dominant tree species. The study found similar uncertainty rates in pine, spruce and birch stands (Table 2).
Table 2 Mean tree height by dominant tree species
|
Species |
Mean height (in m) and standard deviation |
Number of stands |
|
|
Manual measurement |
HprGallring forecast |
||
|
Spruce |
18.7 ± 3.0 |
18.2 ± 2.7 |
179 |
|
Pine |
20.6 ± 5.1 |
19.7 ± 4.5 |
163 |
|
Birch |
20.4 ± 3.5 |
18.8 ± 4.5 |
40 |
The data dispersion was positive for all tree species (Fig. 10). This means that the trees felled in thinning were smaller than the remaining trees, i.e. it was done »from below«. In pine stands, HprGallring calculated a smaller height of average remaining tree in 67% of stands in comparison to manual measurement. Cumulative conformity of the HprGallring based predictions to the manually determined values at a certain uncertainty range (0–15%) in pine stands:
exact match in 21% of the stands
within 10% in 67% of the stands
within 11% in 68% of the stands
within 12% in 73% of the stands
within 15% in 82% of the stands.
In spruce stands, the average tree height predicted by HprGallring was higher than that in the manual measurements in 49% of cases. Cumulative distribution of differences in mean tree height within the value of uncertainty (0–15%) in spruce stands:
exact match in 21% of the stands
within 10% in 65% of the stands
within 11% in 67% of the stands
within 12% in 74% of the stands
within 15% in 82% of the stands.
In birch stands, the average tree height estimated by HprGalling was higher than that according to the manual measurement in 65% of stands. An exact match was in 20% of the stands, within 10% of uncertainty – in 48% of the stands, within 12% of uncertainty – in 53% of the stands and within 15% of uncertainty – in 70% of the stands.
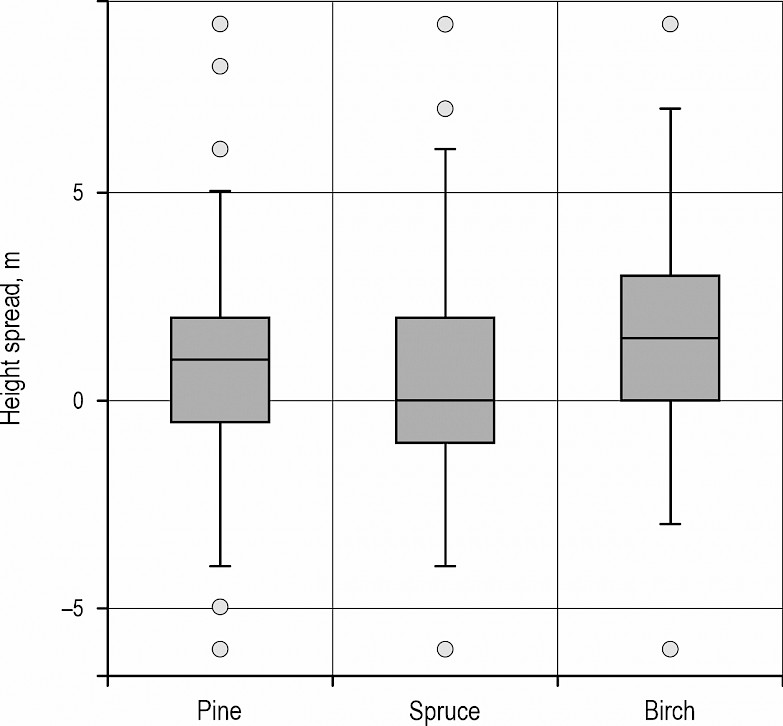
Fig. 10 Average tree height dispersion values by dominant tree species
The next stage of the study was to find out whether stand age had a significant effect on the mean tree height calculated by HprGallring. A closer match was found in pine stands. In age groups 2 and 5 (decades), in more than 70% of the stands the average tree height calculated by HprGallring conformed to the manual measurement data; from the sixth age group onwards, there was a sharp decrease in accuracy. In spruce stands, most average tree matches were observed in age groups 4 and 5 (68%), while in the other groups (2, 3, and 5) the match rate did not exceed 53%. In birch stands, there was a tendency for the accuracy of HprGallring calculations to increase as the age of the stand increased.
A comparison of the average tree height indicated by the manual measurement with the results of the HprGallring and remote sensing calculations revealed significant differences in pine stands (Table 3), whereas spruce stands did not show a significant difference in average tree height. Birch stands were not included in the remote sensing study.
Table 3 Height differences compared to remote sensing data
|
Database |
Pine |
Spruce |
Birch |
|
Manual measurement – remote sensing |
p=0.00 |
p=0.32 |
N/A |
|
HprGallring – remote sensing |
p=0.00 |
p=0.26 |
N/A |
3.4 Average Tree Diameter in a Stand
According to the manual measurement, the average value over the whole sample set of data is 20.5±4.3 cm, while according to HprGallring calculations, it is 20.3±3.8 cm, the difference not being statistically significant (p=0.57). However, comparison of the remote sensing-based data with the manual measurement shows a significant difference (p=0.00). It should be taken into account that the remote sensing tests estimate diameter-based tree height without taking tree species into account, so the calculation of the average tree diameter using remote sensing data may be less accurate. No significant difference was found between the average tree diameter determined by remote sensing method and measurements within the sample plots, meaning that the uncertainty in the remotely determined diameter data was likely caused by the different species composition and diversity of stand characteristics outside the sample plots. Fig. 11 shows the data dispersion comparing the manual measurement data extrapolated to a stand level and the values calculated by HprGallring.
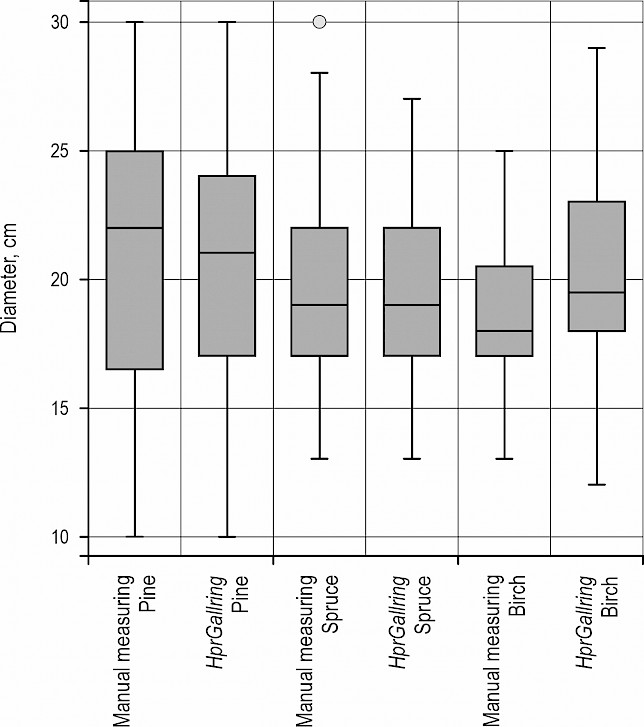
Fig. 11 Diameter distribution by tree species
The averages, depending on the method used to determine the mean tree diameter, are shown in Table 4. The biggest variation was found in pine stands, with significant differences between the methods (p=0.02), while in spruce stands there was no statistically significant difference between the methods (p=0.60). The amount of data from birch stands was not sufficient for the analysis. The correlation between the manual measurement data extrapolated to a stand level and the values calculated in HprGallring was 0.78 (p=0.00). Accuracy was the highest in pine stands: 0.83 (p=0.00), in spruce stands – 0.69 (p=0.00), and in birch stands – 0.61 (p=0.00).
Table 4 Average tree diameter by tree species
|
Species |
Mean diameter (cm) and standard deviation |
Number of observations |
|
|
Manual measurement |
HprGallring |
||
|
Spruce |
19.5 ± 3.2 |
19.7 ± 3.1 |
179 |
|
Pine |
22.1 ± 5.0 |
21.0 ± 4.4 |
163 |
|
Birch |
18.7 ± 3.1 |
20.4 ± 3.8 |
40 |
The variation of average tree diameter was similar for all species (Fig. 12). The discrepancy in diameter when using HprGallring was greater than the regulatory limit – 1 cm. A comparison of the manual measurement data extrapolated to a stand level and the average tree diameter predicted by HprGallring revealed compliance within 1 cm range in 47% of the stands. However, this is only true under assumption that the manual measurement data provides correct result at a stand level, which is not the case because of significant difference between the remote sensing-based prediction and extrapolation of the sample plot data to a stand level.
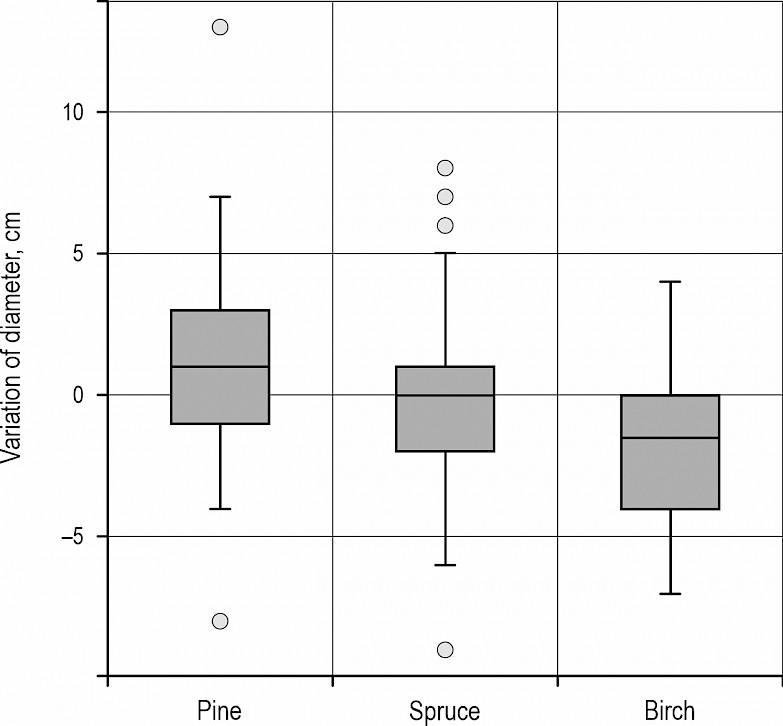
Fig. 12 Variation of diameter of an average tree
The biggest differences between the manual measurement-based stand inventory data and HprGallring estimates were found in pine stands. The average tree diameter calculated by HprGallring is bigger than the value based on the manual measurement in 58% of the stands. In 14% of the stands the average tree diameter matched perfectly; in 40% of the stands there was a difference of up to 1 cm; in 63% of the stands the difference was up to 2 cm, and in 80% of the pine stands the difference was up to 3 cm.
The exact diameter match was not found in any spruce stand. In 40% of the spruce stands, HprGallring predicted the average tree diameter, while in the remaining 60% of the stands the diameter calculated by the program was smaller. The average diameter deviation comparing the HprGallring based data and manually measured values in 69% of stands was up to 2 cm and in 86% of stands – up to 3 cm.
According to HprGallring projections, 68% of birch stands had a smaller average tree diameter in comparison to manual measurement, while the remaining 32% of stands had a larger average diameter. In 35% of the stands, the difference was up to 1 cm; in 55% of the stands the difference was up to 2 cm, and in 70% of the stands the difference was up to 3 cm.
In pine stands, the average tree diameter was the most accurately determined in age groups 2, 3, and 4 (referred as age decades), where the HprGallring and manual measurement-based assessment results matched in 64% of the stands (including the ±1 cm measurement error). However, from age group 5 upwards, the accuracy decreased sharply – 35% of the stands in group 5 and 20% of the stands in group 7 had an exact match of the HprGallring and the manual measurement-based data. In spruce stands representing age groups 2 and 3, exact match was found in 52%, and from age group 4 upwards the accuracy decreased, with 48% matching values in age group 4 and a 33% match values in age group 6. In birch stands, the average tree diameter matched exactly in manual measurement-based inventory and according to HprGallring projection in 33% of the stands in age groups 2 and 3, and in 21% of the stands in age group 4 and higher, with a decreasing trend.
Given the differences in the height and diameter, the basal area determined by the different methods deviates significantly (p=0.00). The variation in the basal area depending on the dominant tree species is shown in Fig. 13.
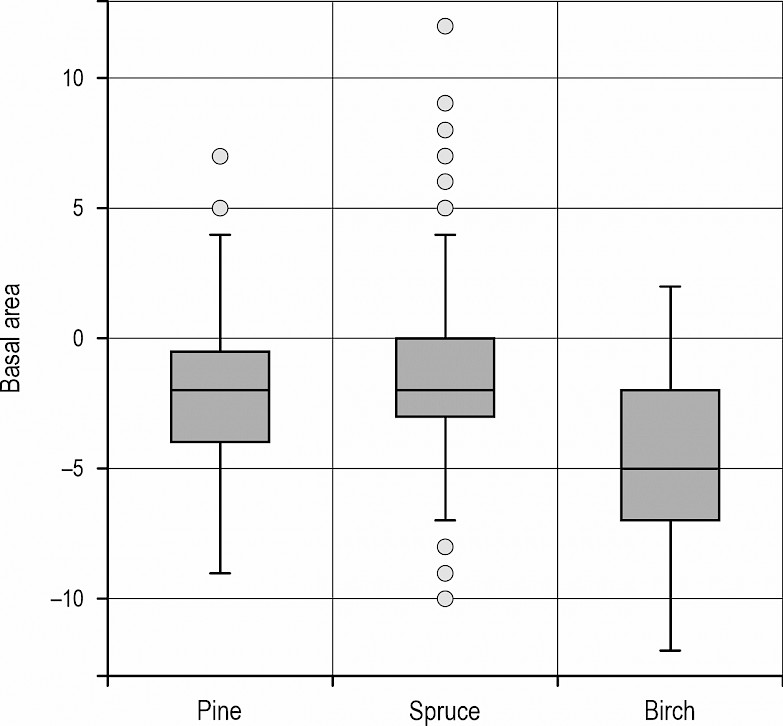
Fig. 13 Difference in basal area determined using manual measurements and HprGallring estimates, depending on dominant tree species
The remaining basal area after thinning was significantly different (p=0.00) comparing the manual measurement-based data and HprGallring estimates. The difference was also significant (p=0.00) when comparing the remaining basal area with the dominant tree species. In terms of age groups, better results were acquired in pine stands in age groups 2 and 5, and in spruce and birch stands, in age group 5 (Fig. 14).
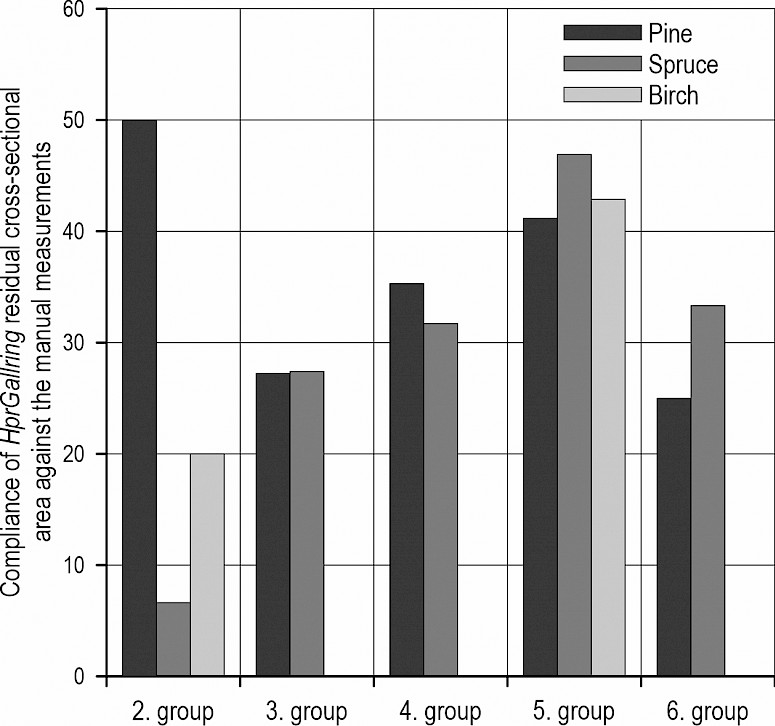
Fig. 14 Compliance of remaining basal area with regulatory requirements, by species and age group
The deviation of the basal area was negative, meaning that HprGallring predicted smaller basal area than that in the manual measurement-based inventory data.
3.5 Comparison of Basal Area and Growing Stock before Thinning
The difference between the basal area (ba) before thinning according to the manual measurement-based inventory and the estimates by HprGallring (ba extracted + ba remaining) was significant (p=0.00), and the basal area rounded to m2 before thinning matched in 10% of the stands in comparison to manual measurements. The difference of the growing stock according to manual measurement-based inventory data and HprGallring estimates was also significant (p=0.00), with a mean standard error of ±52 m3/ha.
4. Discussion
The results of the calculations were significantly affected by systemic errors that arise from the manual measurement-based inventory methods, and due to the technical limitations of forest machinery. The attention should be paid to the technical condition of the harvester felling head and the accuracy of the measurement system, by regularly performing assortment control measurements and calibration of the harvester felling head (Strandgard 2009, Nieuwenhuis and Dooley 2006, Leitner et al. 2014). It should also be noted that factors used to predict bark thickness may differ between the regions and the factors intergrated in the HprGallring should be adapted to other regions. Debarking during harvesting process can also affect accuracy of the diameter forecast by underestimation of the diameter of trees debarked at stump level. Supplementing the dataset with information from harvester calibration data could help to eliminate potentially erroneous measurements, while the errors in the stand characteristics associated with manual measurements can be reduced by the additional use of remote sensing data.
Similar studies implemented in Sweden to assess the compliance of the model with control measurements found a mean squared error of the tree length to be 5–14% (Larsson 2017), in Latvia, mean squared error of the tree length is 2% for conifer stands and 3% for birch stands. The accuracy of the software in calculating the height of an average tree in the remaining stand is better in Latvia.
In the Swedish studies, according to HprGallring and field measurement-based data, the mean square error of the average tree diameter estimates ranged between 0.7–10% (Larsson 2017), in Latvia, the mean square error was 2.4% for spruce, 3.0% for pine, and 3.2% for birch. It should be noted that the uncertainty may be associated not only with the hprGallring estimates, but also with the instrument, method, and measurement errors in the manual measurement-based assessment, as already mentioned above.
The study found that the correlation between the average tree diameter according to the manual measurement data and HprGallring estimates decreased with the increase of the stand age, regardless of the dominant tree species. This may be due to differences in the ratio of the dimensions at a stump level versus those kept in stands of different ages, due to different cutting heights for trees of different dimensions, or changes in the bark thickness factor. Such a discrepancy between manually measured and machine-measured data related to changes in bark parameters was also pointed out by Strandgard and Walsh (2012). However, the study found no patterns that could systematically improve the accuracy of the diameter measurements. We realized that the difference increases with the increase of the diameter of extracted trees so there migt be systematic error associated with recalculation of the stump level diameter of a tree to the breast height diameter of a tree. Thus, in pine stands with sligtly bigger trees, the error of prediction of the diameter at the breast height is bigger. We also realized that in Sweden, where the application is elaborated, the diameter of trees at the breast height is calculated from a ground level, and in Latvia – from a root collar, which may cause additional error. Notably, the diameter at the breast height does not affect the accuracy of prediction of the stem volume, since it is calculated as a sum of of individual measurements.
Regardless of the dominant tree species, the basal area of the remaining stand calculated by HprGallring was smaller than that according to the manual measurement. This might be associated with inaccuracy of the modelled diameter of the average tree. In the study in Sweden, the deviation of the basal area was ±2.3 m2/ha (Burström 2016), while in our study it was significantly bigger, ±3.3 m2/ha (p=0.00). Burström (2016) did not indicate whether the stands surveyed had similar tree heights and species composition, or these indicators varied widely from stand to stand, as they did in our surveys. Similar stand characteristics in the studied stands may explain the significantly smaller variance in the study by Burström (2016).
5. Conclusions
Despite the fact that HprGallring reflected the information obtained by the harvester data based on the height differences rather than on compartment boundaries, the resulting spatial data could be clipped during the post-processing into compartments according to their legal boundaries, and the stand characteristics could be summarized within the compartment boundaries. The harvester data processing must be carried out at a compartment level, analysing the datasets by both the dominant tree species and age, which will generally enable more accurate calculation of the stand characteristics and identification of measurement errors.
The study found that there was a statistically significant correlation between the manual measurement-based inventory data and tree height values estimated by HprGallring and the biggest correlation was found in pine stands.
The highest accuracy in prediction of tree diameter was found in spruce stands, but the accuracy of the estimates by HprGallring deteriorated with the increase of stand age. This could be explained by different ratios of tree diameter at a stump level and at 1.3 m height of the trees felled, and by different cutting height in older stands and the mathematical definition of the zero point in the tree model.
Differences in the diameter measurements may be also associated with different approaches applied. In Latvia, the diameter is measured at 1.3 m height from the root collar, while in Sweden it is measured at 1.3 m height from the ground. This factor may have had a significant effect also on basal area and growing stock calculations, especially in mature stands.
The forest stand characteristics produced using HprGallring correlated closely with the manual measurement and photogrammetric data; however, the forest stand inventory data calculated from harvester data are not sufficiently accurate to comply with the regulatory uncertainty thresholds in Latvia if manual measurement-based data are used as a trustable reference for comparison.
The accuracy of HprGallring calculations was strongly influenced by the ratio of the diameter and species composition of the trees to be felled and the trees to be kept. The greater the differences between felled and remaining trees, the higher uncertainty appeared in the estimates.
The most important shortcomings in the remote sensing-based stand inventory characteristics identified in the study are reduced accuracy in compartments with complex configurations, adjusting to compartments with significantly different tree heights, and the lack of an efficient method for identifying species in mixed stands.
Acknowledgments
Many thanks to the LSFRI Silava team of the Forest Operations and Biofuel Department for support in data acquisition and analysis and to Skogforsk Institute for providing HprGallring software and support in data analysis.
Funding
The study is funded by the project »Technologies for the improvement of efficiency of forest management processes« (No. 5-5.9_003v_101_16_47). The contribution of A.Z. is funded by the European Regional Development Fund project »Remote sensing based system for forest risk factor monitoring« (No. 1.1.1.1/21/A/040). The contribution of A.S. is funded by the European Union Fund project (No. 8.2.2.0/20/I/001).
6. References
Arlinger, J., Möller, J.J., Sorsa, J.A., Räsänen, T., 2012: Introduction to StanForD 2010. Structural descriptions and implementation recommendations. Skogforsk.
AS »Latvijas valsts meži«, 2008: Kopšanas Ciršu Rokasgrāmata, A guide for thinning. Rīga. Available online: https://www.lvm.lv/images/lvm/Petijumi_un_publikacijas/KC-rokasgramata.pdf.
Barth, A., Holmgren, J., 2013: Stem taper estimates based on airborne laser scanning and cut-to-length harvester measurements for pre-harvest planning. International Journal of Forest Engineering 24(3): 161–69. https://doi.org/10.1080/14942119.2013.858911
Bhuiyan, N., Möller, J., Hannrup, B., Arlinger, J., 2016: Arealberäkning Samt Registrering Av Kranvinkel För Identifiering Av Stickvägsträd Och Beräkning Av Gallringskvot. Report from Skogforsk. Vol. 899. Available online: https://www.skogforsk.se/cd_20190114161523/contentassets/6eda4307138347648171f87e3d9a3885/automatisk-gallringsuppfoljning-arealberakning-samt-registrering-av-kranvinkel-for-identifiering-av-sticktrad-och-berakning-av-gallringskvot-arbetsrapport-899-2016.pdf
Burström, O., 2016: Rätt Gallringskvalitet Med Automatisk Gallringsuppföljning. Arbetsrapport. Umeå: Sveriges lantbruksuniversitet.
Delmaire, M., Labelle, E.R., 2022: Use of harvester data to estimate the amount of merchantable non-utilized woody material remaining after mechanized cut-to-length forest operations. Forests 13(6): 945. https://doi.org/10.3390/f13060945
Hauglin, M., Hansen, E.H., Næsset, E., Busterud, B.E., Gjevestad, J.G.O., Gobakken, T., 2017: Accurate single-tree positions from a harvester: a test of two global satellite-based positioning systems. Scandinavian Journal of Forest Research 32(8): 774–81. https://doi.org/10.1080/02827581.2017.1296967
Holmgren, J., Barth, A., Larsson, H., Olsson, H., 2012: Prediction of stem attributes by combining airborne laser scanning and measurements from harvesters. Silva Fennica 46(2): 227–39. https://doi.org/10.14214/sf.56
Holopainen, M., Vastaranta, M., Rasinmäki, J., Kalliovirta, J., Mäkinen, A., Haapanen, R., Melkas, T., Yu, X., Hyyppä, J., 2010.: Uncertainty in timber assortment estimates predicted from forest inventory data. European Journal of Forest Research 129: 1131–1142. https://doi.org/10.1007/s10342-010-0401-4
Ivanovs, J., Kaleja, S., Lazdins, A., 2019: LiDAR Datu Izmantošana Koku Augstuma Novērtēšanai (Using LiDAR data for tree height estimation). Ziņojums. Salaspils.
Kemmerer, J., Labelle, E.R., 2021: Using harvester data from on-board computers: a review of key findings, opportunities and challenges. European Journal of Forest Research 140: 1–17. https://doi.org/10.1007/s10342-020-01313-4
Kiljunen, N., 2002: Estimating dry mass of logging residues from final cuttings using a harvester data management system. International Journal of Forest Engineering 13(1): 17–25. https://doi.org/10.1080/14942119.2002.10702452
Köppler, L., 2017: Automatisk Gallringsuppföljning – Utvärdering Av Stickvägslängd Beräknad Från Skördarnas Produktionsdata. Arbetsrapport . Umeå: Sveriges lantbruksuniversitet.
Larsson, M., 2017: Precision i Automatisk Gallringsuppföljning. Arbetsrapport. UMEÅ: Sveriges lantbruksuniversitet.
Leitner, T., Stampfer, K., Visser, R., 2014: Analysing log length measurement accuracy of harvester and processor heads. Austrian Journal of Forest Science 131(3): 129–46.
Liepa, I., 2018: Meža Taksācija. Jelgava: Studentu biedrība, Šalkone.
Lu, K., Bi, H., Watt, D., Strandgard, M., Li, Y., 2018: Reconstructing the size of individual trees using log data from cut-to-length harvesters in Pinus Radiata plantations: a case study in NSW, Australia. Journal of Forestry Research 29(1): 13–33. https://doi.org/10.1007/s11676-017-0517-1
Maltamo, M., Bollandsas, O.M., Vauhkonen, J., Breidenbach, J., Gobakken, T., Naesset, E., 2010: Comparing different methods for prediction of mean crown height in Norway spruce stands using airborne laser scanner data. Forestry 83(3): 257–68. https://doi.org/10.1093/forestry/cpq008
Ministru kabineta noteikumi Nr.935. 2012. Noteikumi Par Koku Ciršanu Mežā (Regulations on Cutting Trees in the Forest). Rīga. Latvijas Vēstnesis.
Murphy, G., Wilson, I., Barr, B., 2006: Developing methods for pre-harvest inventories which use a harvester as the sampling tool. Australian Forestry 69(1): 9–15. https://doi.org/10.1080/00049158.2006.10674982
Nieuwenhuis, M., Dooley, T., 2006: The effect of calibration on the accuracy of harvester measurements. International Journal of Forest Engineering 17(2): 25–33. https://doi.org/10.1080/14942119.2006.10702533
Olivera, A., Visser, R., 2014: Integration of harvester data and geospatial information. Harvesting Technical Note HTN07-03. Future Forest Research Ltd. Rotorua, New Zealand.
Olivera, A., Visser, R., Acuna, M., Morgenroth, J., 2016: Automatic GNSS-enabled harvester data collection as a tool to evaluate factors affecting harvester productivity in a Eucalyptus spp. harvesting operation in Uruguay. International Journal of Forest Engineering 27(1): 15–28. https://doi.org/10.1080/14942119.2015.1099775
Rasinmäki, J., Melkas, T., 2005: A method for estimating tree composition and volume using harvester data. Scandinavian Journal of Forest Research 20(1): 85–95. https://doi.org/10.1080/02827580510008185
Siipilehto, J., Lindeman, H., Vastaranta, M., Yu, X., Uusitalo, J., 2016: Reliability of the predicted stand structure for clear-cut stands using optional methods: airborne laser scanning-based methods, smartphone-based forest inventory application Trestima and pre-harvest measurement tool EMO. Silva Fennica 50(3): 1568. https://doi.org/10.14214/sf.1568
Stendahl, J., Dahlin, B., 2002: Possibilities for harvester-based forest inventory in thinnings. Scandinavian Journal of Forest Research 17(6): 548–55. https://doi.org/10.1080/02827580260417206
Strandgard, M., Walsh, D., 2012: Assessing measurement accuracy of harvester heads in Australian pine plantation operations. Cooperative Research Centre for Forestry Technical Report 225.
Strandgard, M., 2009: Evaluation of manual log measurement errors and its implications on harvester log measurement accuracy. International Journal of Forest Engineering 2(2): 9–16. https://doi.org/10.1080/14942119.2009.10702578
© 2023 by the authors. Submitted for possible open access publication under the
terms and conditions of the Creative Commons Attribution (CC BY) license (http://creativecommons.org/licenses/by/4.0/).
Authors' addresses:
Aigars Strubergs, MSc *
e-mail: aigars.strubergs@lbtu.lv
Linards Sisenis, PhD
e-mail: linards.sisenis@lbtu.lv
Latvia University of Life Sciences and Technologies
2 Lielā Street
Jelgava, LV-3001
LATVIA
Agris Zimelis, PhD
e-mail: agris.zimelis@silava.lv
Santa Kaleja, PhD
e-mail: santa.kaleja@silava.lv
Janis Ivanovs, MSc
e-mail: janis.ivanovs@silava.lv
Andis Lazdins, PhD
e-mail: andis.lazdins@silava.lv
Latvian State Forest Research Institute »Silava«
Rīga str. 111
Salaspils, LV-2169
LATVIA
* Corresponding author
Received: April 17, 2023
Accepted: October 27, 2023
Original scientific paper