Effect of Prior Tree Marking on Cutting Productivity and Harvesting Quality
doi: 10.5552/crojfe.2024.2213
volume: 45, issue:
pp: 17
- Author(s):
-
- Pohjala Johannes
- Vahtila Mika
- Ovaskainen Heikki
- Kankare Ville
- Hyyppä Juha
- Kärhä Kalle
- Article category:
- Original scientific paper
- Keywords:
- tree marking, productivity, thinning, time study, harvester, forest machine operator, cut-to-length (CTL) method, logging
Abstract
HTML
Prior tree marking is used to guide loggers or forest machine operators on which trees to cut to achieve the desirable silvicultural quality of a thinning treatment. In the future, this beneficial but expensive human work could be automated with advanced driver assistance systems. This study aimed to investigate the effect of conventional prior tree marking on cutting productivity and harvesting quality of the first and later thinnings. A comparative time study was conducted with four experienced harvester operators. The operators thinned 4825 stems with the cut-to-length (CTL) harvesting method in eight thinning stands. The time consumption of the different time elements of cutting work was measured to model the cutting productivity with average values or regress these values against the stem volume or density of removal. Prior tree marking increased the cutting productivity by an average of 2.8% in the first thinnings and 2.7% in later thinnings by reducing the time consumption of boom-out (positioning the harvester head for cut) and moving. The operator effect was notable, even though only experienced operators participated in the study. For some operators, prior tree marking did not make cutting work more efficient, and sometimes hampered it. Prior tree marking improved the quality of the remaining stands in thinnings by producing a more accurate density of remaining trees after the harvesting operation in relation to thinning guidelines. When the stands were not marked, the operators chose trees of poor quality with almost the same accuracy as the forester. These findings lay the foundation for the next-generation operators’ guidance and decision support systems, which could detect trees around the harvester and guide the operator in tree selection and managing better thinning intensity in cutting work. Although prior tree marking increased productivity only marginally, the improvement in the quality of harvesting operations must be acknowledged.
Effect of Prior Tree Marking on Cutting Productivity and Harvesting Quality
Johannes Pohjala, Mika Vahtila, Heikki Ovaskainen, Ville Kankare, Juha Hyyppä, Kalle Kärhä
Abstract
Prior tree marking is used to guide loggers or forest machine operators on which trees to cut to achieve the desirable silvicultural quality of a thinning treatment. In the future, this beneficial but expensive human work could be automated with advanced driver assistance systems. This study aimed to investigate the effect of conventional prior tree marking on cutting productivity and harvesting quality of the first and later thinnings. A comparative time study was conducted with four experienced harvester operators. The operators thinned 4825 stems with the cut-to-length (CTL) harvesting method in eight thinning stands. The time consumption of the different time elements of cutting work was measured to model the cutting productivity with average values or regress these values against the stem volume or density of removal. Prior tree marking increased the cutting productivity by an average of 2.8% in the first thinnings and 2.7% in later thinnings by reducing the time consumption of boom-out (positioning the harvester head for cut) and moving. The operator effect was notable, even though only experienced operators participated in the study. For some operators, prior tree marking did not make cutting work more efficient, and sometimes hampered it. Prior tree marking improved the quality of the remaining stands in thinnings by producing a more accurate density of remaining trees after the harvesting operation in relation to thinning guidelines. When the stands were not marked, the operators chose trees of poor quality with almost the same accuracy as the forester. These findings lay the foundation for the next-generation operators' guidance and decision support systems, which could detect trees around the harvester and guide the operator in tree selection and managing better thinning intensity in cutting work. Although prior tree marking increased productivity only marginally, the improvement in the quality of harvesting operations must be acknowledged.
Keywords: tree marking, productivity, thinning, time study, harvester, forest machine operator, cut-to-length (CTL) method, logging
1. Introduction
Thinnings play a crucial role in sustainable forestry, controlling the growth and development of forest stands. The proportion of thinning as a silvicultural activity is assumed to have increased due to its higher social acceptability as a timber harvesting method (Ribe 2006) and smaller environmental impact compared to clear cutting (Keenan and Kimmins 1993, Nieminen et al. 2018). The total harvested area in Finland was 711,000 ha in 2020, from which a share of 22% was first thinnings, and 51% later thinnings (Natural Resource Institute Finland 2022). Despite this, the share of industrial roundwood harvested from thinning stands has remained slightly over 40% of all harvested roundwood (Strandström 2022).
Cut-to-length (CTL) harvesting method includes two separate operations: cutting using a harvester and forwarding using a forwarder (Gellerstedt and Dahlin 1999). Harvester and forwarder operators are responsible for balancing the productivity and quality of thinning work. Nowadays, harvesting instructions and maps are transmitted to the onboard computers of modern CTL harvesters. The harvesting instructions include a thinning method, which can be specified as low thinning, thinning from above, or, in uneven-aged forests, selection thinning. Thinning from below (i.e. removal of suppressed and co-dominant trees) is the most common thinning method in Finland due to its easy applicability, but not its economic viability (Pukkala et al. 2015). Irrespective of the thinning method, harvester operators are responsible for selecting trees that will be individually removed during their work. Prior tree marking is rare in Scandinavia because it incurs additional costs on wood procurement operations that are difficult to cover through improved harvesting productivity and quality.
The operators choose the trees along their everyday working routine, endeavouring to create a stand with good quality trees with a uniform spatial distribution and height (Kärhä et al. 2021). Mainly due to the high costs of the CTL harvesting machines and thus demand for high productivity, the intensity of thinning has increased (Lageson 1997, Mäkinen et al. 2006). However, harvesting productivity should not be improved at the expense of thinning quality. The official inventories carried out by the forest authorities confirm that poor thinning quality has increased in recent years in Finland (Finnish Forest Centre 2022). The most significant challenge is excessively heavy thinning intensity compared to Best Practices for Sustainable Forest Management in Finland (Äijälä et al. 2019). Excessively heavy harvesting might lead to growth and economic losses, particularly in young Scots pine (Pinus sylvestris L.) stands, in which the growth of trees slows down in the 10–15 years following excessive thinning (Vuokila 1981, Hynynen and Arola 1999). Moreover, the risk of windfall and snow breaks increases as thinning intensity increases (Wallentin and Nilsson 2014).
The productivity of mechanised harvesting work is dependent on several factors, which can be categorised into factors caused by environmental and working conditions, operators, working methods and techniques, machine characteristics and organisational factors. Cutting productivity is significantly dependent on the stem size of the removal (e.g. Kärhä et al. 2004, Nurminen et al. 2006, Spinelli and Magagnotti 2013): the work time per cubic metre of single-grip harvesters increases when the size of the stem decreases. Furthermore, operators' skills and experience have a significant impact on cutting productivity (Sirén 1998, Kärhä et al. 2004, Ovaskainen 2009, Purfürst 2010, Wenhold et al. 2020). Therefore, advanced driver assistance systems (ADASs) have more potential to improve harvesting productivity compared to ordinary mechanical engineering (Ylimäki et al. 2012). The ADASs can improve both the productivity and the quality of harvesting work by alleviating the strain and uncertainty of decision making (Ylimäki et al. 2012, Kärhä et al. 2021) and guiding the operator towards cost- and energy-efficient working methods and techniques (Ylimäki et al. 2012). In addition, several automation technologies combined with ADASs can further increase harvesting productivity. The dynamic motion control of the crane can assist the operator in movements (La Hera and Ortiz Morales 2019, Lindroos et al. 2019). A simultaneous location and mapping (SLAM) algorithm can locate a machine precisely and detect its surroundings (Tang et al. 2015).
SLAM and mobile laser scanning (MLS, also called »mobile Lidar«) technology allow new possibilities for ADASs by providing three-dimensional (3D) data from the surroundings for various mapping and environmental analysis purposes. The data is accurate enough for individual tree modelling and forest inventory (Kukko et al. 2017). Recently, it has been shown that various MLSs can provide high-accurate field reference data (Hyyppä et al. 2020). Tree maps of harvester surroundings (Melkas et al. 2014), real-time density values, or even highlighted trees might be in use in the future. Automatic tree selection could be based on spatial distribution, tree size or tree defects derived from sensor data. Augmented reality (AR) could enrich the operator's visual experience in such applications. For instance, Palonen et al. (2017) introduced an AR concept to a forest machine, showing an augmented video stream with a 3D point cloud of the environment and a simple wireframe model of the forestry crane.
The time consumption and productivity of harvesting work are widely discussed in forest engineering. Less attention, however, is focused on identifying the benefits of tree marking, although this is fundamental information for developing ADASs to guide the operator in tree selection. The results of previous research on such benefits have not been conclusive. Kuitto and Mäkelä (1988) explored the most economical working methods in thinning in the early days of CTL harvesters. In their study, either the forester or the harvester operator selected trees for cutting. Positioning for the cut was slower in marked thinning because the operator had to search for an appropriate stem and move more to reach it. The authors established that tree selection by the operator was a better alternative because it resulted in higher productivity, smaller costs and fewer damaged remaining trees. Kellogg and Bettinger (1994) concluded that productivity did not differ statistically significantly between marked and reference stands, but that marking reduced the average times per stem used in moving, positioning to cut and planning compared to the reference. Inconsistent with these results, Bort (2005) reported a 20% increase in harvester performance compared to the reference stand. However, since these studies, forest machine manufacturers, researchers, and educational and training organisations have improved harvester machinery and operators' working techniques (Gellerstedt and Dahlin 1999, Guimier 1999, Spinelli et al. 2019).
Despite technical and educative progress, prior tree marking has not been established to affect harvesting productivity. Spinelli and Magagnotti (2013) investigated tree marking patterns in the Italian Alps. In such mountainous regions, multifunctional and close-to-nature silvicultural methods prevail. The study consisted of two different methods: the uniform spatial distribution method and clustered method. In the first method, an operator cut only the marked trees. In the latter, the operator chose from the trees located along presumed strip roads. The method had no significant effect on harvesting productivity or cost. Similarly, Holzleitner et al. (2019) did not find a significant difference in tree selection systems. In their study, an operator thinned the site with the future or final crop tree method, or with heavy thinning from above; marking reduced harvesting damage of the remaining trees from 7.0% to 3.2% (Holzleitner et al. 2019). Yeo and Stewart (2000) reported that operators achieved almost all silvicultural requirements in the thinning of plantations, but factors such as inexperienced operators or poor visibility (e.g. nighttime harvesting or branchy trees) could decrease the harvesting quality.
As already mentioned, prior tree marking incurs additional costs on wood procurement operations. Therefore, due to cost efficiency, it is justifiable to desist from prior tree marking when the operator selection is sufficient both in terms of cutting productivity and harvesting quality. However, if the harvester is equipped with sensors and a real-time proposal of tree selection, the benefits of prior tree marking can be achieved with significantly lower costs compared to conventional prior tree marking. Thus, a solid foundation is needed to confirm the benefits of prior tree marking for cutting work.
This study aimed to investigate the effect of prior tree marking on cutting productivity and the quality of harvesting work. The main research question was: Can the cutting productivity or harvesting quality be improved with prior tree marking? It was hypothesised that prior tree marking would ease the operators' work, and therefore reduce the time consumption in the boom-out and moving-work phases.
2. Materials and Methods
2.1 Study Stands
The time-study material was collected in Juuka, Lieksa and Polvijärvi, in eastern Finland, in 2018 (Stand 1: 63°30'N, 30°30'E; Stand 2: 62°73'N, 29°55'E; Stand 3: 63°38'N, 30°29'E; Stand 4: 63°19'N, 30°29'E; Stand 5: 63°32'N, 30°19'E; Stands 6 and 7: 63°40'N, 30°29'E; Stand 8: 63°02'N, 29°06'E in WGS84). These stands were relatively accessible Scots pine-dominated mineral soils, of which six were in oligotrophic vitis idaea-type forests and two in mesotrophic myrtillus-type forests. Table 1 summarises the descriptions of the study stands. The study stands consisted of four first-thinning and four later-thinning stands, which are referred to by the thinning type. The study layout included a total of 19 first-thinning and 22 later-thinning time-study plots. Forest workers performed the preclearance of undergrowth trees where necessary, and all stands were thinned from below.
Table 1 Description of study stands by operator, thinning type and treatment
|
Stand |
Operator |
Thinning type |
Initial stand |
Treatment |
Removals |
Thinning intensity % |
Total removals n |
|||||
|
Area ha |
Height m |
Density trees ha-1 |
M = Marked R = Reference |
Plots n |
m³ ha-1 |
stems ha-1 |
Stem volume m3 |
|||||
|
1 |
A |
First thinning |
1.18 |
13.7 |
1720 |
M |
3 |
29 |
637 |
0.046 |
37 |
379 |
|
R |
3 |
46 |
872 |
0.053 |
50 |
506 |
||||||
|
2 |
A |
First thinning |
0.69 |
17.5 |
1380 |
M |
2 |
58 |
631 |
0.093 |
48 |
225 |
|
R |
3 |
62 |
766 |
0.081 |
53 |
255 |
||||||
|
3 |
B |
First thinning |
0.76 |
13.6 |
1530 |
M |
2 |
43 |
639 |
0.068 |
45 |
276 |
|
R |
2 |
50 |
894 |
0.056 |
55 |
294 |
||||||
|
4 |
C |
First thinning |
1.28 |
15.4 |
1880 |
M |
2 |
63 |
903 |
0.069 |
48 |
644 |
|
R |
2 |
72 |
983 |
0.073 |
52 |
559 |
||||||
|
5 |
A |
Later thinning |
1.95 |
17.0 |
740 |
M |
4 |
32 |
250 |
0.127 |
32 |
289 |
|
R |
4 |
31 |
227 |
0.135 |
32 |
180 |
||||||
|
6 |
B |
Later thinning |
1.58 |
17.4 |
900 |
M |
3 |
32 |
278 |
0.115 |
32 |
227 |
|
R |
3 |
55 |
429 |
0.128 |
47 |
328 |
||||||
|
7 |
B |
Later thinning |
1.26 |
18.0 |
750 |
M |
2 |
36 |
302 |
0.120 |
37 |
187 |
|
R |
2 |
41 |
246 |
0.166 |
36 |
158 |
||||||
|
8 |
D |
Later thinning |
1.28 |
19.9 |
630 |
M |
2 |
64 |
243 |
0.262 |
37 |
160 |
|
R |
2 |
60 |
256 |
0.235 |
43 |
158 |
||||||
In total, 4825 trees were cut. The dominant tree species was Scots pine, with a proportion of 82–100% of felled stems in the study stands. The only exception was stand number two, which was birch-dominated (Betula spp.), with a proportion of 99% of felled stems. Furthermore, most of the stands were interspersed with Norway spruce (Picea abies L.), with a proportion of 0–2%. The average age of the trees was 43 years. The total harvested volume was 463 m³ solid over the bark (henceforth m³) from a thinning area of 9.98 ha.
The average volume of removal was 0.063 m3 in the first thinnings and 0.148 m3 in the later thinnings. Initial stand densities ranged from 1380 to 1880 trees ha-1 on first-thinning stands and 630–900 trees ha-1 on later-thinning stands. The thinning intensity ranged from 32% to 55% from the initial stand densities on the time-study plots. Hectare-based removals were 29.4–71.9 m3 ha-1 in the first thinnings and 31.7–55.0 m3 ha-1 in later thinnings. The average diameter at breast height (DBH) on first-thinning plots varied between 9.5 and 12.5 cm in marked stands and between 9.9 and 11.8 cm in reference stands. The average DBH on later-thinning plots was between 13.4–18.5 cm in marked stands and 14.0–17.6 cm in reference stands.
2.2 Harvesters and Operators
Harvester operators selected for the study had at least 10 years of experience in forest-thinning work (Table 2). In addition, they used machines that they regularly operated as part of their employment. Less-skilled and inexperienced operators were not engaged in the study, as they might have caused more variation in results and obscured the effect of prior tree marking. The implementation of the study was explained to the operators at least one week before the field tests. The operators were instructed to work normally to reduce over-performing when being observed.
Table 2 Description of operators and harvesters in time studies
|
Operator |
Harvester |
|||||
|
Code |
Age, y |
Work experience, y |
Manufacturer |
Model |
Harvester head |
Reach, m |
|
A |
36 |
21 |
Komatsu |
931.2 |
C123 |
11 |
|
B |
34 |
10 |
Ponsse |
Scorpion King |
H6 |
11 |
|
C |
50 |
28 |
John Deere |
1170E |
414 |
10 |
|
D |
36 |
16 |
John Deere |
1170E |
413 |
11 |
2.3 Treatments
Two treatments were tested in the study: 1) A selection of trees was made by the forester (»marked«) and 2) by the harvester operator when performing the cutting work (»reference«). Due to practical considerations, the operators did not work at the same stand, but at least two repetitions of the treatment were assigned to one operator in one stand (Table 1). A forester marked the stems based on their silvicultural value, without considerating the technical limitations of the harvester. Each study plot was 20 m in width, which is the common practice in Finland for mechanised thinning operations (Kärhä et al. 2004). However, the lengths of these plots varied to include at least 150 marked stems for a cut in first-thinning plots and 80 marked stems for a cut in later-thinning plots. The repetitions were located next to each other, and blue and red paint separated them from each other to ensure similar conditions (Fig. 1). Coloured sticks and ribbons at 10 m spacing indicated the plot boundaries and the strip roads in the marked plots, whereas reference strip roads were opened freely by the operators. The density of the remaining trees was estimated using these 10×10-m areas when preparing the study plots. Additionally, the red-yellow ribbon in the first thinning indicated the location for the strip road.
Fig. 1 An example of prior tree marked first thinning
After harvesting, the remaining trees were measured using 100-m2 circular plots, which were placed 2.8 m away from the strip road edge (Fig. 2). Harvesting quality, e.g. thinning intensity, strip road width and distance between strip roads, was evaluated with the guidelines defined by the Finnish Forest Centre (Leivo et al. 2021). Thinning models are based on the density of the stand measured by the average basal area per hectare (Äijälä et al. 2019). The basal area values were converted to stem count using conversion tables (Niemistö 1992). The distance between strip roads should be at least 19 m, and the strip road width less than 4.6 m (Leivo et al. 2021). The thinning area of the plot and the distance between strip roads were calculated using an algorithm developed by Melkas et al. (2020). Furthermore, the number of defective remaining trees, such as forked trees or trees suffering from resin top disease, was inventoried in each plot.
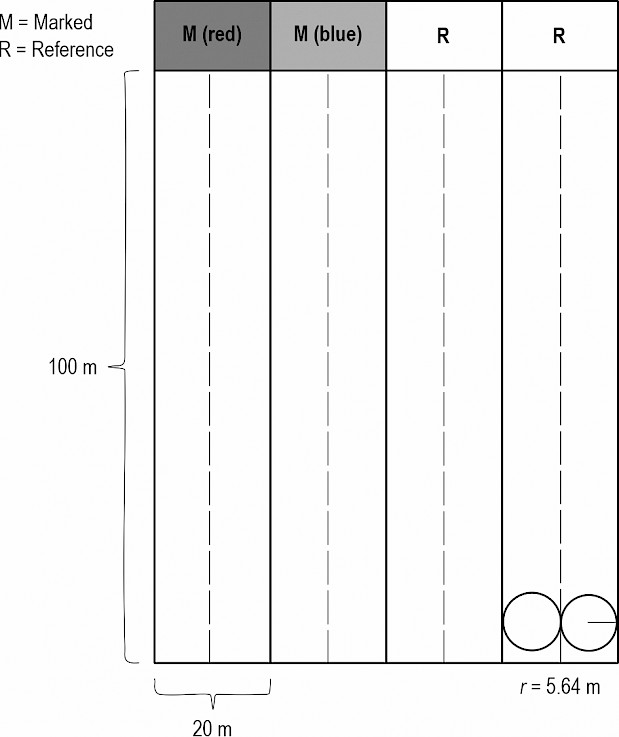
Fig. 2 Layout of time-study plots. Each plot was 20 m wide, with varying length (100 m in this example). Thinning intensity of reference stands was measured from circle plots (r = 5.64 m)
The time-study data from the cutting operation was collected in daylight using a video camera. The video camera was attached to the cabin cockpit of the harvester. The total length of the video was 28.7 hours, which was analysed using an MS Excel-based tool to identify different work phases of work cycles. This tool recorded the time stamps of every break point when shifting to the next element of cutting work with an accuracy of 0.1 seconds. In addition, the research material included the harvester's automatically collected data (hpr and stm files of stem volumes and dimensions). The time-study material joined and matched with the harvester stem data enabled observation of the time consumption of cutting work in relation to stem volume.
The time elements used in the study followed the division used by Kärhä et al. (2004) and Nurminen et al. (2006). One work cycle included a maximum of six work elements (Table 3). Attention was paid to abnormal work cycles. These appeared when operators cut forked (103 incidences), top-broken (75 incidences) or fallen trees (38 incidences), sowing tuft (14 incidences) or artificial snags (2 incidences). To keep the scope for the effect of marking, the abnormal work cycles were either excluded or calculated as miscellaneous times. The processing time models were therefore free of these anomalies. In addition, miscellaneous time included collecting treetops (snow breaks). Occasionally, the cutting of a marked tree required the felling of a remaining tree, or the operator compensated for a marked tree in a difficult-to-reach location with another, more accessible tree. The operators reported situations where they deviated from marking on the video recordings.
Table 3 Description of work elements used in time study
|
Work element |
Description |
|
Boom-out |
Started when the harvester head moved toward the tree and grabbed it and ended when the harvester head rested on the tree and the felling cut began |
|
Felling |
Started from the felling cut and ended when the feeding and delimbing of the stem started. Felling also included the possible feeding of the stem until the harvester head was in the levelled position |
|
Processing |
Included delimbing, cross-cutting, and sorting of logs at the harvesting site. Started when the feeding rolls started to turn and ended when delimbing knives opened and the last piece of the tree dropped from the head of the harvester |
|
Boom-in |
Steering the harvester head to the front of the harvester before moving forward or changing work sector; reversing the harvester |
|
Moving |
Started when the harvester started to move and ended when the moving halted or the boom started to reach out |
|
Miscellaneous |
Disruption in productive time, e.g. the top of the stem was jammed in the harvester head or a technical break that did not require maintenance. Organising was most often sorting of stems or moving of logging residues |
2.4 Data Analysis
The research data were compiled from three different sources: the machine measurement system, time study data and field measurements (Fig. 3). The time study data was joined plot-by-plot to the correct stem using running stem count as the key in MS Excel.
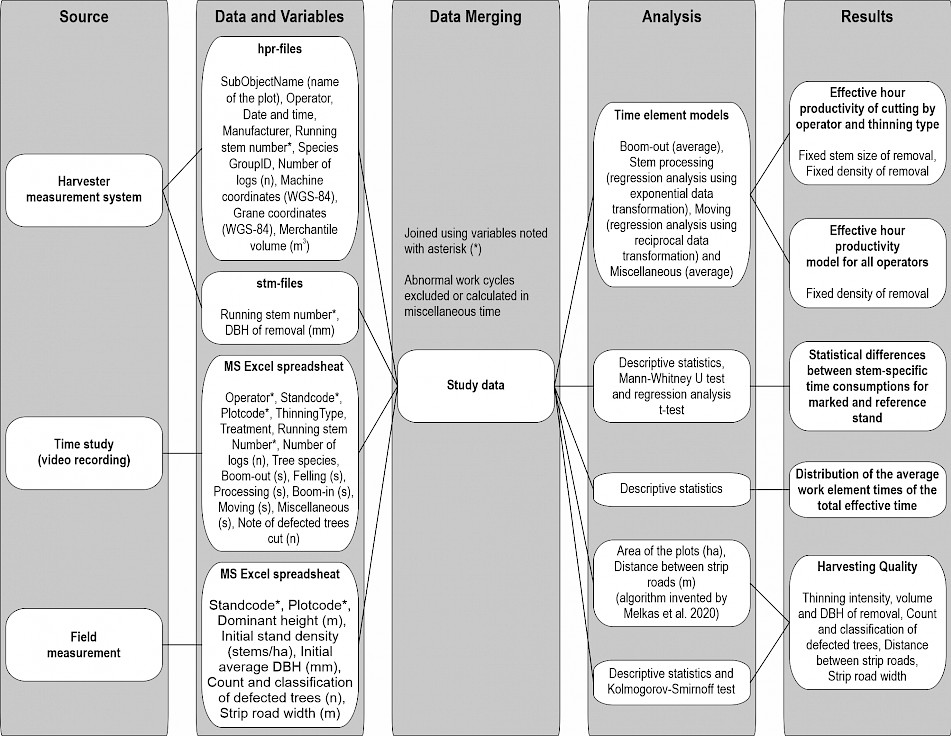
Fig. 3 Material and methods used in the study
It was assumed that marking especially has an effect on boom-out and moving. In that sense, these were the most relevant time elements from the perspective of the research question and were treated separately in the analyses. The main time consumption elements of productive cutting work used for modelling purposes were as follows:
Boom-out (y1)
Stem processing (felling, delimbing, cross-cutting, and boom-in) (y2)
Moving (y3)
Miscellaneous time (y4).
The distributions of time elements were not normally distributed. A Shapiro–Wilk test was used to confirm this visual finding. A non-parametric Mann–Whitney U test was used to determine whether there was a difference in stem-specific time consumptions (s stem-1) for two independent groups, for example, marked and reference, and a Spearman's rank correlation analysis was used to examine dependencies between the variables tested.
Boom-out (y1) had a very small positive relationship with stem volume. Therefore, it was analysed only with descriptive statistics and prediction for models formed using only average time consumption values. Regression analysis with the applicable transformation of a variable was applied to fit the models for stem processing time (y2) and moving time (y3). The stem processing was modelled as a function of stem size and the moving time was modelled as a function of the density of removal. Miscellaneous time (y4), which could not be associated with a certain stem, was added up and divided by the total number of stems removed.
The total effective times by operator, thinning type and treatment (i.e. marked and reference) were calculated as follows (Eq. 1):
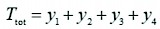 (1)
(1)
Where:
Ttot total effective time consumption of cutting work, s stem-1
y1 time consumption for boom-out, s stem-1
y2 time consumption for stem processing, s stem-1
y3 time consumption for moving, s stem-1
y4 time consumption for miscellaneous time, s stem-1
Total effective times (excluding delay times) were converted to effective hourly productivity (m3 E0-1) (Eq. 2).
 (2)
(2)
Where:
Pe effective hourly productivity of cutting, m3 E0-1
X1 stem volume, m3
Python Anaconda was used for statistical analyses and modelling. Python is a general-purpose language including scientific computing libraries (Oliphant 2007, McKinney 2010).
3. Results
3.1 Time Consumption
Table 4 summarises the time element proportions of total effective time consumption. A few differences were observed when comparing the first and later thinnings in general. First, the share of boom-out and moving time increased in later thinnings. Secondly, the proportion of processing time, including delimbing and cross-cutting, decreased in later thinnings. The time elements of felling, boom-in and miscellaneous time barely differed; only boom-in increased slightly in later thinnings. Treatment had only a small effect on the proportions of time elements and this effect was non-systematic between first thinnings and later thinnings.
Table 4 Distribution of average work element (i.e. boom-out, felling, processing, boom-in, moving and miscellaneous) times of total effective time. Variation range of operators' share is presented in brackets
|
Work element |
First thinning |
Later thinning |
||||||
|
Marked, % |
Reference, % |
Marked, % |
Reference, % |
|||||
|
Boom-out |
28.2 |
[23.7–30.2] |
29.7 |
[25.3–32.0] |
35.0 |
[31.2–45.3] |
33.0 |
[30.5–40.1] |
|
Felling |
23.9 |
[22.8–25.2] |
23.0 |
[22.1–24.1] |
22.5 |
[18.0–23.6] |
23.0 |
[20.5–24.0] |
|
Processing |
31.5 |
[28.0–33.4] |
32.1 |
[26.3–35.0] |
20.7 |
[17.9–22.3] |
20.5 |
[17.4–21.3] |
|
Boom-in |
3.7 |
[1.0–5.2] |
2.9 |
[1.1–4.29] |
4.1 |
[2.6–6.7] |
3.4 |
[2.6–6.2] |
|
Moving |
11.3 |
[7.8–19.3] |
10.1 |
[6.5–20.0] |
15.9 |
[10.4–19.3] |
18.0 |
[13.5–23.6] |
|
Miscellaneous |
1.4 |
[0.5–4.0] |
2.2 |
[0.7–5.2] |
1.8 |
[0.9–2.7] |
2.1 |
[0.5–2.8] |
The share of boom-out, felling, processing and boom-in was almost 90% of the total effective time in the first thinnings and around 80% in the later thinnings. Fig. 4 demonstrates the effective time consumption of these four elements between the operators. In marked stands, the share of boom-out decreased systemically with all operators except operator A. In the marked first- and later-thinning stands, the share of boom-out decreased an average of 1.5% and 2.0%, respectively. In the later thinnings, the time proportion of boom-out increased slightly compared to the first thinnings. The proportion of felling time increased in the marked first thinnings by 0.9% but decreased in the marked later thinnings by 0.5%. The proportion of the processing time decreased by 0.6% in the marked first thinnings but increased by 1.2% in the marked later thinnings. The proportion of boom-in increased with all operators except operator B, averaging 0.9% in the marked first thinnings and 0.7% in the marked later thinnings. To summarise, based on these observations, only the time proportion of the boom-out phase differed systematically.
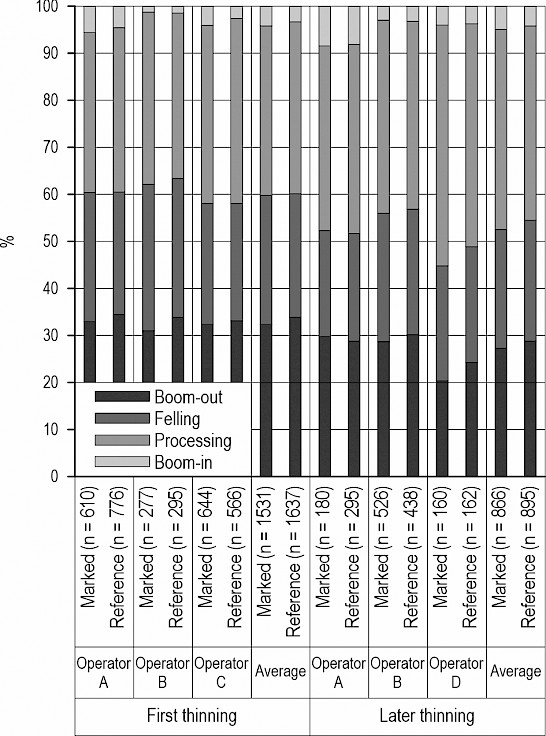
Fig. 4 Distributions of work elements of boom-out, felling, processing (delimbing and cross-cutting) and boom-in of total effective time by treatment, operator and thinning type
The time consumption of boom-out correlated with operator and treatment (marking) (Fig. 5). Boom-out times were calculated as mean time values for operators and treatments (marking and reference) because there was a very small positive relationship between stem volume and boom-out (rs = 0.051, p < 0.001). The average time consumption was 5.2 s stem-1 in the marked first thinnings and 5.5 s stem-1 in the reference first thinnings. This difference did not reach statistical significance (U = 1,206,400, p = 0.17). The average boom-out times were equally fast or faster among all operators except for operator A in marked sites compared to reference sites (Fig. 5). These differences in boom-out were statistically significant for operators B (U = 46,246, p < 0.001) and C (U = 203,803, p < 0.001).
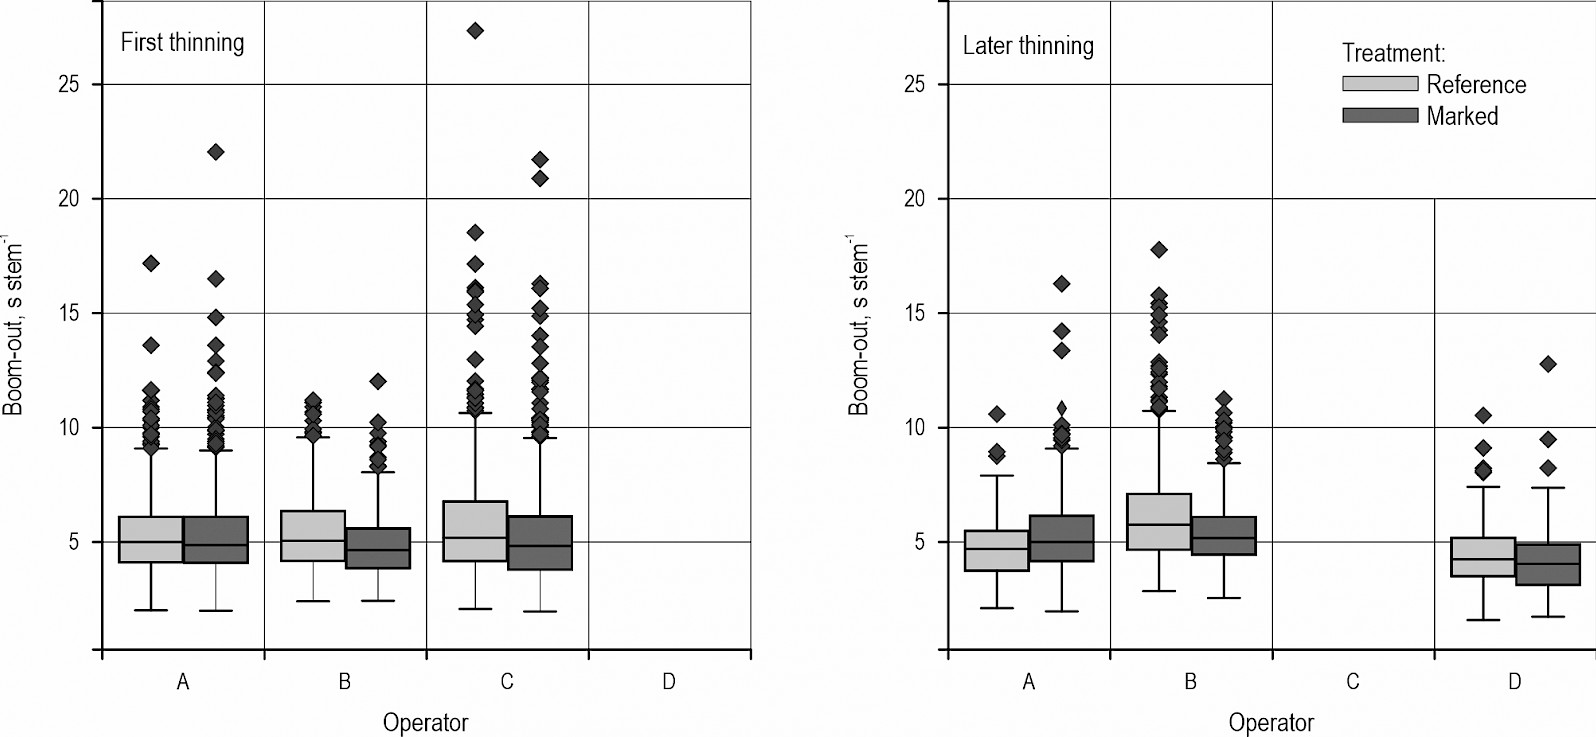
Fig. 5 Boxplot figures of time consumption of boom-out in first and later thinnings by operator and treatment, showcasing distributional characteristics (i.e. minimum, maximum, and first and third quartiles) of each operator and possible outliers
In later thinnings, the time consumption of boom-out averaged 5.2 s stem-1 in marked stands and 5.6 s stem-1 in reference stands. This difference was statistically significant (U = 345,016, p < 0.05). Operator B benefitted the most from marking, with the time consumption of boom-out averaging 0.8 s stem-1 faster in marked stands (U = 115,476, p < 0.001). Likewise, for operator D, the time consumption per stem was 0.3 s faster when the stand was marked (U = 14,020, p = 0.058). Unlike the other operators, for operator A, the time consumption of boom-out increased by an average of 0.6 s stem-1 when the stand was marked.
Stem processing times were significantly correlated with stem volumes (rs = 0.64, p < 0.001). In the regression analysis of all stem processing observations, the effect of prior tree marking did not reach significance in the first thinnings (t = 1.640, p = 0.101) or in later thinnings (t = 1.945, p = 0.052). However, statistically significant differences in stem processing times were found in operator–stand specific tests in five of the eight stands. In the first thinnings, statistically significant differences in stem processing times were found for operator A (Stand 1: t = 3.024, p < 0.01) and operator C (Stand 4: t = –2.165, p < 0.05) and in later thinnings, for operator A (Stand 5: t = 2.652, p < 0.01), operator B (Stand 7: t = –3.629, p < 0.001) and operator D (Stand 8: t = 4.712, p < 0.001). Prior tree marking increased stem processing times for operators A and D and decreased them for operators B and C.
Marking was not included as an independent variable in the regression models for stem processing time, because of an unparallel effect, which failed to reach sufficient significance in the first-thinning or later-thinning stands (Tables 5 and 6). The coefficient of determination (adjusted R2) of the stem processing models ranged from 0.30–0.68 among the operators in the study. Furthermore, only Scots pine stems were included in the overall model to take into account only the dominant tree species. The observations of the operators, operator-specific models and overall model are presented in Fig. 6.
Table 5 Regression models for stem processing time by operator. Models include both first and later thinnings
|
y2 = a + bx1 + cx12 + dx13 |
||||||
|
Operator |
n |
Adjusted R² |
Coefficient |
Estimate of coefficient |
Standard error of estimate |
t-value |
|
A (pine and spruce) |
1314 |
0.384 |
a |
7.540 |
0.186 |
40.442*** |
|
b |
39.294 |
5.078 |
7.738*** |
|||
|
c |
–39.753 |
31.311 |
–1.270 |
|||
|
d |
30.135 |
49.155 |
0.613 |
|||
|
A (birch) |
430 |
0.296 |
a |
7.647 |
0.622 |
12.287*** |
|
b |
60.933 |
23.185 |
2.628** |
|||
|
c |
–111.571 |
235.345 |
–0.474 |
|||
|
d |
–93.400 |
679.404 |
–0.137 |
|||
|
B |
1300 |
0.392 |
a |
7.416 |
0.236 |
31.428*** |
|
b |
80.121 |
5.783 |
13.854*** |
|||
|
c |
–281.880 |
35.853 |
–7.862*** |
|||
|
d |
363.431 |
59.821 |
6.075*** |
|||
|
C |
1172 |
0.344 |
a |
7.454 |
0.240 |
31.020*** |
|
b |
79.920 |
7.700 |
10.379*** |
|||
|
c |
–271.725 |
60.967 |
–4.457*** |
|||
|
d |
325.759 |
124.294 |
2.621** |
|||
|
D |
300 |
0.684 |
a |
7.355 |
1.014 |
7.256*** |
|
b |
15.232 |
14.056 |
1.087 |
|||
|
c |
94.271 |
58.735 |
1.605 |
|||
|
d |
–122.554 |
73.512 |
–1.667 |
|||
|
y2 = stem processing time, s stem-1; x1 = stem volume, m3; a = constant; b, c, d = coefficients of variables; * p < 0.05; ** p < 0.01; *** p < 0.001 |
||||||
Table 6 Regression model for stem processing time of cutting in Scots pine thinning stands
|
y2 = a + bx1 + cx12 + dx13 |
|||||
|
n |
Adjusted R² |
Coefficient |
Estimate of coefficient |
Standard error of estimate |
t-value |
|
3837 |
0.442 |
a |
7.562 |
0.123 |
61.366*** |
|
b |
61.700 |
3.067 |
20.113*** |
||
|
c |
–175.512 |
18.185 |
–9.651*** |
||
|
d |
230.758 |
28.695 |
8.042*** |
||
|
y2 = stem processing time, s stem-1; x1 = stem volume, m3; a = constant; b, c, d = coefficients of variables; * p < 0.05; ** p < 0.01; *** p < 0.001 |
|||||
Fig. 6 Curve modelled for stem processing time (i.e. felling, delimbing, cross-cutting and boom-in) as a function of stem volume removed (Tables 5 and 6)
The density of removal had a significant effect on the moving time per processed stem (Table 7). When the density of removal was low, as often occurred in later thinnings, the moving time per stem increased. Marking reduced the moving time per stem by an average of 0.2 seconds at the same density of removal. When the density of removal was 800 stems ha-1, typical for the first thinnings, the moving time was 2.29 s stem-1 in the reference stand and 2.25 s stem-1 in the marked stand. When the density of removal was 300 stems ha-1, typical for later thinnings, the moving time was 3.64 s stem-1 in the reference stands and 3.42 s stem-1 in the marked stands. The miscellaneous time was, on average, 0.48 s stem-1 in the study stands. As approximately 60% of the miscellaneous time consisted of cutting anomalous trees (e.g. snow-damaged trees) and the random occurrence of technical disturbances, the miscellaneous time was observed as the average value of the whole data.
Table 7 Regression models for moving time in marked and reference thinnings
|
y3 = a + bx2-1 |
||||||
|
Treatment |
n |
Adj. R2 |
Coefficient |
Estimate of coefficient |
Standard error of estimate |
t-value |
|
Marked |
20 |
0.693 |
a |
1.226 |
0.418 |
2.932** |
|
b |
659.661 |
138.057 |
4.778*** |
|||
|
Reference |
20 |
0.748 |
a |
1.149 |
0.409 |
3.635** |
|
b |
644.667 |
157.998 |
4.080** |
|||
|
y3 = moving time, s stem-1; x2 = density of removal, stem ha-1; a = constant; b = coefficient of variable; * p < 0.05; ** p < 0.01; *** p < 0.001 |
||||||
3.2 Cutting Productivity
The operators' average time consumption per time element and total effective times are presented in Table 8. Operator B benefitted the most from prior tree marking. For operators C and D, the benefit was slightly lower. Operator A was an exception for whom prior tree marking reduced productivity. The effective hourly productivity of cutting by the operators ranged from 11.1 to 12.1 m3 E0-1 in marked first thinnings and from 11.0 to 12.6 m3 E0-1 in reference first thinnings, with a stem volume of 0.06 m3 removed. Correspondingly, in marked later thinnings, the effective hourly productivity ranged from 23.1 to 29.3 m3 E0-1, with a stem volume of 0.15 m³ removed. In the reference stands, the effective hourly productivity ranged between 23.2 to 28.4 m3 E0-1. Hence, marking decreased the relative difference between the most and least productive operators from 12.5% to 7.9% in the first thinnings and from 18.4% to 13.0% in the later thinnings. Prior tree marking modestly increased the effective hourly productivity (Fig. 7). On average, productivity increased by 2.8% in the first thinnings and 2.7% in the later thinnings.
Table 8 Descriptive statistics of time element models with a stem volume of 0.06 m3 removed in first thinnings and 0.15 m3 removed in later thinnings. Removal density was set to 800 stems ha-1 in first thinnings and 300 stems ha-1 in later thinnings
|
Operator |
Treatment |
Boom-out s stem-1 |
Stem processing s stem-1 |
Moving s stem-1 |
Misc. s stem-1 |
Total effective time s stem-1 |
Difference % |
|
|
First thinning |
A (pine) |
Marked |
5.1 |
9.8 |
2.4 |
0.5 |
18.0 |
3.4 |
|
Reference |
5.2 |
9.8 |
1.8 |
0.5 |
17.4 |
|||
|
A (birch) |
Marked |
5.7 |
10.9 |
2.1 |
0.5 |
18.8 |
–1.3 |
|
|
Reference |
5.6 |
10.9 |
2.3 |
0.5 |
19.0 |
|||
|
B |
Marked |
4.9 |
11.1 |
2.3 |
0.5 |
18.8 |
–4.2 |
|
|
Reference |
5.5 |
11.1 |
2.5 |
0.5 |
19.6 |
|||
|
C |
Marked |
5.3 |
11.3 |
2.0 |
0.5 |
19.1 |
–0.9 |
|
|
Reference |
5.8 |
11.3 |
1.7 |
0.5 |
19.3 |
|||
|
Later thinning |
A |
Marked |
5.4 |
12.7 |
4.9 |
0.5 |
23.4 |
5.2 |
|
Reference |
4.7 |
12.7 |
4.3 |
0.5 |
22.2 |
|||
|
B |
Marked |
5.4 |
11.9 |
3.4 |
0.5 |
21.2 |
–10.0 |
|
|
Reference |
6.3 |
11.9 |
4.7 |
0.5 |
23.3 |
|||
|
D |
Marked |
4.2 |
11.3 |
2.4 |
0.5 |
18.4 |
–3.2 |
|
|
Reference |
4.5 |
11.3 |
2.7 |
0.5 |
19.0 |
|||
|
First thinnings |
Marked |
5.3 |
10.7 |
2.1 |
0.5 |
18.5 |
–2.8 |
|
|
Reference |
5.5 |
10.7 |
2.3 |
0.5 |
19.0 |
|||
|
Later thinnings |
Marked |
5.2 |
13.6 |
3.4 |
0.5 |
22.7 |
–2.7 |
|
|
Reference |
5.6 |
13.6 |
3.6 |
0.5 |
23.3 |
|||
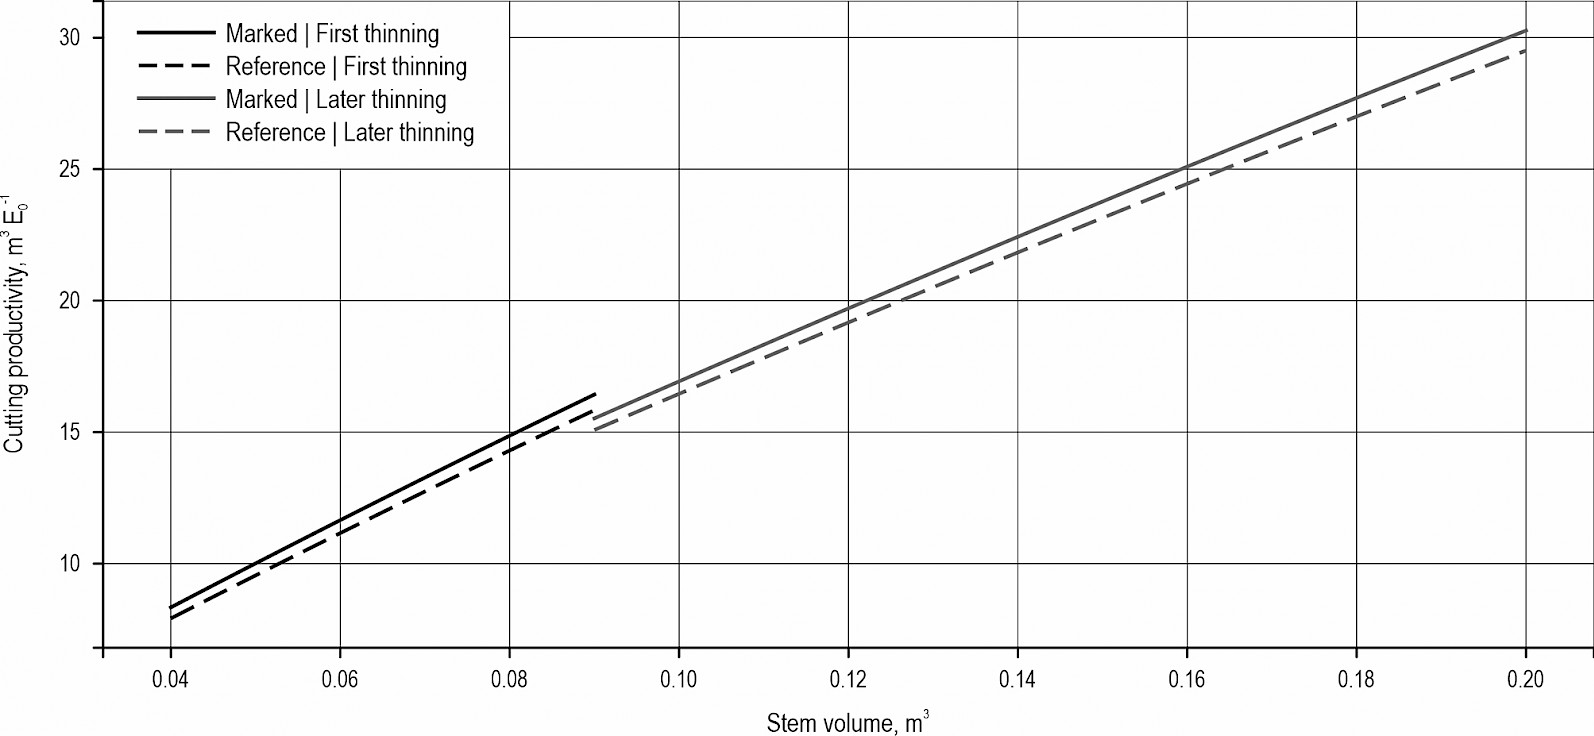
Fig. 7 Cutting productivity in marked and reference first and later-thinning stands as a function of stem volume removed. Removal density used was 800 stems ha-1 in first thinnings and 300 stems ha-1 in later thinnings
3.3 Harvesting Quality
The harvesting quality was assessed between marked and reference plots based on the number of defective trees, the width of strip roads, the distance between strip roads and the density of the remaining trees. The mean diameter and dominant height of trees did not differ systematically between marked and reference plots. Thus, plots were considered comparable with each other. DBH and stem volume distributions of plots and treatment were tested using the Kolmogorov–Smirnoff test. Both of these distributions differed in four of the eight stands. The harvesting removal shifted towards smaller diameters in prior marked stands in five of the eight stands; however, stand variation and thinning intensity may also have caused some of these differences.
The most common tree defect was tree forking in the time-study stands. This was the case in the initial trees as well as in the remaining trees. Among the remaining trees, five forked stems remained from the initial 54 in reference stands, compared with the marked stands, where eight forked stems from the initial 49 forked stems remained. Besides forked trees, only a few other defects remained; one crooked tree in a marked stand, and eight defective trees in the reference stands: two crooked, three with resin top disease and three highly branched trees. In the first-thinning stands, the distance between strip roads ranged between 20.8–22.4 m in the marked plots and 21.0–22.5 m in the reference plots. In the later-thinning stands, strip road distances were 21.7–23.7 m (marked) and 18.7–29.0 m (reference). Strip road width ranged from 4.5–4.9 m in the marked first-thinning stands and 4.3–5.1 m in the reference first-thinning stands.
As shown earlier in Table 1, the thinning intensity was lighter in the marked stands compared to the reference stands. In Scots pine-dominated first thinnings, the remaining stock of stands averaged 946 stems ha-1 in marked stands and 834 stems ha-1 in reference stands; these observations can be compared with the target densities of 900–1100 stems ha-1 at the dominant height of 13–15 m, given by the Best Practices for Sustainable Forest Management in Finland (Äijälä et al. 2019). In birch-dominated first thinning, the remaining stock was 680 stems ha-1 in the marked stand and 679 stems ha-1 in the reference stand. This was a little below the target density of 700 stems ha-1 in both treatments.
In later thinnings, the remaining stock averaged 14.5 m2 ha-1 in marked stands, with a dominant height of 18.1 m. In reference stands, the dominant height was nearly the same, 18.2 m, but the remaining stock was lower, at only 12.8 m2 ha-1. The recommended stocking ranges from 15.5 m2 ha-1 to 19.5 m2 ha-1 (Äijälä et al. 2019). As a result, especially in reference stands, the remaining stock was at a very low level.
4. Discussion
4.1 Evaluation of Study Data and Methods
The main aim of this study was to determine whether prior tree marking affects the productivity of cutting work. The other objective was to discover whether tree marking affects harvesting quality. Altogether, 4825 trees were cut in the time studies. This amount is quite typical for a comparative time study compared to other forest technological studies (e.g. Kärhä 2011, Petty and Kärhä 2014, Magagnotti et al. 2021). Continuous time studies are based on a proven theory (Harstela 1991). Similarly, post-processing of video recordings is a proven technique (Kärhä et al. 2018, Holzleitner et al. 2019). One researcher carried out the element-level time recording to sustain the consistency of the data defining the transition times between the time elements. However, the effective time consumption and productivity models have their limitations. This study aimed to describe the effect of prior tree marking on cutting work by reducing the other factors that might affect the cutting work. Therefore, the field study was conducted in easy daytime summer conditions and employed experienced operators. Consequently, it follows that nationwide time consumption and productivity models of cutting work were outside the scope of this study.
There were additional limitations to this research. The characteristics of the forest stand, including terrain (e.g. old strip roads, natural defects of trees, and topography), may have influenced time consumption and based the productivity of the cutting work. Furthermore, the forester selected the trees by their quality and size, not on the technical limitations of forest machines. Four experienced harvester operators worked with the same technique and forest machines they used in their everyday work. However, prior tree marking was a new working method for all operators and they had no possibility to get acquainted with it beforehand.
In this study, high productivity was observed compared to previous studies (Kärhä et al. 2004, Nurminen et al. 2006, Holzleitner et al. 2019, Jylhä et al. 2019). There are several reasons for this, beginning with the skill levels and experience of the operators. An average operator reaches the plateau phase on the learning curve after nine months (Purfürst 2010). Therefore the operators in this study can be considered very experienced operators in this respect. Furthermore, desirable harvesting conditions, as well as preclearance of undergrowth trees, enabled the high productivity of cutting work (e.g. Tahvanainen 2001, Kärhä 2006, Kärhä and Bergström 2020). In addition, the technical development of mechanised harvesting work has improved the productivity of harvesters during the last 20 years (Eriksson and Lindroos 2014). Aside from these reasons, the testing procedure might have increased operator productivity momentarily during the relatively short time-study period of 1–3 hours, in a phenomenon known as the »Hawthorne Effect« (Landsberger 1958); thus the instructions to work in a normal work pace.
4.2 Time-Study Results
The proportions of total effective times in this study (Table 4) were generally in line with past studies. In contrast to earlier studies (e.g. Kärhä et al. 2004, Nurminen et al. 2006), a smaller proportion of effective time was observed for moving and, correspondingly, a larger proportion was observed for boom-out and felling. However, comparisons should be interpreted with caution, because the definition of the time elements may differ between studies. This study did not include the time element of clearing, because all undergrowth was pre-cleared, and snow breaks were calculated as miscellaneous time in order to make the effect of prior tree marking more comparable. Only small differences in the proportions of total effective times between prior tree marked stands and reference stands were found. Most notable was the small decrease in the proportion of boom-out.
The study explored the future possibilities of easing the planning and decision-making processes of tree selection and managing thinning intensity with the future harvester operator guiding system. Stem volume had a larger effect on cutting productivity, as stated in many other papers, but prior tree marking affected the time elements boom-out and moving. Consequently, it slightly increased the cutting productivity. This supports the conclusion that by easing the planning and decision-making duties of harvester operators with ADAS, the productivity of cutting work can be improved (Ylimäki et al. 2012, Kärhä et al. 2021). The effective hourly productivity in the study improved slightly (under 3%), which is parallel to, but less than, the 20% suggested by Bort (2005). In contrast, the result seems to conflict with results reported by Kellogg and Bettinger (1994), Spinelli and Magagnotti (2013) and Holzleitner et al. (2019), where marking did not increase the productivity of thinning work, or by Kuitto and Mäkelä (1988) where it weakened productivity. Typical for forest work studies, the human factor was notable and the findings were somewhat inconclusive. The effect of prior tree marking was to some extent associated with operators' lower productivity. Prior tree marking seemingly improved the productivity of operators B and C, who had lower productivity compared to operators A and D (Table 5). The operators were allowed to compensate for a marked tree in a difficult location with another tree. Therefore, decision-making by the operator on whether to make this compensation or not might have decreased the productivity of the thinning work.
The average time consumption of reaching the tree (boom-out) was, on average, 5.4 s stem-1, which is faster than in the earlier studies reported by Kellogg and Bettinger (1994) (10.9–12.7 s stem-1), Ovaskainen et al. (2004) (8.9 s stem-1) and Nurminen et al. (2006) (6.0 s stem-1). The exceptional observation of operator A might be attributed to the exceptionally long distance between strip roads in the operator's stands, and therefore a wider working range. In brief, prior tree marking decreased the boom-out times by a relative 6–7%. Furthermore, Kellogg and Bettinger (1994) observed a 14% decrease in boom-out time in prior tree marked stands; however, the average time observed was twice as long as that observed in this study due to different site conditions and the technological development of harvesters.
Combined stem processing time for felling, delimbing, cross-cutting and boom-in depended only on stem volume and operator. Polynomial regression models were used to describe the time consumption of stem processing. An operator-specific t-test produced an unexpectedly significant effect on prior tree marking in several stands. The result indicates that treatment (marking) might have some influence on the time consumption of stem processing. Unfortunately, it is impossible to either prove or disprove this effect. Similar to boom-out times, marking decreased the stem processing time of operators B and C and increased that of operators A and D. These differences may be due to the operators' working technique (Ovaskainen et al. 2004) or tacit knowledge (Väätäinen et al. 2005). Nevertheless, in the regression models of stem processing time consumption (Tables 5 and 6), it was assumed that marking did not affect the stem processing times.
In this study, the density of removal correlated significantly with moving time per stem, as expected (Table 7). This finding supports the notion that the time consumption of moving decreases when the number of removed trees increases (Kuitto et al. 1994, Sirén 1998). However, in this study, the moving time per stem was notably shorter compared to the moving time defined by Kuitto et al. (1994). In addition, marking appeared to shorten the average moving time by a relative 11% in the first thinnings and 6% in the later thinnings. This supports Kellogg and Bettinger's (1994) parallel finding of a 4% relative reduction in average moving time in a prior-marked stand. Sirén (1998) noted that the operator's work planning affects the moving time. Prior tree marking eases the planning of work, explaining decreases in the time consumption of moving in marked stands.
4.3 Harvesting Quality Results
The quality of harvesting work was observed from circular plots where the density of remaining trees, dominant height and DBH were measured. In addition, GIS-analysis was used to measure the distance between strip roads and plot areas. The tree damage caused by harvesting work was not assessed. The operators performed better in thinning intensity in marked stands, while operator tree selection in reference stands led to surprisingly low stand densities compared to the recommendations given by the Best Practices for Sustainable Forest Management in Finland (Äijälä et al. 2019). The marked first-thinning stands were harvested to the limits of the target densities, or even a little below, as was the case in the reference stands. In contrast, in the later thinnings, excessive thinning led to non-compliance with recommendations in both the marked and reference stands, but was more notable in the reference stands. However, the initial stand densities were low and stand structure was irregular, especially in the later-thinning stands. Low density of the initial stand has been reported as the primary reason for excessively intensive thinning (Poikela and Äijälä 2006). Furthermore, extra trees were marked, leading to a lower density of remaining trees compared to target densities. The marked extra trees were mostly withering or suppressed by another tree. This measure improved the reliability of the time study, averaging the removal of trees in plots, but apparently influenced the density of the remaining trees.
The DBH and stem volume distributions between marked stands and reference stands differed on half of the stands. Harvesting removal was observed to shift toward larger diameters on the reference stands compared to the less-intensively harvested marked stands. This is logical because an increase in thinning intensity requires an operator to also choose co-dominant trees, which in turn might be an accustomed behaviour. However, the initial tree characteristics might also cause a significant difference, which might influence the reliability of this result.
This study was carried out by experienced harvester operators. Therefore, further research is needed to focus on machine operators with lower skills who are still in the learning phase. Further research is also needed to combine tree and stand parameters for digital tree selection models, which are highly needed for the future ADAS.
5. Conclusions
It is expected that cutting productivity can be improved with ADASs in the future. This study investigated the possibilities of a tree-guiding system easing the tree selection task and monitoring the thinning intensity of the harvester operator by studying the effect of prior tree marking on both cutting productivity and quality of the harvesting work. Prior tree marking improved cutting productivity by 2.7–2.8%. As hypothesised, prior tree marking reduced the average duration of boom-out (positioning harvester head for cut) and moving, even when using experienced and skilled operators. Despite the cutting productivity improvement being rather small, prior tree marking considerably improved harvesting quality by maintaining the desired thinning intensity. Thus, improved harvesting quality will be one of the benefits achieved by future ADAS technologies.
Prior tree marking can be realised using ADAS systems of harvesters and augmented reality. The authors believe that additional future assets of ADAS will include detailed follow-up of remaining stand density, thinning intensity and strip road spacing in real-time, and digital selection of trees to be harvested.
Acknowledgments
The study conducted was funded by Stora Enso Wood Supply Finland and Academy of Finland flagship of science: UNITE Forest-Human-Machine Interplay (337127).
6. References
Äijälä, O., Koistinen, A., Sved, J., Vanhatalo, K., Väisänen, P., Eds. 2019: Metsänhoidon suositukset [Best Practices for Sustainable Forest Management in Finland]. Tapion julkaisuja.
Bort, U., 2005: Preparation of stands in mechanized wood harvesting – effects on performance, costs and silviculture. Nova meh. šumar. 26(2): 41–44.
Eriksson, M., Lindroos, O., 2014: Productivity of harvesters and forwarders in CTL operations in northern Sweden based on large follow-up datasets. Int. J. For. Eng. 25(3): 179–200. https://doi.org/10.1080/14942119.2014.974309
Finnish Forest Centre, 2022: Metsien ensimmäiset harvennushakkuut ovat usein liian voimakkaita [First-thinning cuts in forests are often too heavily]. Finnish Forest Centre, Media Release 06.05.2022.
Gellerstedt, S., Dahlin, B., 1999: Cut-To-Length: The Next Decade. J. For. Eng. 10(2): 17–24. https://doi.org/10.1080/08435243.1999.10702731
Guimier, D., 1999: Canadian Forestry Operations in the Next Century. J. For. Eng. 10(1): 7–12. https://doi.org/10.1080/08435243.1999.10702720
Harstela, P., 1991: Work studies in forestry. University of Joensuu, Silva Carelica 18.
Holzleitner, F., Langmaier, M., Hochbichler, E., Obermayer, B., Stampfer, K., Kanzian, C., 2019: Effect of prior tree marking, thinning method and topping diameter on harvester performance in a first thinning operation – a field experiment. Silva Fenn. 53(3): 10178. https://doi.org/10.14214/sf.10178
Hynynen, J., Arola, M., 1999: Ensiharvennusajankohdan vaikutus hoidetun männikön kehitykseen ja harvennuksen kannattavuuteen. Metsätieteen Aikakauskirja 1999(1): 6436. https://doi.org/10.14214/ma.6436
Hyyppä, E., Yu, X., Kaartinen, H., Hakala, T., Kukko, A., Vastaranta, M., Hyyppä, J., 2020: Comparison of backpack, handheld, under-canopy UAV, and above-canopy UAV laser scanning for field reference data collection in boreal forests. Remote Sens. 12(20): 3327. https://doi.org/10.3390/rs12203327
Jylhä, P., Jounela, P., Koistinen, M., Korpunen, H., 2019: Koneellinen hakkuu: Seurantatutkimus. Publications of the Natural Resources Institute Finland 11/2019.
Kärhä, K., 2006: Effect of undergrowth on the harvesting of first-thinning wood. For. Stud. 45: 101–117.
Kärhä, K., 2011: Integrated harvesting of energy wood and pulpwood in first thinnings using the two-pile cutting method. Biomass Bioenergy 35(8): 3397–3403. https://doi.org/10.1016/j.biombioe.2010.10.029
Kärhä, K., Bergström, D., 2020: Assessing the Guidelines for Pre-Harvest Clearing Operations of Understorey in First Thinnings: Preliminary Results from Stora Enso in Finland. Eur. J. For. Eng. 6(1): 14–22. https://doi.org/10.33904/ejfe.645639
Kärhä, K., Rönkkö, E., Gumse, S.-I., 2004: Productivity and Cutting Costs of Thinning Harvesters. Int. J. For. Eng. 15(2): 43–56. https://doi.org/10.1080/14942119.2004.10702496
Kärhä, K., Anttonen, T., Poikela, A., Palander, T., Laurén, A., Peltola, H., Nuutinen, Y., 2018: Evaluation of Salvage Logging Productivity and Costs in Windthrown Norway Spruce-Dominated Forests. Forests 9(5): 280. https://doi.org/10.3390/f9050280
Kärhä, K., Ovaskainen, H., Palander, T., 2021: Decision-Making Among Harvester Operators in Tree Selection and Need for Advanced Harvester Operator Assistant Systems (AHOASs) on Thinning Sites. In Proceedings of the Joint 43rd Annual Meeting of Council on Forest Engineering (COFE) & the 53rd International Symposium on Forest Mechanization (FORMEC); Chung, W., Sessions, J., Lyons, K., Wigginton, K., Eds. Forest Engineering Family – Growing Forward Together, September 27–30, Corvallis, OR, USA, 15–25 p.
Keenan, R.J., Kimmins, J.P., 1993: The ecological effects of clear-cutting. Environ. Rev. 1(2): 121–144. https://doi.org/10.1139/a93-010
Kellogg, L.D., Bettinger, P., 1994: Thinning Productivity and Cost for a Mechanized Cut-to-Length System in the Northwest Pacific Coast Region of the USA. J. For. Eng. 5(2): 43–54. https://doi.org/10.1080/08435243.1994.10702659
Kuitto, P.-J., Mäkelä, M., 1988: Kuormainharvesteri ensimmäisessä ja toisessa harvennuksessa. Metsäteho Review 7/1988.
Kuitto, P.-J., Keskinen, S., Lindroos, J., Oijala, T., Rajamäki, J., Räsänen, T., Terävä, J., 1994: Puutavaran koneellinen hakkuu ja metsäkuljetu. Metsäteho Report 410.
Kukko, A., Kaijaluoto, R., Kaartinen, H., Lehtola, V.V., Jaakkola, A., Hyyppä, J., 2017: Graph SLAM correction for single scanner MLS forest data under boreal forest canopy. ISPRS J. Photogramm. Remote Sens. 132: 199–209. https://doi.org/10.1016/j.isprsjprs.2017.09.006
Lageson, H., 1997: Effects of Thinning Type on the Harvester Productivity and on the Residual Stand. J. For. Eng. 8(2): 7–14. https://doi.org/10.1080/08435243.1997.10702699
La Hera, P., Ortiz Morales, D., 2019: What Do We Observe When We Equip a Forestry Crane with Motion Sensors? Croat. J. For. Eng. 40(2): 259–280. https://doi.org/10.5552/crojfe.2019.501
Landsberger, H.A., 1958: Hawthorne Revisited. Management and the Worker, its Critics and Developments in Human Relations in Industry. Cornell University: Ithaca, NY, USA.
Leivo, J., Partanen, J., Hytönen, H., Haataja, L., Pirkonen, J., Partamies, M., Santapukki, R., Nousiainen, M., 2021: Tarkastusohje. Finnish Forest Centre, Manual.
Lindroos, O., Mendoza-Trejo, O., La Hera, P., Ortiz Morales, D., 2019: Advances in using robots in forestry operations. In Robotics and automation for improving agriculture; Billingsley, J. Ed. Burleigh Dodds Science Publishing Limited, Cambridge, UK, 1–28 p. http://dx.doi.org/10.19103/AS.2019.0056.18
Magagnotti, N., Spinelli, R., Kärhä, K., Mederski, P., 2021: Multi-tree cut-to-length harvesting of short-rotation poplar plantations. Eur. J. For. Res. 140(2): 345–354. https://doi.org/10.1007/s10342-020-01335-y
Mäkinen, H., Isomäki, A., Hongisto, T., 2006: Effect of half-systematic and systematic thinning on the increment of Scots pine and Norway spruce in Finland. Forestry: J. For. Res. 79(1): 103–121. https://doi.org/10.1093/forestry/cpi061
McKinney, W., 2010: Data Structures for Statistical Computing in Python. In Proceedings of the 9th Python in Science Conference; van der Walt, S., Millman, J., Eds. 9th Python in Science Conference, June 28-30, Austin, TX, USA, 56–61 p. https://doi.org/10.25080/Majora-92bf1922-00a
Melkas, T., Miettinen, M., Hämäläinen, J., Einola, K., 2014: Puukarttajärjestelmä hakkuun tehostamisessa. Metsäteho Report 230.
Melkas, T., Riekki, K., Sorsa, J.-A., 2020: Automated Method for Delineating Harvested Stands Based on Harvester Location Data. Remote Sens. 12(17): 2754. https://doi.org/10.3390/rs12172754
Natural Resources Institute Finland, 2022: Statistics Database. Available at: https://statdb.luke.fi/PXWeb/pxweb/en/LUKE/
Nieminen, M., Hökkä, H., Laiho, R., Juutinen, A., Ahtikoski, A., Pearson, M., Kojola, S., Sarkkola, S., Launiainen, S., Valkonen, S., Penttilä, T., Lohila, A., Saarinen, M., Haahti, K., Mäkipää, R., Miettinen, J., Ollikainen, M., 2018: Could continuous cover forestry be an economically and environmentally feasible management option on drained boreal peatlands? For. Ecol. Manage. 424: 78–84. https://doi.org/10.1016/j.foreco.2018.04.046
Niemistö, P., 1992: Runkolukuun perustuvat harvennusmallit. Metsäntutkimuslaitoksen tiedonantoja 432.
Nurminen, T., Korpunen, H., Uusitalo, J., 2006: Time consumption analysis of the mechanized cut-to-length harvesting system. Silva Fenn. 40(2): 335–363.
Oliphant, T.E., 2007: Python for Scientific Computing. Comput. Sci. Eng. 9(3): 10–20. https://doi.org/10.1109/MCSE.2007.58
Ovaskainen, H., 2009: Timber harvester operators' working technique in first thinning and the importance of cognitive abilities on work productivity. Dissertationes Forestales 79. https://doi.org/10.14214/df.79
Ovaskainen, H., Uusitalo, J., Väätäinen, K., 2004: Characteristics and Significance of a Harvester Operators' Working Technique in Thinnings. Int. J. For. Eng. 15(2): 67–77. https://doi.org/10.1080/14942119.2004.10702498
Palonen, T., Hyyti, H., Visala, A., 2017: Augmented Reality in Forest Machine Cabin. In Proceedings of the 20th World Congress of the International Federation of Automatic Control (IFAC 2017). IFAC-PapersOnLine 50(1): 5410–5417.
Petty, A., Kärhä, K., 2014: Productivity and cost evaluations of energy-wood and pulpwood harvesting systems in early thinnings. Int. J. For. Eng. 25(1): 37–50. https://doi.org/10.1080/14942119.2014.893129
Poikela, A., Äijälä, O., 2006: Harvennusvoimakkuus korjuujäljen osatekijänä. Metsäteho Report 190.
Pukkala, T., Lähde, E., Laiho, O., 2015: Which trees should be removed in thinning treatments? For. Ecosyst. 32(2): 1–12. https://doi.org/10.1186/s40663-015-0056-1
Purfürst, F.T., 2010: Learning curves of harvester operators. Croat. J. For. Eng. 31(2): 89–97.
Ribe, R.G., 2006: Perceptions of Forestry Alternatives in the US Pacific Northwest: Information Effects and Acceptability Distribution Analysis. J. Environ. Psychol. 26(2): 100–115. https://doi.org/10.1016/j.jenvp.2006.05.004
Sirén, M., 1998: Hakkuukonetyö, sen korjuujälki ja puustovaurioiden ennustaminen. Finnish Forest Research Institute, Research Papers 694.
Spinelli, R., Magagnotti, N., 2013: The effect of harvest tree distribution on harvesting productivity in selection cuts. Scand. J. For. Res. 28(7): 701–709. https://doi.org/10.1080/02827581.2013.821517
Spinelli, R., Visser, R., Han, H.-S., 2019: A Decade of Forest Engineering: Achievements and Future Directions. Forests 10(9): 724. https://doi.org/10.3390/f10090724
Strandström, M., 2022: Timber Harvesting and Long-distance Transportation of Roundwood 2021. Metsäteho Result Series 5-EN/2022.
Tahvanainen, M., 2001: Alikasvoksen ennakkoraivauksen vaikutukset koneellisessa harvennushakkuussa. Työtehoseuran Metsätiedote 638.
Tang, J., Chen, Y., Kukko, A., Kaartinen, H., Jaakkola, A., Khoramshahi, E., Hakala, T., Hyyppä, J., Holopainen, M., Hyyppä, H., 2015: SLAM-Aided Stem Mapping for Forest Inventory with Small-Footprint Mobile LiDAR. Forests 6(12): 4588–4606. https://doi.org/10.3390/f6124390
Väätäinen, K., Ovaskainen, H., Ranta, P., Ala-Fossi, A., 2005: Hakkuukoneenkuljettajan hiljaisen tiedon merkitys hakkuutulokseen työpistetasolla. Metsäntutkimuslaitoksen tiedonantoja 937.
Vuokila, Y., 1981: Nuoren männikön kasvureaktion ensiharvennuksen jälkeen. Folia Forestalia 468.
Wallentin, C., Nilsson, U., 2014: Storm and snow damage in a Norway spruce thinning experiment in southern Sweden. Int. J. For. Res. 87(2): 229–238. https://doi.org/10.1093/forestry/cpt046
Wenhold, R., Ackerman, P., Ackerman, S., Gagliardi, K., 2020: Skills development of mechanized softwood sawtimber cut-to-length harvester operators on the Highveld of South Africa. Int. J. For. Eng. 31(1): 9–18. https://doi.org/10.1080/14942119.2019.1578561
Yeo, B.J., Stewart, M., 2000: Thinning Pinus radiata plantation by operator selection: 1. Effects on the residual forest. Aust. For. 63(4): 284–292. https://doi.org/10.1080/00049158.2000.10674843
Ylimäki, R., Väätäinen, K., Lamminen, S., Sirén, M., Ala-Ilomäki, J., Ovaskainen, H., Asikainen, A., 2012: Kuljettajaa opastavien järjestelmien tarve ja hyötypotentiaali koneellisessa puunkorjuussa. Working Papers of the Finnish Forest Research Institute 224.
© 2023 by the authors. Submitted for possible open access publication under the
terms and conditions of the Creative Commons Attribution (CC BY) license (http://creativecommons.org/licenses/by/4.0/).
Authors' addresses:
Johannes Pohjala, MSc *
e-mail: johannes.pohjala@uef.fi
Ville Kankare, PhD
e-mail: ville.kankare@uef.fi
Prof. Kalle Kärhä, PhD
e-mail: kalle.karha@uef.fi
University of Eastern Finland
School of Forest Sciences
P.O. Box 111
80101 Joensuu
FINLAND
Mika Vahtila, MSc
e-mail: mika.vahtila@upm.com
UPM-Kymmene Oyj
Alvar Aallon katu 1
00101 Helsinki
FINLAND
Heikki Ovaskainen, PhD
e-mail: heikki.ovaskainen@metsateho.fi
Metsäteho Oy
Vernissakatu 1
01300 Vantaa
FINLAND
Prof. Juha Hyyppä, D.Sc. (Tech.)
e-mail: juha.hyyppa@nls.fi
Finnish Geospatial Research Institute, FGI
Department of Remote Sensing and Photogrammetry
Vuorimiehenkatu 5
02150 Espoo
FINLAND
* Corresponding author
Received: September 14, 2022
Accepted: December 23, 2022
Original scientific paper