Soil, Driving Speed and Driving Intensity Affect Fuel Consumption of Forwarders
doi: 10.5552/crojfe.2023.1725
volume: 44, issue:
pp: 14
- Author(s):
-
- Prinz Robert
- Mola-Yudego Blas
- Ala-Ilomäki Jari
- Väätäinen Kari
- Lindeman Harri
- Talbot Bruce
- Routa Johanna
- Article category:
- Original scientific paper
- Keywords:
- fuel use, timber extraction, soft soil, tracks, data bus information, sustainable forest operations
Abstract
HTML
Fuel consumption is one of the key parameters in mechanised forest operations, particularly on lower bearing capacity soils, as wheel chains or bogie tracks can have a strong effect on it. This study aims to analyse the fuel consumption of several individual wheeled cut-to-length forwarder set-ups with different types of bogie tracks on peatland using automatic recording of data bus information. Two types of forwarders, 8-wheeled and 10-wheeled, and three types of tracks were tested on peatland in Eastern Finland. A mixed-model approach is the basis to study the fuel consumption as a function of the soil bearing capacity, the number of passes of the machine on the same soil, the section (curve or straight) and other variables related to the machine performance and set-up, for a total of N=27,928 fuel observations on three machines in 33 plots (trail segments). The model results in an R2=0.78; the number of passes increases the fuel consumption significantly, while the soil bearing capacity did not affect the fuel consumption. There are, however, important differences between the machines performance, which are addressed in the model. By contributing to the knowledge on the connection between operational conditions and fuel consumption, the study can contribute to the aim towards a sustainable forest operation through minimizing negative environmental impacts and providing the necessary tools for further research efforts.
Soil, Driving Speed and Driving Intensity Affect Fuel Consumption of Forwarders
Robert Prinz, Blas Mola-Yudego, Jari Ala-Ilomäki, Kari Väätäinen, Harri Lindeman, Bruce Talbot, Johanna Routa
Abstract
Fuel consumption is one of the key parameters in mechanised forest operations, particularly on lower bearing capacity soils, as wheel chains or bogie tracks can have a strong effect on it. This study aims to analyse the fuel consumption of several individual wheeled cut-to-length forwarder set-ups with different types of bogie tracks on peatland using automatic recording of data bus information. Two types of forwarders, 8-wheeled and 10-wheeled, and three types of tracks were tested on peatland in Eastern Finland. A mixed-model approach is the basis to study the fuel consumption as a function of the soil bearing capacity, the number of passes of the machine on the same soil, the section (curve or straight) and other variables related to the machine performance and set-up, for a total of N=27,928 fuel observations on three machines in 33 plots (trail segments). The model results in an R2=0.78; the number of passes increases the fuel consumption significantly, while the soil bearing capacity did not affect the fuel consumption. There are, however, important differences between the machines performance, which are addressed in the model. By contributing to the knowledge on the connection between operational conditions and fuel consumption, the study can contribute to the aim towards a sustainable forest operation through minimizing negative environmental impacts and providing the necessary tools for further research efforts.
Keywords: fuel use, timber extraction, soft soil, tracks, data bus information, sustainable forest operations
1. Introduction
Fuel consumption is a critical parameter in any mechanised forest operation as it is required for proper economic and environmental evaluations. For example, fuel can cause around 10–20% of the direct harvesting costs (Nordfjell et al. 2003), and at the same time, is a fundamental parameter to estimate GHG emissions derived from forest operations (González-García et al. 2014). However, the precise estimation of fuel consumption has been a challenge for decades. In some cases, fuel consumption was retrieved through indirect methods, such as questionnaires to machine owners, operators and forest companies, limiting the potential for accurate modelling and the analysis of specific variables on fuel consumption. Athanassiadis et al. (1999) used machine data from contractors and forest companies to determine the fuel consumption and Nordfjell et al. (2003) included both questionnaires and accounting data to assess fuel consumption. Other approaches were based on the number of fuel tank refills (Klvac and Skoupy 2009, Borz et al. 2021), using carbon balance methods (Lijewski et al. 2017) or differences in tank levels before and after working shifts (Gagliardi et al. 2020).
The use of data loggers connected to the data bus of the machines has greatly expanded the potential for better models and studies related to fuel consumption, as it allows cost-effective and fully automatic estimates of fuel consumption along specific intervals of time. As in Northern Europe, forwarders account for nearly half of the total fuel consumed from felling to roadside (Athanassiadis et al. 1999), this approach has been used for several studies involving fuel consumption by cut-to-length (CTL) machines; they have been the focus of many fuel consumption studies in Sweden (Manner et al. 2016a, 2016b, 2019) and Finland (Suvinen 2006, Prinz et al. 2018, Prinz et al. 2020, Melander and Ritala 2020).
Traditionally, fuel consumption of forwarders has been related to the load (Manner et al. 2016a), time (Manner et al. 2016b), driving speed (Berg et al. 2019), and distance travelled (Berg et al. 2019, Manner et al. 2016a, 2016b). However, there are additional parameters related to soil conditions and specific machine adaptations that, despite playing an important role in fuel efficiency, have been largely neglected or studied indirectly. As an example of indirect studies, Nordfjell et al. (2003) included the effect of ground conditions using a qualitative scale based on Berg (1992), characterizing overall levels of ground strength, roughness and inclination.
A deeper study on the effect of ground conditions is particularly relevant when forest operations take place in challenging soil conditions, as on wet and sensitive sites in Eastern Europe, where soil strength is one of the critical issues in management of forest operations (Mederski et al. 2021) and in peatlands in Northern Europe, due to the limitations given by the thickness of the top layer and the moisture content of the peatland. In these conditions, the adaptations of forwarders may include different equipment, such as a 10-wheeled forwarder with an add-on axle (Fjeld and Østby-Berntsen 2020, Ala-Ilomäki et al. 2011), the use of rubber tracked bogie-axles and supportive rollers to reduce soil impact on sensitive sites (Engler et al. 2020), the rubber-tracked OnTrack forwarder concept (Björheden 2018), the HSM 10-wheel triple-bogie setup (Starke et al. 2020) and other novel forwarder concepts (Gelin and Björheden 2020).
The overall soil conditions and the effects of these adaptations to operate on peatland may have strong effects on fuel consumption. Brunberg (2013) reported an increase in fuel consumption of CTL machines in Sweden over the years, mainly attributed to increasing power, but also changing climatic conditions and the use of tracks. Suvinen (2006) showed that wheel chains and bogie tracks increased fuel consumption under simulated terrain conditions.
The aim of this study is to analyse fuel consumption of individual wheeled CTL forwarder set-ups with different types of bogie tracks on peatlands, using automatic recording of data bus information. Two types of forwarders, 8-wheeled and 10-wheeled forwarders, in different conditions were included in the analysis, and several variables were tested in constructing a model for fuel consumption as a function of the trail conditions and set-up. The results of the study have direct application in forest operations planning, and possible economic and environmental consequences are further discussed.
2. Materials and Methods
2.1 Study Conditions and Stand Properties
The stand where the trials took place was characterised by a pine-dominated mixed forest on drained peatland with a flat terrain profile; each trail was characterised through stand data separated between species and commonly used stand parameters (Table 1). The stands were comparable in their main characteristics; the specifications of the stand were described making a distinction between straight and curved trail types.
Table 1 Stand characteristics where the experiments took place. There were N=33 plots included, for three machines, each performing on both straight and curved trails
|
Machine, trail type |
Volumetric share of species, % |
Mean diameter, cm |
Mean height, m |
Basal area, m2 ha-1 |
Number of stems per hectare |
Volume, m3 ha-1 |
Average peat moisture content % |
Average peatland surface shear modulus, kPa |
||
|
Scots pine Pinus sylvestris L. |
Norway spruce Picea abies [L.] Karst. |
Silver birch Betula pendula Roth. |
||||||||
|
Elk LWB Magnum, Straight |
96.8 |
2.7 |
0.5 |
12.3 |
11.6 |
26.5 |
1813 |
199.9 |
85.0 |
205 |
|
Elk LWB Magnum, Curved |
98.0 |
1.4 |
0.6 |
14.5 |
13.5 |
26.2 |
1394 |
204.1 |
86.9 |
51 |
|
Buffalo KOPA, Straight |
99.5 |
0.4 |
0.1 |
15.8 |
13.8 |
27.8 |
1188 |
227.5 |
84.7 |
52 |
|
Buffalo KOPA, Curved |
96.7 |
3.1 |
0.2 |
15.7 |
13.6 |
24.3 |
1076 |
192.7 |
86.5 |
44 |
|
Elk 10W Mixed, Straight |
99.6 |
0.0 |
0.4 |
15.5 |
14.2 |
19.3 |
938 |
145.6 |
87.1 |
48 |
|
Elk 10W Mixed, Curved |
95.2 |
1.1 |
3.8 |
7.0 |
7.2 |
16.0 |
2311 |
112.4 |
89.7 |
56 |
2.2 Study Design
The field experiment was conducted during June 25th and 26th, 2019 near Rautavaara, Eastern Finland (63°22'N, 28°35’E in WGS84). Three cut-to-length (CTL) forwarders, each using specific bogie track designs, were used on specifically designed test trails on a pine-dominated drained peatland (Fig. 1). Each forwarder had a different bogie track design:
Þ an 8-wheeled Ponsse Elk with long wheelbase (LWB) rear bogie, equipped with Olofsfors Baltic (front) and Magnum (rear) tracks (called Elk LWB later in text and graphs)
Þ an 8-wheeled Ponsse Buffalo, equipped with KOPA Flotation Tracks (Kopa)
Þ a 10-wheeled Ponsse Elk, equipped with Olofsfors Eco Soft (front) and Max-Magnum (rear) tracks (Elk 10W) (Table 2).
Table 2 Specifications of the studied machine units (abbreviations used: Elk LWB, Kopa and Elk 10W)
|
Year of manufacture |
Engine power |
Bogie wheelbase |
Track width |
Weight in test, incl. load and tracks |
|||||
|
Front |
Rear |
Front |
Rear |
Front |
Rear |
Total |
|||
|
kW |
mm |
mm |
kg |
||||||
|
Elk LWB Magnum |
2017 |
150 |
1500 |
1890 |
790 |
930 |
13,449 |
15,551 |
29,000 |
|
Buffalo KOPA |
2016 |
210 |
1500 |
1500 |
900 |
900 |
15,396 |
16,204 |
31,600 |
|
Elk 10W Mixed |
2017 |
150 |
1500 |
2910 |
900 |
910 |
13,140 |
17,560 |
30,700 |
Before the experiment, the test trails were harvested from a distance where it was ensured that the soil in test areas remained intact and free of cutting residues. Straight and curved test trails were designed for each forwarder combination and allowed a smooth travel free of obstacles between the test trails. The tests trails for straight driving were 20 m long and 4 m wide, curved trails had a curve design with a 20 m radius and a turn of 90 degrees with a subsequent calculated length of 31.4 m and width of 4 m. The study focused entirely on the working element of loaded driving with a fixed load. Machines accelerated some distance before the beginning of each test area and continued driving without stopping or slowing down throughout the test area. All machines were equipped with on-board global navigation satellite systems (GNSS) supporting Global Positioning System (GPS) and Global Navigation Satellite System (GLONASS) for defining the machines specific locations. The number of passes for each machine unit and trail type were used as indicators of the driving intensity; each machine passed the trails three consecutive times, only for the Ponsse Elk 10W Mixed an intermediate pass (second pass) remained unrecorded and was replaced with an additional fourth pass instead. The load of tested machines was kept constant during the entire experiment, forwarders were driven loaded with pulpwood with a load weight of approximately 5100 kg and an average length of 4.56 m.
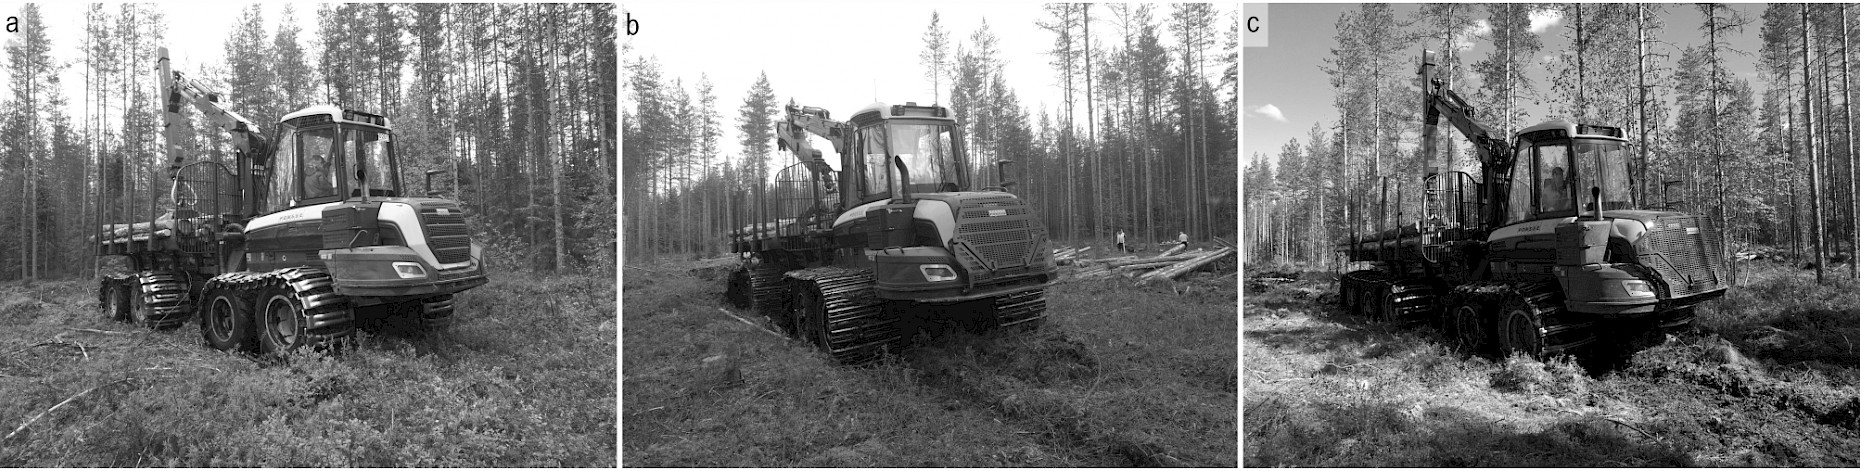
Fig. 1 Field study of CTL forwarders with different wheel configuration and bogie design under experimental conditions on peatland; the trial included three machine units: a Ponsse Elk LWB Magnum (a), a Ponsse Buffalo KOPA (b) and a Ponsse Elk 10W Mixed (c). Source: Luke/JariAla-Ilomäki
The study conditions of the experiment were measured on each stand on the trails prior to cutting. On the straight trails 5 m by 8 m plots were established; and an 8 m wide zone on the curved trails. Measurements included the tree species, the diameter at breast height (DBH) measured by cross-measurement of the DBH and the tree height using the laser-based hypsometer Nikon Forestry Pro II for every third tree.
Concerning soil, peat moisture was determined for three different locations within each test area using a steel box-type 60 mm by 60 mm peat sampler (Pitkänen et al. 2011). The peat samples were taken from the top of the composed peat layer beneath the living moss layer to a depth of 100 mm and had an average wet weight of 434.1 g (SD 49.6). The determination of rut depth was based on the methodology and results presented by Ala-Ilomäki (2013): the variation between the test trail strengths was measured on each plot area with a spiked shear vane. Rut depths and soil bearing capacity were taken for each plot, all together 4 plots on each straight trail and 7 plots for each curved trail.
The fuel consumption measurements were based on automatic data recording via the machines data bus channel. Each studied machine was equipped with a datalogger collecting key performance parameters at 20 ms intervals resulting in a total of N=27,928 observations (for a total of 99 plots analysed, distributed as 7381 for Kopa, 11,539 for Elk LWB and 9008 for the Elk 10W). The machines individual locations using their on-board GNSS were used to define the start and end points in the data recording. The observations were divided in sections of equal length within each trail pass according to the ground strength measurements: 4 sections on each straight trail and 7 sections for each curved trail. The travelled distances were based on the designed trail lengths. Fuel consumption was automatically recorded based on the instant fuel consumption provided by the machine on-board system for each 20 ms interval.
2.3 Data Analysis
Fuel consumption was analysed by integrating all potential variables into a single model. A set of predictors were first considered and systematically analysed as a single factor, in combination or with interactions in a normal regression model. Each machine was expected to present a different performance on fuel consumption; the model included dummy variables for each machine in order to include the potential effects, following the general structure
 (1)
(1)
Where:
F is fuel consumption of machine i in plot j
X represents variables to be included
μi represents between-machine variability
ε represents residual variance, with mean = 0 and std. dev being σm and σε, respectively.
Coefficients β1-k represent parameters to be estimated. In these cases, the pool of variables considered included: G, the shear modulus (kPa) measured in the plot j operated by machine i; pass, a dummy variable representing the number of passes of machine i in plot j, being = 1 for the measurements of that machine at that pass, and 0 otherwise, for a total of four passes; curve, a dummy variable representing whether it is a curve or straight segment. The predictors were included systematically one at time, allowing interactions with each other. The variables included in the model had to be significant at the 0.05 level, and had to contribute to the prediction power of the model avoiding excessive complexity.
3. Results
3.1 Studied Machine Designs
The results from the data bus observations of the machines showed increasing speeds with the number of passes, and also faster speeds in the curves (Fig. 2). Despite the common set-up in all the trails, the machines showed different performance parameters, particularly in the case of the Elk LWB. There were, however, divergences concerning the speed data bus observations and the ground measurements based on GNSS measurements: the average speed for each machine was 0.87, 1.07 and 0.67 m/s from the data bus observations, and 0.99, 1.00 and 0.76 using ground/GNSS measurements, for Elk 10W, Kopa and Elk LWP. The relative speeds of the machines did not change, and the same consistent trends were observed in both passes and types of trails irrespective of the sources of the records. Concerning engine speeds (rpm), they increased with the number of passes, and also in this case there were differences between machines, with Kopa showing the lowest and most consistent engine speed of the three.
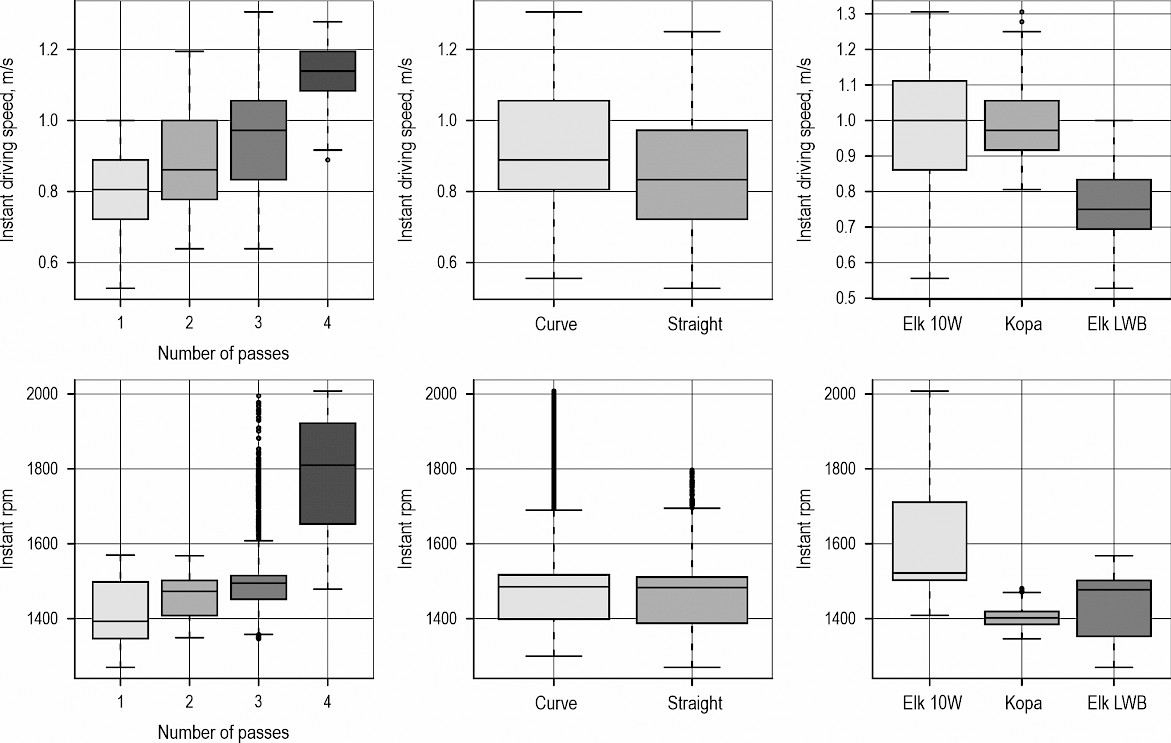
Fig. 2 Machine data bus recorded engine speed (instant rpm) and speed (m/s) concerning number of passes, type of trail (curved or straight) and machine. Observations are based on each machine automatic data records (N=27,928). The fourth pass only included data from Elk 10W, and the second pass only included data from Kopa and Elk LWB
The fuel consumption per plot showed different profiles, particularly by machine and pass. Elk LWB showed the lowest fuel consumption rates but was also the slowest forwarder (Fig. 3). The automatic records of speed at each plot showed great variability for Elk 10W and, to a lesser extent, Kopa, possibly due to wheel slippage. Elk 10W speed values within each plot ranged from 0.6 to 1.3 m/s. The engine speeds (rpm) were rather constant in the case of Kopa, and showed large changes between plots and within the same plot in the case of Elk 10W. In general, the speed and fuel consumption increased with the number of passes, irrespectively of whether on a straight or curved section of the trail.
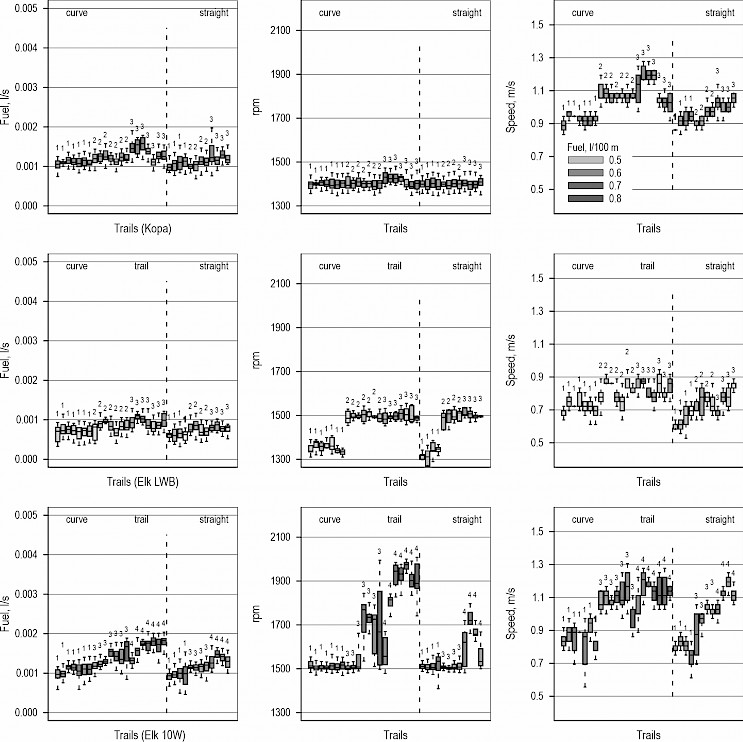
Fig. 3 Machine recorded instant fuel consumption (l/s), engine speed (rpm) and speed (m/s) for each studied plot (N=99). Numbers refer to the pass number of that plot within each type of trail (curved or straight). Observations are based on each machine automatic data records (N=27,928). The fourth pass only included data from Elk 10W (bottom), and the second pass only included data from Kopa (top) and Elk LWB (middle)
The results of the first analysis of raw data shows a clear increment of fuel consumption with increasing driving intensity (increased number of passes). There were important differences between the studied machines affecting the average fuel consumption per plot (Fig. 4). The results show a higher fuel consumption for the Elk 10W compared to the other machine units, although it must be taken into account that this machine made a fourth pass in the trails, which precludes direct comparison of non-modelled data. The results also indicated a slight tendency for an increase in distance-based fuel consumption for curved trails, except in the case of the Buffalo Kopa forwarder.
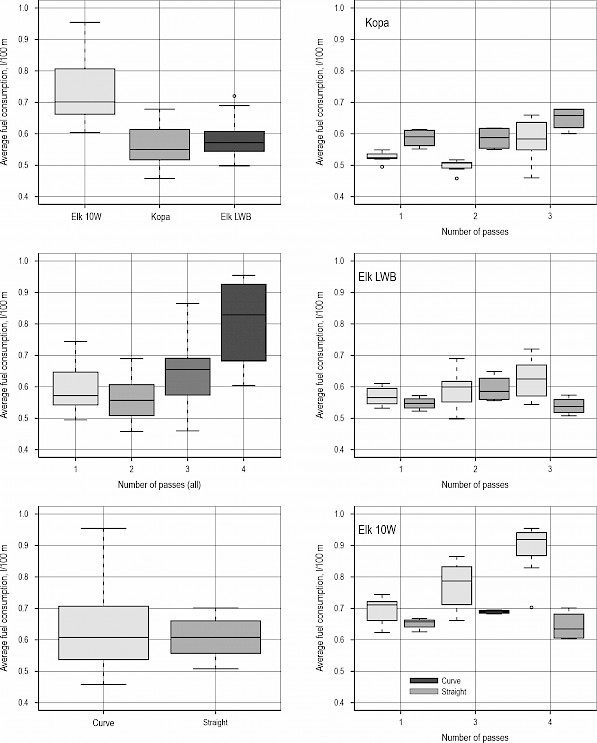
Fig. 4 Recorded fuel consumption based on ground/GNSS observations for each number of passes separated between straight and curved trails for the three studied machine designs: the Elk LWB Magnum (top), Buffalo KOPA (middle) and Elk 10W Mixed (bottom). The boxes represent the data between the upper and lower quartile, and the thick lines, the median values. Error bars entail 95% of the values. The fourth pass only included data from Elk 10W, and the second pass only included data from Kopa and Elk LWB
3.2 Modelled Fuel Consumption
The modelled fuel consumption showed a significant effect of speed, number of passes and type of trail segment (Table 3). Fuel consumption was higher in curves and after several passes (Fig. 5), and was higher for slow speeds, within the range of data available. All variables were significant at the 0.001 level, and the estimated between-machine standard deviation was 0.146 for a residual standard deviation of the error 0.053.
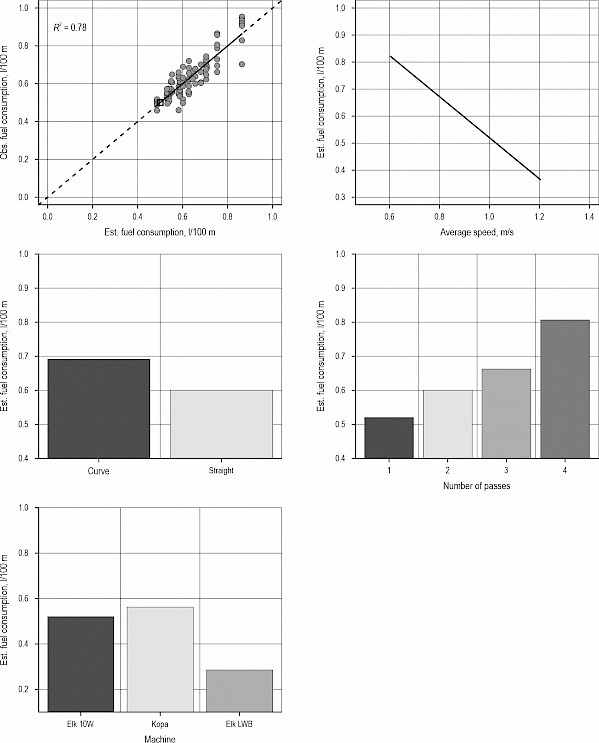
Fig. 5 Modelled fuel consumption (l/100m driving) as a function of speed, number of passes and type of trail segment (curve or straight). RMSE=0.05 (7.97%). The marginal effects concerning the machines (Elk LWB Magnum, Buffalo KOPA and Elk 10W Mixed) assumes straight segments during the first pass and the median speed from the field measurements
An alternative version of the model was constructed, removing the between-machine random factor, and including each machine as a dummy variable in the fixed part. This alternative confirmed significant differences between the machine performance: LWB had a significantly lower consumption for the same type of trail and pass. The model had a coefficient of determination of R2=0.78, for a RMSE=0.05 l/100 m (7.97%). Other variables considered, such as rut depth, depth of the peat, soil bearing capacity, or interactions between these variables, did not show a significant effect on the fuel consumption when included in the model. The analysis of the residuals did not show a clear trend or systematic bias in the case of speed, or indication of a nonlinear relationship, when the machine effect was included.
Table 3 Parameter values of the model for fuel consumption (l/100 m driving) as a function of speed, number of passes and type of the trail segment (curve or straight). R2=0.78. SE: Standard error. Machine-effects added as dummy variables
|
Variable |
Value |
SE |
p-value |
|
β0 |
1.291 |
0.074 |
<0.001 |
|
β1, speed, m/s |
–0.760 |
0.092 |
<0.001 |
|
β2, curve |
0.091 |
0.013 |
<0.001 |
|
β3, 2nd pass |
0.080 |
0.018 |
<0.001 |
|
β4, 3rd pass |
0.142 |
0.017 |
<0.001 |
|
β5, 4th pass |
0.287 |
0.029 |
<0.001 |
|
β6, Kopa |
0.042 |
0.027 |
0.123 |
|
β6, Elk LWB |
–0.234 |
0.021 |
<0.001 |
4. Discussion
Despite the fact that peatlands are environmentally sensitive areas where forest operations are increasingly taking place, only a few studies have focused on the overall performance of forest operations in these types of forests. The present study analyses the consumption of fuel and the potential effects of soil and trail features of different forwarders adapted to peatland conditions. The trials were performed under real working conditions on peatlands, although the field study can be regarded as an experimental set-up with fixed and controlled factors. The driving distance and therefore the time period of the machines operation within the respective trial area were fixed.
The combination of machine performance and forest attributes is an ongoing research field, towards the full development of the concept of precision forestry (Melander et al. 2019). The results of this study contribute to this general research line, in agreement with previous research on forwarders performance. Nordfjell et al. (2003) reported a forwarder fuel consumption in the working phase of driving of 0.23–0.38 l/100 m driving, depending on the operational conditions. Manner et al. (2016b) showed a correlation between fuel consumption, time consumption and total driven distance and presented median total fuel consumption figures of 8.5 l per load or 1.24 l/100 m. The study of Lijewski et al. (2017), with an average extraction distance of 400 m and an average speed of the forwarder of 1.94 m/s, estimated that 27% of the fuel consumption was generated by transport, while the working element of driving only accounted for half of the fuel consumption in the study of Manner et al. (2016b), at a median driven distance of 670 m per load. Abbas et al. (2018) discussed perspectives on forest operations in similar environmentally sensitive areas and stated that soil impacts are directly proportional to both machine weight and number of passes, in agreement with the main results of the study.
However, there is not a single factor that fully explains fuel consumption in forest operations, and the results reflect the complex relationships between the variables and the fuel consumption of the forwarders. Among those, the observed speed was of particular interest. The average driving speed of the forwarders analysed was around 0.90 m/s (SD 0.16, 3.22 km/h), which was higher than previous studies (Berg et al. 2019), which can be related to relatively low load size and the distance set in the study. The load size was decided by the operator at the beginning of the trial, based on the likelihood to be able to conduct several passes with a given load weight on the trial tracks under the given conditions. Berg et al. (2019) demonstrated a relationship between driving speed and driving distance as possible factors affecting forwarder work; short distances (under 25 m) resulted in a driving loaded speed of 0.56 m/s, whereas longer ones (25 to 50 m) increased the averages to 0.70 m/s.
In addition, Borz et al. (2021) recently showed that operation speed of a forwarder varies with the skidding road conditions. In this sense, whereas speed has a direct effect on the machine fuel consumption, based on mechanical efficiency, it can also be a proxy related to other factors, such as machine-soil interaction. While operators were instructed to drive each trail with constant speed whenever possible, the results show that speed varied also as a function of the trail conditions. It has been shown that rut depth increases with the number of passes, but also that the first few machine passes are crucial (e.g. Janssonand Johansson 1998). Furthermore, a lower bearing capacity of the ground due to climate change and fewer frozen periods of the ground can increase wheel slippage of forwarders, which consumes energy in form of wheel ruts in the ground with the consequence of an increased fuel consumption (Ringdahl et al. 2012).
Wheel slippage may be related to the disagreements between the two sources of speed observations (i.e. the ground data distance and time measurements and the sensor data on the machine wheels). In general, the speed observations measured on ground were based on direct observations with an estimated low error. The accuracy of the machine positioning was done by using GNSS signal, with a number of satellites between 17 and 22 with horizontal dilution of position (HDOP) values between 0.51 and 0.66, resulting in a high precision. The use of the on-board GNSS was therefore considered suitable for defining the data recording starting and ending points when driving through the test area. On the other hand, the sensor recorded speed is based on the turning of wheels, which may be affected by wheel slip. Melander and Ritala (2018) found Kinect and GNSS based speed measurements to be lower than CAN-bus based measurements, indicating slippage. In fact, it is consistent with studies on wheel slippage of forwarders, such as by Ringdahl et al. (2012), who estimated it to be around 10 to 15% in forest environments and Schönauer et al. (2020) who reported a wheel slip of 5.3±10.9% on flat terrain without traction-assist technology. On peatland, these effects can be higher, as wheel slip might increase rapidly with an increase of the forces resisting vehicle motion (Saarilahti and Ala‐Ilomäki 1997). Wheel slip could also explain the disagreements between sensor based and ground data to be increasing with the number of passes, and to be larger on curves.
In addition, despite trails being selected as similar as possible to prevent machine-trail correlations, it was inevitable to present singular characteristics (e.g. a particularly high average peatland surface shear modulus in one of the trails) with few replications. The need to integrate the interactions between soil, trail segments and speed on the resulting fuel consumption justified the use of modelling approaches specifically addressing the effects of each forwarder, and the imbalances in the data collection (i.e. unequal numbers of passes per machine). The use of a mixed model approach, grouping the data by machine and first applying it to each individual variable defining the trails and then combining these variables into a single model, helped address these limitations. The results of the model highlighted the differences between machines performance, showed a good predictive power and the overall estimated effects of the variables were logical. Fuel consumption increased with the number of passes, which is linked to the soil-machine interactions, decreased with driving speed and was higher for curved trails compared to driving on straight trails. Other variables were considered, but did not show statistical significance, possibly because their effects were confounded by the variables already included. For example, the soil strength, describing the soil conditions indicated by the share-modulus, has an effect on rut depth (see Ala-Ilomäki 2013). It was thus expected that lower soil bearing capacities would lead to increased rutting effects causing a higher fuel consumption. This assumption was in line with Pandur et al. (2019) who compared fuel consumption of two forwarders with the results indicating higher fuel consumption of the smaller Valmet 840.2 forwarder due to lower soil bearing capacity and longer extraction distances. However, the analysis showed that rut depth did not have a significant effect on the fuel consumption, which can be explained by the fact that it is also related to the number of passes (Ala-Ilomäki et al. 2021), and therefore indirectly included in that variable. Furthermore, the number of trails was limited and trails were rather similar in their soil characteristics, which did not allow further investigation regarding soil-fuel relations. Finally, there were other possible factors that could explain differences in fuel consumption, but their effect seemed to be smaller or could be ruled out; for example, the machines cooling fan could have had an effect, but an ad hoc examination indicated that they were not running during operations.
Despite the good model results, a generalisation of the results is restricted due to the limited dataset and conditions being investigated, as well as the lack of actual direct fuel measurements. The connection between driving speed and fuel consumption showed a complex relationship resulting in different profiles when split into a plot level, particularly by machine and pass, compared to the aggregated trail sections. On one hand, the fuel consumption per distance seemed to decrease with increasing speed, but at the same time, speed increased with the number of passes, probably due to the compaction of soil. Thus, there are important confounding effects between these variables, suggesting that the effects of speed and soil on fuel consumption deserves further investigation. The proposed model reflects the situation as observed under the given operational environment during the conducted experiment with all its study limitations and assumptions and it cannot be directly applied for predictions with the assumption that faster speed will necessarily result in lower fuel consumptions, since there are further interactions that need to be assessed. Despite these cautions, the presented study set-up allowed an in-depth analysis of the respective fuel consumptions depending on the driving intensity of the studied machine designs and their respective equipment. The results contribute to the knowledge base towards a sustainable forest operation where negative environmental impacts are minimised (Marchi et al. 2018). This research gives important detailed fuel consumption information on micro-level which is also useful for future studies, for example when considering route optimisation and related modelling or eventually for life cycle analyses. Such detailed information enables the quantification of relationships and factors of the (fuel) efficiency of forest machines caused by changes in the operational working environment. Although a certain margin of error remains within the given results, the study is able to provide support in decision making, e.g. by giving relationships to observed changes in fuel consumption of differently equipped machines, and in general connections between operational environment factors causing efficiency losses of forest operations. Finally, the results may also provide additional understanding for logging entrepreneurs as it was reported by Haavikko et al. (2019) that there is a need for energy efficiency education and advanced working methods among Finnish logging entrepreneurs. Furthermore, the study presented a possible method and indication of fuel consumption results for future studies in this field.
5. Conclusions
The study of machines performance concerning fuel consumption is a critical issue in forest operations, with evident environmental and economic implications. The results showed the effect of soil, expressed in the number of passes that the machine performed on a trail, the segment type, the machine speed on the fuel consumption, producing a valid model for further applications. The soil bearing capacity did not directly affect the fuel consumption, although this may have been confounded by other variables. The study also addressed the important differences between the machines performance due to their own characteristics. By contributing to the knowledge on the connection between soil conditions and fuel consumption, the study can contribute to the aim towards more sustainable forest operations by minimising negative environmental impacts and providing the necessary tools for further research efforts.
Acknowledgements
The authors gratefully acknowledge Simo Tauriainen (Ponsse Plc), Jouni Puoskari (Motoajo Ltd), Kalle Pitkänen (Koneteko Pitkänen Ltd) and Marko Lappeteläinen.
This work was supported by the Bio Based Industries Joint Undertaking under the European Union’s Horizon 2020 research and innovation program, TECH4EFFECT – Techniques and Technologies for Effective Wood Procurement – project [grant number 720757]. Co-funding of the Academy of Finland’s Flagship Programme project UNITE – Forest-Human-Machine Interplay – Building Resilience, Redefining Value Networks and Enabling Meaningful Experiences [grant numbers 337655 and 337127] and the project SecureLog – Data fusions securing feedstock supply to bioeconomy – funded by the Natural Resources Institute Finland (Luke) are gratefully acknowledged.
6. References
Abbas, D., Di Fulvio, F., Spinelli, R., 2018: European and United States Perspectives on Forest Operations in Environmentally Sensitive Areas. Scand J For Res 33(2): 188–201. https://doi.org/10.1080/02827581.2017.1338355
Ala-Ilomäki, J., Högnäs, T., Lamminen, S., Sirén, M., 2011: Equipping a Conventional Wheeled Forwarder for Peatland Operations. Int J For Eng 22(1): 7–13. https://doi.org/10.1080/14942119.2011.10702599
Ala-Ilomäki, J., 2013: Spiked shear vane – a new tool for measuringpeatland top layer strength. Suo 64(2–3): 113–118.
Ala-Ilomäki, J., Lindeman, H., Mola-Yudego, B., Prinz, R., Väätäinen, K., Talbot, B., Routa, J., 2021: The effect of bogie track and forwarder design on rut formation in a peatland. Int J For Eng 32(1): 12–19. https://doi.org/10.1080/14942119.2021.1935167
Athanassiadis, D., Lidestav, G., Wästerlund, I., 1999: Fuel, Hydraulic Oil and Lubricant Consumption in Swedish Mechanized Harvesting Operations, 1996. Journal of Forest Engineering 10(1): 59–66.
Berg, S., 1992: Terrain Classification System for forestry work. Forestry Research Institute of Sweden, Uppsala, Sweden.
Berg, S., Ersson, B.T., Manner, J., 2019: Distance driven and driving speed when forwarding during final felling in Central Sweden. J. For. Sci. 65(5): 183–194. https://doi.org/10.17221/23/2019-JFS
Björheden, R., 2018: Rutting and vibration levels ofthe On Track concept forwarderon standardised test tracks. Skogforsk Arbetsrapport 989–2018, 1–28.
Borz, S.A., Marcu, M.V., Cataldo, M.F., 2021: Evaluation of an HSM 208F 14tone HVT-R2 Forwarder Prototype under Conditions of Steep-Terrain Low-Access Forests. Croat. j. for. eng. 42(2): 185–200. https://doi.org/10.5552/crojfe.2021.775
Brunberg, T., 2013: Bränsleförbrukningen hos skogsmaskiner 2012 (Fuel consumption in forest machines 2012). Arbetsrapport Från Skogforsk Nr. 789, 18 p.
Engler, B., Hoffmann, S., Zscheile, M., 2020: Rubber tracked bogie-axles with supportive rollers – a new undercarriage concept for log extraction on sensitive soils. Int J For Eng 32(1): 43–56. https://doi.org/10.1080/14942119.2021.1834814
Fjeld, D., Østby-Berntsen, Ø., 2020: The effects of an auxiliary axle on forwarder rut development – a Norwegian field study. Int J For Eng 31(3): 192–196. https://doi.org/10.1080/14942119.2020.1765645
Gagliardi, K., Ackerman, S., Ackerman, P., 2020: Multi-Product Forwarder-Based Timber Extraction: Time Consumption and Productivity Analysis of Two Forwarder Models Over Multiple Products and Extraction Distances. Croat. j. for. eng. 41(2): 231–242. https://doi.org/10.5552/crojfe.2020.736
González-García, S., Moreira, M.T., Dias, A.C., Mola-Yudego, B., 2014: Cradle-to-gate Life Cycle Assessment of forest operations in Europe: environmental and energy profiles. Journal of Cleaner Production 66: 188–198. https://doi.org/10.1016/j.jclepro.2013.11.067
Gelin, O., Björheden, R., 2020: Concept evaluations of three novel forwarders for gentler forest operations. Journal of Terramechanics 90: 49–57. https://doi.org/10.1016/j.jterra.2020.04.002
Haavikko, H., Kärhä, K., Hourula, M., Palander, T., 2019: Attitudes of Small and Medium-Sized Enterprises towards Energy Efficiency in Wood Procurement: A Case Study of Stora Enso in Finland. Croat. j. for. eng. 40(1): 107–123.
Jansson, K.J., Johansson, J., 1998: Soil changes after traffic with a tracked and a wheeled forest machine: a case study on a silt loam in Sweden. Forestry 71(1): 57–66. https://doi.org/10.1093/forestry/71.1.57
Klvac, R., Skoupy, A., 2009: Characteristic fuel consumption and exhaust emissions in fully mechanized logging operations. Journal of Forest Research 14(6): 328–334. https://doi.org/10.1007/s10310-009-0143-7
Lijewski, P., Merkisz, J., Fuć, P., Ziółkowski, A., Rymaniak, L., Kusiak, W., 2017: Fuel consumption and exhaust emissions in the process of mechanized timber extraction and transport. Eur J Forest Res 136(1): 153–160. https://doi.org/10.1007/s10342-016-1015-2
Manner, J., Palmroth, L., Nordfjell, T., Lindroos, O., 2016a: Load level forwarding work element analysis based on automatic follow-up data. Silva Fennica 50(3): 1546. http://dx.doi.org/10.14214/sf.1546
Manner, J., Nordfjell, T., Lindroos, O., 2016b: Automatic load level follow-up of forwarders' fuel and time consumption. Int J For Eng 27(3): 151–160. https://doi.org/10.1080/14942119.2016.1231484
Manner, J., Berg, S., Ersson, B.T., 2020: Forwarding during final felling: work element-specific distributions of driving distances at the stand level. Int J For Eng 31(1): 51–69. https://doi.org/10.1080/14942119.2019.1657058
Marchi, E., Chung, W., Visser, R., Abbas, D., Nordfjell, T., Mederski, P.S., McEwan, A., Brink, M., Laschi, A., 2018: Sustainable Forest Operations (SFO): A new paradigm in a changing world and climate. Science of The Total Environment 634: 1385–1397. https://doi.org/10.1016/j.scitotenv.2018.04.084
Mederski, P.S., Borz, S.A., Đuka, A., Lazdiņš, A., 2021: Challenges in Forestry and Forest Engineering – Case Studies from Four Countries in East Europe. Croat. j. for. eng. 42(1): 117–134. https://doi.org/10.5552/crojfe.2021.838
Melander, L., Ritala, R., 2018: Time-of-flight imaging for assessing soil deformations and improving forestry vehicle tracking accuracy. Int J For Eng 29(2): 63–73. https://doi.org/10.1080/14942119.2018.1421341
Melander, L., Einola, K., Ritala, R., 2019: Fusion of open forest data and machine fieldbus data for performance analysis of forest machines. Eur J Forest Res 139(2): 213–227. https://doi.org/10.1007/s10342-019-01237-8
Melander, L., Ritala, R., 2020: Separating the impact of work environment and machine operation on harvester performance. Eur J Forest Res 139(6): 1029–1043. https://doi.org/10.1007/s10342-020-01304-5
Nordfjell, T., Athanassiadis, D., Talbot, B., 2003: Fuel consumption in forwarders. Int J For Eng 14(2): 11–20. https://doi.org/10.1080/14942119.2003.10702474
Pandur, Z., Šušnjar, M., Bačić, M., Đuka, A., Lepoglavec, K., Nevečerel, H., 2019: Fuel consumption comparison of two forwarders in lowland forests of pedunculate oak. iForest 12(1): 125–131. https://doi.org/10.3832/ifor2872-011
Pitkänen, A., Turunen, J., Simola, H., 2011: Comparison of different types of peat corers in volumetric sampling (Erityyppisten turvekairojen vertailu tilavuustarkkojen näytteiden otossa). Suo 62(2): 51–57.
Prinz, R., Väätäinen, K., Routa, J., 2020: Cutting duration and performance parameters of a harvester’s sawing unit under real working conditions. Eur J Forest Res 140(1): 147–157. https://doi.org/10.1007/s10342-020-01320-5
Prinz, R., Spinelli, R., Magagnotti, N., Routa, J., Asikainen, A., 2018: Modifying the settings of CTL timber harvesting machines to reduce fuel consumption and CO2 emissions. Journal of Cleaner Production 197(1): 208–217. https://doi.org/10.1016/j.jclepro.2018.06.210
Ringdahl, O., Hellström, T., Wästerlund, I., Lindroos, O., 2012: Estimating wheel slip for a forest machine using RTK-DGPS. Journal of Terramechanics 49(5): 271–279. https://doi.org/10.1016/j.jterra.2012.08.003
Saarilahti, M., Ala‐Ilomäki, J., 1997: Measurement and modelling of wheelslip in forwarding on moraine forest floor. Scand J For Res 12(3): 316–319. https://doi.org/10.1080/02827589709355416
Schönauer, M., Holzfeind, T., Hoffmann, S., Holzleitner, F., Hinte, B., Jaeger, D., 2020: Effect of a traction-assist winch on wheel slippage and machine induced soil disturbance in flat terrain. Int J For Eng 32(1): 1–11. https://doi.org/10.1080/14942119.2021.1832816
Starke, M., Derron, C., Heubaum, F., Ziesak, M., 2020: Rut Depth Evaluation of a Triple-Bogie System for Forwarders—Field Trials with TLS Data Support. Sustainability 12(16): 6412. https://doi.org/10.3390/su12166412
Suvinen, A., 2006: Economic comparison of the use of tyres, wheel chains and bogie tracks for timber extraction. Croat. j. for. eng. 27(2): 81–102.
© 2022 by the authors. Submitted for possible open access publication under the
terms and conditions of the Creative Commons Attribution (CC BY) license (http://creativecommons.org/licenses/by/4.0/).
Authors’ addresses:
Robert Prinz, PhD *
e-mail: robert.prinz@luke.fi
Kari Väätäinen, PhD
e-mail: kari.vaatainen@luke.fi
Assoc. prof. Johanna Routa, PhD
e-mail: johanna.routa@luke.fi
Natural Resources Institute Finland (Luke)
Yliopistokatu 6 B
80100 Joensuu
FINLAND
Assoc. prof. Blas Mola-Yudego, PhD
e-mail: blas.mola@uef.fi
University of Eastern Finland
School of Forest Sciences
P.O. Box 111
FI-80101 Joensuu
FINLAND
Assoc. prof. Jari Ala-Ilomäki, PhD
e-mail: jari.ala-ilomaki@luke.fi
Natural Resources Institute Finland (Luke)
Latokartanonkaari 9
00790 Helsinki
FINLAND
Harri Lindeman, MSc
e-mail: harri.lindeman@luke.fi
Natural Resources Institute Finland (Luke)
Korkeakoulunkatu 7
33720 Tampere
FINLAND
Assoc. prof. Bruce Talbot, PhD
e-mail: bruce@sun.ac.za
Stellenbosch University
Department of Forest and Wood Science
Paul Sauer Building, Bosman Street
7600 Stellenbosch, Western Cape
SOUTH AFRICA
* Corresponding author
Received: June 14, 2021
Accepted: April 28, 2022