Use of UAV Data and HEC-RAS Model for Dimensioning of Hydraulic Structures on Forest Roads
doi: 10.5552/crojfe.2023.1701
volume: 44, issue:
pp: 20
- Author(s):
-
- Açıl Ahmet
- Aydin Abdurrahim
- Eker Remzi
- Duyar Ahmet
- Article category:
- Original scientific paper
- Keywords:
- forest roads, HEC-RAS, Hydraulic structures, SCS-CN, UAV
Abstract
HTML
In terms of engineering standards, the dimensions of hydraulic structures such as culverts on forest roads should have the capability to drain the expected maximum discharge for a 50-year return period during their lifespan (i.e., 20 years). In Turkey, Talbot’s formula, as empirical method, has commonly been used in determining the required cross-sectional area (CSA) of the structures. However, in practice, forest road engineers in Turkey do not pay enough attention to their construction with required dimensions calculated by Talbot’s formula. In the present study, the Hydrological Engineering Centre – River Analysis System (HEC-RAS) model was used to evaluate the dimensions of installed structures in terms of their ability to drain maximum discharges, with the aim of determining the required dimensions for those that could not meet this requirement. To this purpose, the 6+000 km forest road No. 410 in Acısu Forest Enterprise, Gerede Forest Directorate (Bolu, Turkey) was selected as the study area. In total, 15 small watersheds crossed by the forest road were delineated, with only six of them having cross-drainage structures. The HEC-RAS model geometry was generated by manual unmanned aerial vehicle (UAV) flights at altitudes of 5–15 m, providing very high spatial resolution (<1 cm). The maximum discharges of the watersheds were estimated for the HEC-RAS model using the Rational, Kürsteiner, and Soil Conservation Service-Curve Number (SCS-CN) methods. Maximum discharges of 0.18–6.03 were found for the Rational method, 0.45–4.46 for the Kürsteiner method, and 0.25–7.97 for the SCS-CN method. According to the HEC-RAS hydraulic model CSA simulations, most of the installed culvert CSAs calculated by Talbot’s formula were found to be incapable of draining maximum discharges. The study concluded that the HEC-RAS model can provide accurate and reliable results for determining the dimensions of such structures for forest roads.
Use of UAV Data and HEC-RAS Model for Dimensioning of Hydraulic Structures on Forest Roads
Ahmet Açıl, Abdurrahim Aydın, Remzi Eker, Ahmet Duyar
Abstract
In terms of engineering standards, the dimensions of hydraulic structures such as culverts on forest roads should have the capability to drain the expected maximum discharge for a 50-year return period during their lifespan (i.e., 20 years). In Turkey, Talbot’s formula, as empirical method, has commonly been used in determining the required cross-sectional area (CSA) of the structures. However, in practice, forest road engineers in Turkey do not pay enough attention to their construction with required dimensions calculated by Talbot’s formula. In the present study, the Hydrological Engineering Centre – River Analysis System (HEC-RAS) model was used to evaluate the dimensions of installed structures in terms of their ability to drain maximum discharges, with the aim of determining the required dimensions for those that could not meet this requirement. To this purpose, the 6+000 km forest road No. 410 in Acısu Forest Enterprise, Gerede Forest Directorate (Bolu, Turkey) was selected as the study area. In total, 15 small watersheds crossed by the forest road were delineated, with only six of them having cross-drainage structures. The HEC-RAS model geometry was generated by manual unmanned aerial vehicle (UAV) flights at altitudes of 5–15 m, providing very high spatial resolution (<1 cm). The maximum discharges of the watersheds were estimated for the HEC-RAS model using the Rational, Kürsteiner, and Soil Conservation Service-Curve Number (SCS-CN) methods. Maximum discharges of 0.18–6.03 were found for the Rational method, 0.45–4.46 for the Kürsteiner method, and 0.25–7.97 for the SCS-CN method. According to the HEC-RAS hydraulic model CSA simulations, most of the installed culvert CSAs calculated by Talbot’s formula were found to be incapable of draining maximum discharges. The study concluded that the HEC-RAS model can provide accurate and reliable results for determining the dimensions of such structures for forest roads.
Keywords: forest roads, HEC-RAS, Hydraulic structures, SCS-CN, UAV
1. Introduction
Forest roads, as the biggest investments in forests, are constructed to provide sustainable, safe access to forested lands for forestry applications such as logging and plantation operations, transportation of timber to mills, forest conservation, controlling fire outbreaks and pest invasion, and forest planning (Hasmadi et al. 2008). These complex engineering structures need to be properly constructed. Proper road construction and maintenance activities become especially important when forests are located in mountainous areas (Eker and Aydın 2014). Once built, roads are virtually permanent structures in the landscape, and the wrong road in the wrong place can have long-term consequences for both the society and the environment. The effects of roads on individual wildlife species and populations, local communities, and landscapes may begin during construction and continue as long as the road remains in operation or until the impacts are mitigated (van der Ree et al. 2015). Road networks are responsible for a variety of effects on the environment/natural systems in which they are constructed (Jones et al. 2000), including reduction of forest area, loss of habitats, intrusion of edge effects in natural contiguous areas, creation of new habitats, isolation of native species populations, road mortality, destruction of natural drainage, soil erosion, and river sedimentation (Kochenderfer 1977, Case and Donnelly 1979, Egan et al. 1985, Montgomery 1994, Wemple 1994, Luce 1997, Forman et al. 2003, Arıcak et al. 2010, Sorkhi et al., 2012). In addition, road construction on any hill slope will inevitably render the slope unstable and lead to an increase in landslide events (Coker and Fahey 1993, Allison et al. 2004, Eker and Aydın 2014). Landslides may result from the weight added to the slope in the embankment fill, steeper slopes on both the cut and fill surfaces, removal of the cut-slope support, and the re-routing and concentrating of road drainage water (Sidle et al. 1985).
Although the very existence of forest roads may already have negative effects on the environment, these effects are increased when they are not constructed according to appropriate engineering standards. In this case, they cannot serve for as long a time as planned since their geometry may be degraded and/or destroyed due to meteorological factors, traffic payload, maintenance applications, pavement structure, and other factors over time (Tighe et al. 2003). Water is clearly the most effective factor causing the degradation of forest roads (Scandari and Hosseini 2011). Following precipitation, the run-off water flowing over a road surface, from cut-slopes as well as from watersheds crossed by streams, plays an important role in road surface damage (Bayoğlu and Hasdemir 1991). Consequently, drainage systems are among the essential technical infrastructures in forest road construction (Rezvani 2012). Drainage systems demonstrate their importance by controlling the surface and subsurface water affecting forest roads and their surrounding areas (Öztürk 2020). However, the construction of such infrastructures (i.e., pipes, culverts, ditches, dip-drains, and bridges) in suitable locations in correctly determined type and size depending on the terrain and road conditions is crucial for the success of the road drainage systems (Schwab 1994). Inappropriate construction of road drainage infrastructures will also lead to their damage and shorten their prescribed service life, e.g., 30 to 40 years in Turkey, according to Öztürk (2020).
The key point for road engineers for minimizing the adverse impacts of roads and constructing them according to good engineering standards is to focus on the planning phase of a road project, prior to construction or upgrading because once the road construction is completed, there may be significant changes or impacts that are irreversible or difficult to mitigate (Keller and Sherar 2003). Road drainage infrastructures are designed by considering pre-determined goals of preventing soil erosion, destruction, and potential landslides in forest areas based on forest conditions such as vegetation cover, soil, topography, and hydrologic status (Mazdi et al. 2012). The drainage culvert diameter, distance between culverts, and inclination of a culvert to a road section are the most important factors in the road drainage system (Brinker 1995). The dimensions of drainage infrastructures such as culverts and bridges on forest roads are basically determined according to Talbot’s formula, in which estimation is made based on the cross-section of the drainage structure (m2), area of the catchment (km2), and coefficient »C« based on topography of the basin (Bayoğlu 1997, Menemencioğlu et al. 2013, Öztürk 2020). However, the severity of water flow or the amount of water discharge is the main criterion for determining the dimensions of culverts. In the literature, various methods (e.g., the SCS curve number method) have been used to estimate the discharge amount when designing the dimensions of cross-drainage culverts on forest roads (Mazdi et al. 2012). Recently, as a more sophisticated approach, the Hydrological Engineering Centre – River Analysis System (HEC-RAS) has been used in the planning and designing of highway drainage facilities for flood control (Maidment et al. 1998, Yalcin 2019, Damayanti et al. 2020, Üneş et al. 2020, Tektaş and Polat 2021), for evaluating the effectiveness of road-crossing drainage culverts on ephemeral streams (Conesa-García and García-Lorenzo 2013), in investigating highway drainage problems of a river bridge (Temesgen et al. 2015), in assessment of drainage structure failures along railway lines (Hirpessa and Hailu 2019), and in designing a railway bridge (Silver et al. 2011). However, few studies investigating the use of the HEC-RAS related to forest roads are found in the literature. Parsakhoo (2018) investigated flow properties of a forest channel in the cross-passage of a road via the HEC-RAS. Furthermore, Demir (2019) also used it to assess forest roads and drainage structures in terms of flood risk.
A hydraulic or hydrodynamic model is generally created using topographic data in the form of a Digital Elevation Model (DEM) (Saksena and Merwade 2015). The topographic data should represent an accurate geometric description of the river channel and its surroundings (Horritt and Bates 2002), and DEMs, as representations of channel geometry, are also important for river cross-section measurements (Vozinaki et al. 2017). In recent years, advanced remote sensing techniques have been generating high–resolution DEMs and significantly improving the accuracy of hydraulic models (Yalçın 2019). Farooq et al. (2019) assessed DEM flood model sensitivity using the HEC-RAS model with satellite-based 12 m WorldDEM, 30 m SRTM, 30 m ALOS, and 30 m ASTER DEMs. In addition, light detection and ranging (LiDAR)-based high-resolution DEMs have been used with the HEC-RAS (Stoleriu et al. 2020, Hutanu et al. 2020). Lately, unmanned aerial vehicle (UAV) photogrammetry has also been used to create very high-resolution topographic data in hydraulic models (Mourato et al. 2017, Yalçin 2019, Yavari et al. 2020). Its frequent use is mostly due to the advantages of UAV technology (Torresan et al. 2017) such as:
Þ low material and operational costs and high-intensive data collection
Þ flexibility in hosting different kinds of sensors that can be selected depending on the parameter under investigation
Þ control over timing of flights enabling the user to optimize the exact time
Þ data acquisition with very high spatial resolution.
In terms of engineering standards, the dimensions of hydraulic structures such as culverts on forest roads should have the capability to drain the expected maximum discharge for a 50-year return period during their lifespan (i.e., 20 years). In Turkey, Talbot’s formula, as an empirical method, has commonly been used to determine the required cross-sectional area (CSA) of the structures. However, in practice, forest road engineers in Turkey do not pay enough attention to their construction with required dimensions calculated by Talbot’s formula. In the present study, the HEC-RAS model was used to evaluate the dimensions of installed structures in terms of their ability to drain maximum discharges, with the aim of determining the required dimensions for those that could not meet this requirement. Also, UAV technology was used to get very high resolution geometric data required for HEC-RAS models by conducting low altitute manual flights. Therefore, both the use of HEC-RAS models in determining dimensions of hydraulic structures on forest roads and the use UAV technology in creating very high resolution geometric data for improving HEC-RAS models were presented as a novelty of this study.
2. Materials and Methods
2.1 Study Area
The study area including forest road No. 410 is located in Acısu Forest Enterprise, Gerede Forest Directorate (Bolu, Turkey). The coordinates of the area are 40° 52' 59.76" – 40° 40' 24.65" and 32° 15' 47.57" – 32° 34' 35.37" in the WGS84 coordinate system. The road was constructed as 6+000 km in 2018 (Fig. 1). According to the geographic information system (GIS)-based hydrological analysis performed in the study, in total, 15 small watersheds are crossed by the forest road. According to field observations and surveys, there were only 6 cross-drainage structures consisting of corrugated plastic pipes on the road (Fig. 1). Culvert 14 had a diameter of 65 cm, whereas the other culverts (No. 3, 6, 7, 13, and 15) had a diameter of 85 cm. Culvert 3 and Culvert 7 were 12.5 m in length, whereas the other culverts (No. 6, 13, 14, and 15) were 6.5 m in length. Additionally, nine major deformations (e.g., erosional washouts, subsidence, collapses, small-scale landslides, etc.) were observed over the road, six of which were caused by the lack of a culvert.
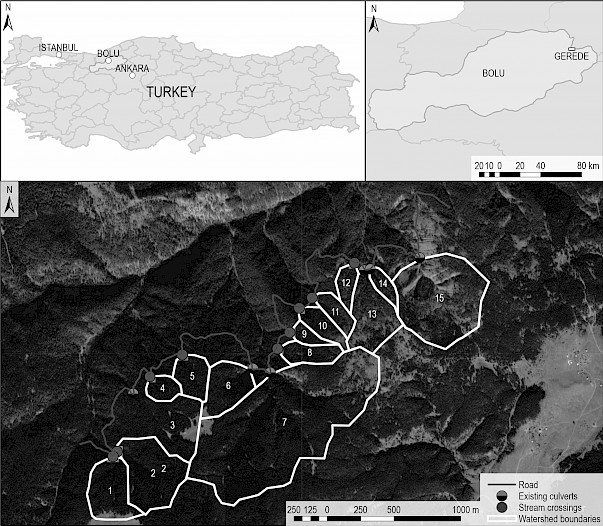
Fig. 1 Location of the study area. Grey line represents the forest road, two colored dots are corrugated plastic pipe culverts, one colored dots are stream crossings that need a culvert, and white polygons are watershed boundaries. The culvert numbers are identical to the numbers of watersheds
2.2 Workflow of Study
The workflow of the study includes the following steps (Fig. 2):
Þ data acquisition and pre-processing
Þ calculating maximum discharges of watersheds
Þ hydraulic analyses using HEC-RAS
Þ comparing CSAs from Talbot’s formula with those of HEC-RAS hydrological models.
The data acquisition and pre-processing step consisted of three work groups carrying out UAV photogrammetry, obtaining precipitation data, and obtaining and generating maps. All processing and analysis steps are described in detail in the following sections.

Fig. 2 Workflow of study
2.3 Data Acquisition and pre Processing
In this study, a topographical map at a scale of 1/25000, daily total precipitation data (mm), a major soil type (MST) map, and a forest-stand type (FST) map indicating land-cover data were obtained from governmental agencies. The topographical map was obtained in vector format for generating the DEM that was the basis for many GIS applications in this study. Daily total precipitation data are recorded by Gerede Meteorology Station (GMS), which has been recording weather parameters such as precipitation, wind, and rainfall intensity since 1963. The DEM generated from the topographical map was used to delineate specifications of the watersheds, such as boundaries and areas. The FST map was obtained from the Gerede Forest Directorate and the MST map from the Ministry of Agriculture and Forestry, General Directorate of Agricultural Research and Policies. An area weighted average slope (AWAS) map was generated from the DEM. The hydrological soil group (HSG) map was generated in four groups by using the AWAS and MST maps (Mockus 1964, SCS 1964, SCS 1986). Curve numbers (CNs) were determined for each of the land-use types from both the FST and HSG maps. As one of the important phases of this study, fieldwork was carried out to survey the drainage structures and the deformations over the platform and cut slopes of the road caused by drainage problems. First, the diameter (cm) and length (m) of the drainage structures were measured. The coordinates of the structures were then taken using a global navigation satellite system (GNSS) receiver. In addition, the deformations along the road such as landslides, culvert washout, erosion cracks, etc. were investigated.
In the present study, UAV technology was used to create very high-resolution orthomosaics and DEMs. There are three main steps in UAV photogrammetry (Eker et al. 2018):
Þ off-site preparation
Þ on-site preparation and image acquisition
Þ post processing.
In the off-site preparation, UAV flights were planned using Universal Ground Control Software (UgCS) version 2.13.519 (Fig. 3). On-site preparation and image acquisition involved field work such as applying ground control points (GCPs), which were surveyed at <3 cm centimeter accuracy using a SATLAB SL600 GNSS receiver (Fig. 3), and conducting the flights. The GNSS receiver acquires the position corrections by NTRIP technology via an Internet connection in CORS mode. When the GNSS receiver could not be used, i.e., when the Internet was cut off during field work, the Topcon GTS 105N total station (Fig. 3) was also used. The DJI Mavic Pro (Fig. 3) UAV platform was used to acquire images. In this study, UAV flights were carried out both manually and in autonomous mode. The autonomous flight was carried out for mapping the entire road from an altitude of 50 m, whereas the manual flights were conducted at lower altitudes varying from 5 to 15 m in order to obtain more detailed maps of road-stream crossings. Manual flights were also performed to map surfaces located under the vegetation, with images taken at oblique angles and not from a nadir view. The post-processing step included processing images taken via Agisoft Metashape Professional Software. Before creating the DEM, point clouds were classified to eliminate ground cover (such as trees and bushes) existing on the banks of the gully from the point cloud by using »Classify Ground Points« tool in Agisoft software, which allows to filter ground and above ground points automatically. The UAV-DEMs were then created for use as input for further processes.
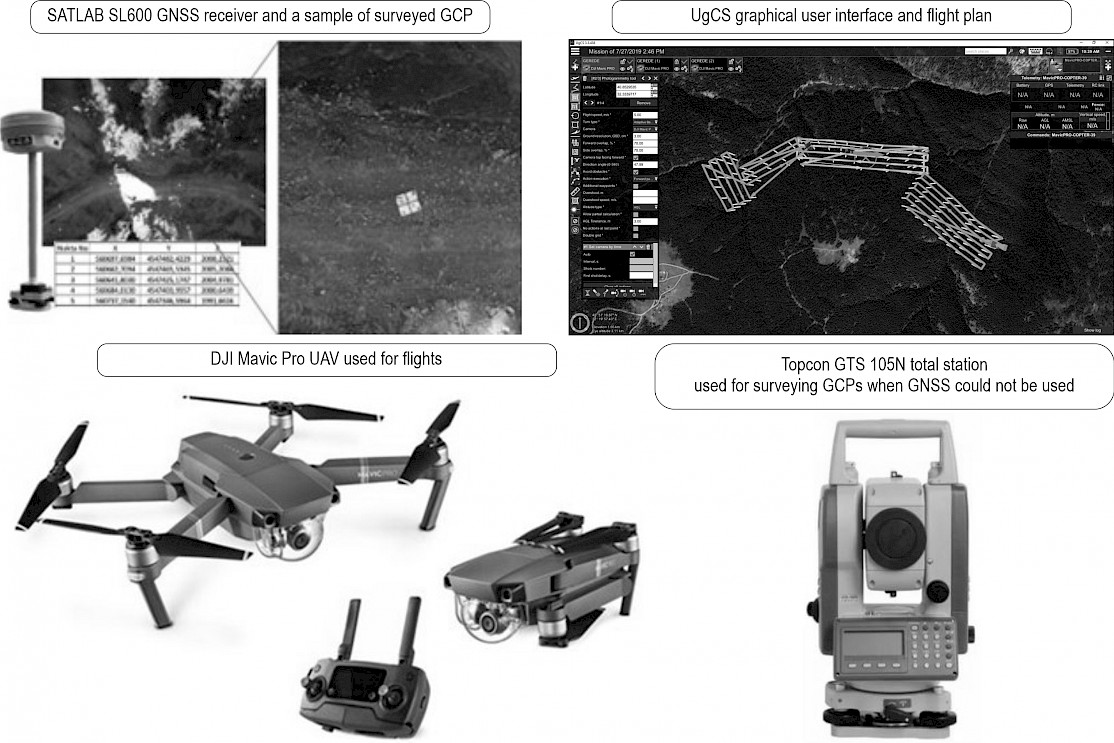
Fig. 3 Used equipment
2.4 Calculating Maximum Discharges and HEC-RAS Simulations
In this step of the study workflow, the maximum discharges of the watersheds were estimated for hydraulic analyses using the HEC-RAS model (HEC-RAS software version 5.0.7). Two main inputs are necessary to simulate the flow in HEC-RAS:
Þ model geometry including topography and specifications of the structure
Þ flow data.
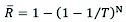
The terrain data (DEMs) generated by the manual UAV flights for each stream crossing were used as the basis (USACE 2020). The DEMs used here had a spatial resolution of less than 1 cm. Cross-sections, banks, and thalweg lines were digitized over these very high-resolution DEMs. Specifications of the structure (type, length, diameter, etc.) and ineffective flow areas were also defined. Estimated maximum discharges were used to prepare the flow plan. The HEC-RAS model was used to evaluate whether or not the existing culverts could handle the maximum discharge flow. The HEC-RAS models were also re-simulated by editing the size of the existing structures until finding the required CSA for a culvert based on determined maximum discharge. Moreover, the resulting size of the culverts was compared with the size of the culverts determined by Talbot’s formula. In other words, this study aimed to compare the CSAs of culverts constructed on road with CSAs calculated by Talbot’s formula, and determined by HEC-RAS simulations. Even though Talbot’s formula needs to be used for the calculation of CSA, the forest road engineers did not pay enough attention to construct culverts according to CSAs calculated by Talbot’s formula. Before deciding the CSA of a culvert in adequated engineering standarts in planning phase, the design life and hydrological risk of failure had to be calculated. In this context, the design life of a culvert (n) was determined as 20 years and the return period (T) as 50 years. The hydraulic risk of failure ( for the given n and T values was calculated according to the risk analysis method (Eq. 1) described by Chow (1964).
 (1)
(1)
Where:
N is design life, years
T is return period
is hydrological risk of failure.
The empirical method of Talbot’s formula was used in determining the CSA (Eq. 2).
 (2)
(2)
Where:
S is CSA of a cross-drainage structure, m2
A is watershed area, km2
C is Talbot’s coefficient.
In this study, the maximum discharges were estimated using:
Þ Rational method (Mulvaney 1851)
Þ Kursteiner method (Kollersberger 2009)
Þ Soil Conservation Services-Curve Number (SCS-CN) method (SCS 1964, Kent 1968, SCS 1972, Chow et al. 1988, SCS 1985, Johnson 1998, Mishra and Singh 1999, Neitsch et al. 2001).
The Rational method calculates the maximum discharges based on the parameters given in Eq. (3).
 (3)
(3)
Where:
Q is maximum discharge, m3/s
C is runoff coefficient (Chow et al. 1988)
i is Talbot’s coefficient
A is drainage area, ha.
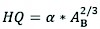
The Kürsteiner formula is given in Eq. (4). The adaptation coefficient required in this formula was obtained from Table 1.
 (4)
(4)
Where:
HQ is the peak discharge, m3/s
AB is watershed area (km2)
α is adaptation coefficient.
Table 1 Adaptation coefficients (Kollersberger 2009)
|
Watershed Characteristics |
HQ100 |
HQ50 |
|
Flat or hilly surface, rich in vegetation and absorbent soil |
9 |
5 |
|
Steep terrain with sparse vegetation and impenetrable soil |
12 |
8 |
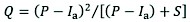
The third approach used to estimate the maximum discharge was the SCS-CN method. This method estimates the maximum discharge related to land-cover types and rainfall through a curve number. Eq. (5) was developed from recorded precipitation data that included the total amount of rainfall in 24 h, but not its distribution with respect to time (SCS 1964, Mockus 1964, Kent 1968, SCS 1985, USACE 1993).
 (5)
(5)
Where:
Q is accumulated direct runoff
P is accumulated rainfall
Ia is initial abstraction including surface storage
S is potential maximum retention.
According to Bo et al. (2011), a relationship was developed between the Ia an S parameters. This relationship eliminated the need for the calculation of Ia for common use. According to this relationship, if P≥0.2S, it can be assumed that Ia=0.2S, and by substituting 0.2S for Ia, the new Eq. (6), will be as follows.
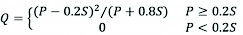 (6)
(6)
To make Eq. (6) suitable for application, S is expressed in the form of a dimensionless runoff curve number (CN) that represents the discharge potential of the land-cover/soil characteristics governed by the soil antecedent moisture condition (AMC), soil type, land use, and treatment. Potential maximum retention (S) was calculated by Eq. (7).
 (7)
(7)
The AMC is categorized in three groups: dry (lower limit moisture or upper limit of S), moderate (normal or average soil moisture condition), and wet (upper limit of moisture conditions or lower limit of S), referred to as AMC I, AMC II, and AMC III, respectively (Mishra and Singh 1999). The CN value of AMC II (CNII) was calculated by Eq. (8), and the CN values of AMC I (CNI) and AMC III (CNIII) were calculated according to the CNII value by applying Eq. (9) and (10), respectively (SCS 1985, Hawkins et.al 1985):
 (8)
(8)
 (9)
(9)
 (10)
(10)
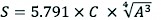
Maximum discharge was calculated by , tpeak was calculated by , Intense precipitation was calculated by , and tlag was calculated by , time of concentration was calculated by Kiprich equation . Where Qmax is maximum discharge (m3/s), R0 is runoff (cm), A is watershed area (km2), tpeak time of reaching the peak flow (hours), D is duration of intense precipitation, tlag delay time (hours), L is the length of mainstream, S is the main channel slope.
The frequency analysis was performed using the Log Pearson Type III (LP III) distribution method to determine the discharge amount for a 50-year return period (Eq. 11) (USGS 1982, USACE 1993, Griva et al. 2003).
 (11)
(11)
Where:
XLP,T logarithm of predicted discharge, at return period T
average of annual peak discharge logarithms
KLP,T a function of return period and skew coefficient provided in frequency factor by Haan (1977)
S1 standard deviation of logarithms of annual peak discharge.
3. Results and Discussion
According to observations and surveys during the fieldwork, there were 15 stream crossings along the road investigated, with six of them having a corrugated pipe culvert. Fig. 1 depicts the position of the corrugated pipe culverts and cross-drainage points (stream crossings) that required a culvert. The culverts over stream crossings were numbered the same as the relevant watershed, i.e., Culvert 1 was installed over the stream crossing of Watershed 1. According to the field surveys, Culvert 14 had a diameter of 65 cm, whereas the other culverts (No. 3, 6, 7, 13, and 15) had a diameter of 85 cm. Culvert 3 and Culvert 7 were 12.5 m in length, whereas the other culverts (No. 6, 13, 14, and 15) were 6.5 m in length. Additionally, nine major deformations (e.g., erosional washouts, subsidence, collapses, small-scale landslides, etc.) were observed over the road, six of which were caused by the lack of a culvert (Figs. 4 and 5). In other words, this absence of structures was the proof of inadequate application of engineering standards during the construction of the road.
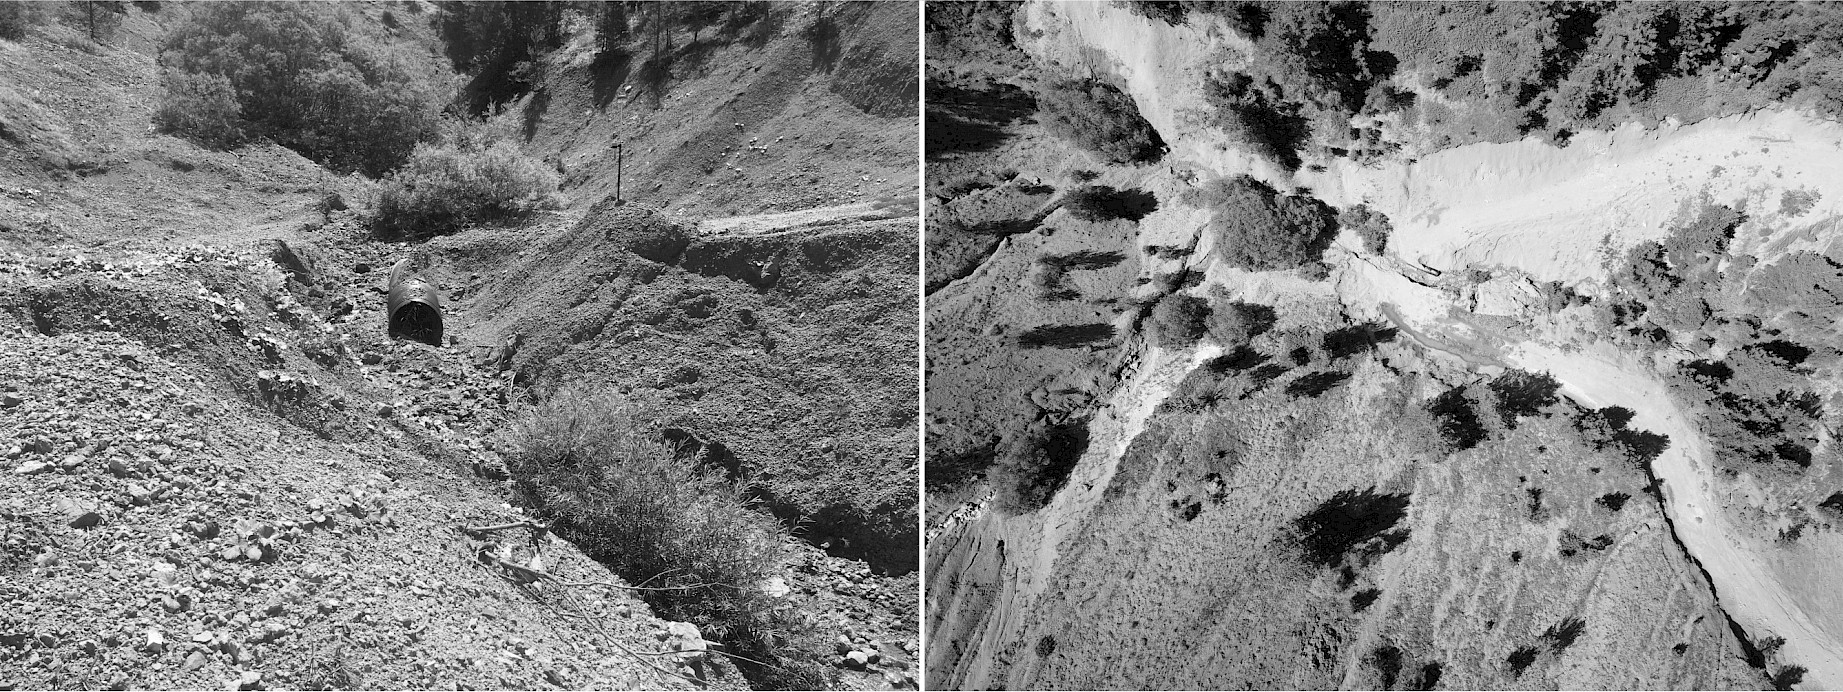
Fig. 4 Deformation due to insufficient CSA of Culvert 15
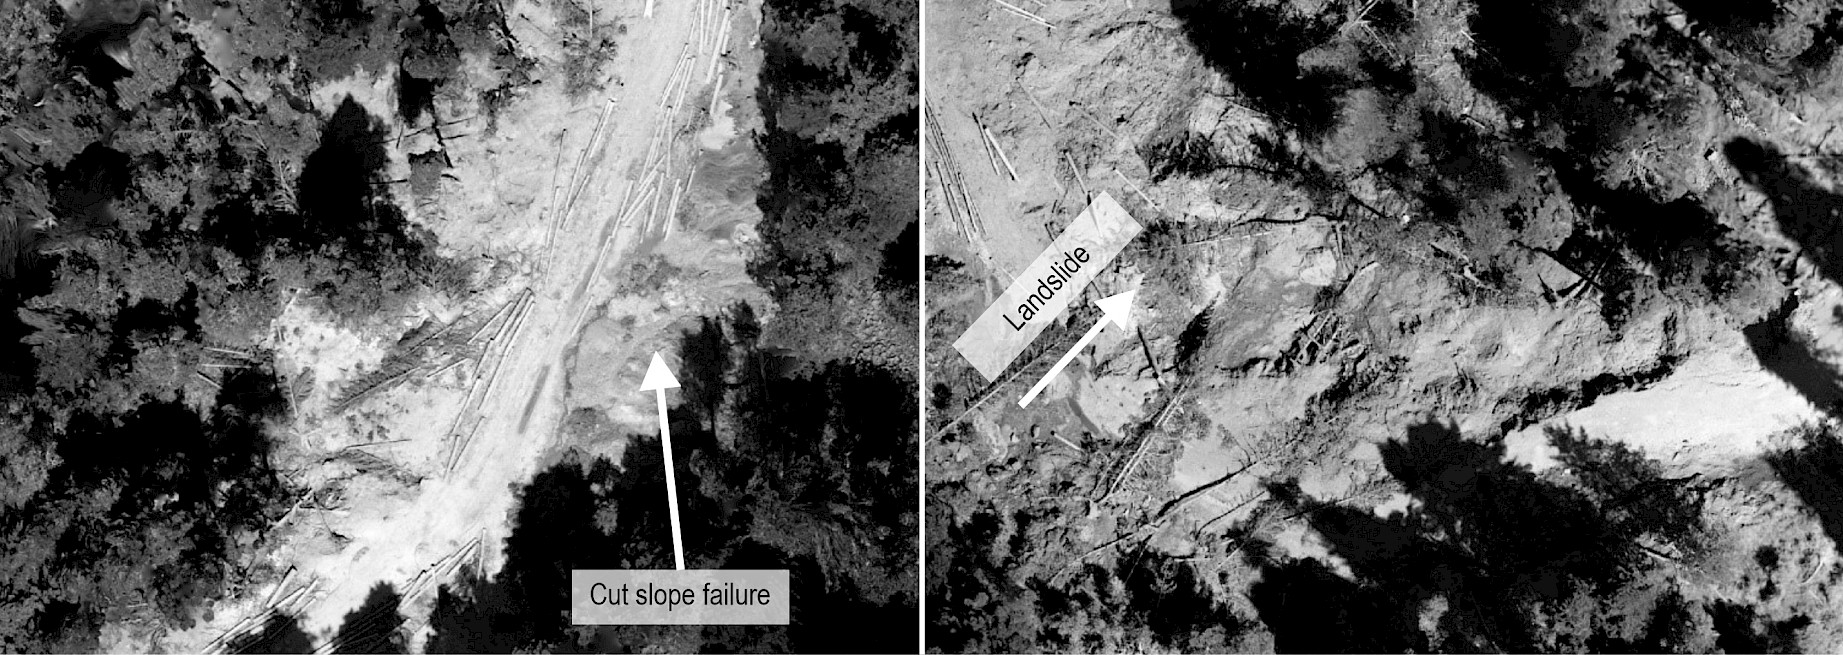
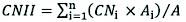
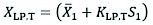
Fig. 5 (Left) Deformation due to lack of culvert at stream crossing of Watershed 8; (Right) Deformation due to insufficient CSA of Culvert 13. The logs in left figure were harvested for road construction but could not be transported as a consequence of road closure due to deformations on road platform. İn the right figure, the fall of trees was due to the landslide
In Turkey, drainage structures on forest roads are designed according to Communiqué No 292 on Forest Road Planning, Construction and Maintenance. However, this communiqué does not include any information about the design life of culverts, although a 20-year lifespan is commonly assumed for such structures. Moreover, Bayoğlu and Hasdemir (1991) stated that hydraulic structures are generally designed considering a 10-year return period, but for larger watersheds, the return period of 50 or 100 years could be considered. For this reason, we considered an expected maximum discharge for a 50-year return period during their lifespan of 20 years. Accordingly, the hydrological risk of failure of all culverts was determined as 33%, which means that structures can reach their expected lifespan with a 67% likelihood of success for a return period of 50 years.
Maximum discharges were found by applying the Rational formula, SCS-CN method, and Kursteiner formula (Table 2). The Rational method is the only method described in Communiqué No 292 for estimating maximum discharge in the determination of CSA. However, in the literature, a number of studies in Turkey have examined the use of different methods for the estimation of maximum discharge in determining the CSA of culverts. For example, Gül (1999) used the Rational along with the Unit Hydrograph, Synthetic Unit Hydrograph, and the Mockus, Snyder and SCS Dimensionless Unit Hydrograph methods to estimate maximum discharge for determining the CSA of culverts. Çalışkan (2007) also used the Rational and the Synthetic Unit Hydrograph methods to estimate the maximum discharge that hydraulic structures need to drain during the flow of storm events. However, only the sample study of forest roads by Bayoğlu and Hasdemir (1991) applied the Rational method alone. The present study also applied the Kürsteiner formula and the SCS-CN method along with the Rational method. These three methods were compared in terms of required parameters such as watershed characteristics and meteorological data. The Rational and SCS-CN methods require meteorological data (daily total precipitation data for SCS-CN and rainfall intensity data for the Rational method), whereas the Kürsteiner method does not require any meteorological data. This shows that the Kürsteiner method can be an option when meteorological precipitation data are not available. All three methods require information on the watershed area and land-use types. In terms of the soil type parameter, which plays an important role in the rainfall-runoff ratio, only the SCS-CN method requires the HSG as a direct input for determining the CN values. Similarly, the slope parameter is used as direct input for the SCS-CN method, and for this method, frequency analyses are performed with the Log Pearson Type III (LPT-III) distribution. The LPT-III is accepted as a default frequency analysis method for SCS. The LPT III method yields better results for runoff frequency determination (Reich and Renard 1981, USGS 1982, USACE 1993, Griva et al. 2003).
Table 2 Estimated maximum discharges (m3/s)
|
Watershed number |
Watershed area (ha) |
Maximum discharges, m3/s |
||
|
Rational formula |
SCS-CN (Qmax) HQ (50) |
Kürsteiner (Qmax) HQ (50) |
||
|
1 |
13 |
0.86 |
0.64 |
1.27 |
|
2 |
22 |
1.42 |
1.11 |
1.78 |
|
3 |
17 |
1.10 |
1.14 |
1.50 |
|
4 |
5 |
0.32 |
0.73 |
0.66 |
|
5 |
7 |
0.44 |
0.62 |
0.83 |
|
6 |
12 |
0.76 |
1.20 |
1.17 |
|
7 |
95 |
6.03 |
7.97 |
4.46 |
|
8 |
6 |
0.39 |
0.68 |
0.75 |
|
9 |
3 |
0.18 |
0.21 |
0.45 |
|
10 |
6 |
0.38 |
0.46 |
0.74 |
|
11 |
6 |
0.40 |
0.62 |
0.76 |
|
12 |
4 |
0.26 |
0.32 |
0.57 |
|
13 |
16 |
1.02 |
1.05 |
1.30 |
|
14 |
3 |
0.21 |
0.25 |
0.50 |
|
15 |
40 |
4.64 |
5.26 |
4.20 |
According to Table 2, maximum discharges of 0.18–6.03 were found for the Rational method, 0.45–4.46 for the Kürsteiner method, and 0.25–7.97 for the SCS-CN method. Maximum discharges estimated by the selected methods varied depending on the parameters. When compared to other methods, the Rational formula did not result in the highest discharge for the same watershed. When the methods were compared for watersheds that had culverts, the highest discharges were obtained with the Kürsteiner method for Watersheds 3, 13, and 14, whereas the SCS-CN method resulted in the highest discharge for Watersheds 6, 7, and 15.
Geometric data for the HEC-RAS can be produced using various methods ranging from terrestrial surveying techniques to remote sensing. As for the remote sensing techniques, data for obtaining a terrain model can vary from among stereo optical images to radar systems (Shuttle Radar Topographic Mission – SRTM and Advanced Spaceborne Thermal Emission and Reflection Radiometer – ASTER) or laser scanning systems (air and ground). The resolution and accuracy of the DEM data depend on the remote sensing technique. For example, Casas et al. (2006) generated DEMs from different sources such as a global positioning system (GPS) survey and bathymetry, high-resolution laser altimetry data LiDAR, and vector map (1:5000). Results showed that both GPS and LiDAR based DEMs provided more accurate results than vector map. Schumann et al. (2010) compared DEM data generated from SRTM with laser scanning data. Md Ali et al. (2015) compared laser scanning data, a topographic map, and SRTM and ASTER data. Farooq et al. (2019) compared WorldDEM, SRTM, ALOS, and ASTER data. There are also studies using the UAV technique for generating DEMs for HEC-RAS (Maurato et al. 2017, Faudzi et al. 2019). For the HEC-RAS model, UAV-based very high-resolution DEMs (<1 cm) were used to build the model geometry. Fig. 6 shows an example of a UAV-based orthomosaic and DEM generated in the present study. The UAV-based DEM represents the topography more accurately than the DEMs generated from topographical maps because of their coarse spatial resolutions. In addition, terrestrial surveys were carried out at discrete points. However, the UAV data enabled the creation of spatially continuous maps in very high resolution (Fig. 7). Surveys at discrete points require additional interpolation procedures that decrease the ability to represent the topography of the surveyed data. Moreover, UAV technology can be used for data acquisition at almost any time, as weather conditions allow, provided that it is during daylight hours. It can be concluded that the use of UAVs in time-series data acquisition is flexible, fast, efficient, and relatively less costly.
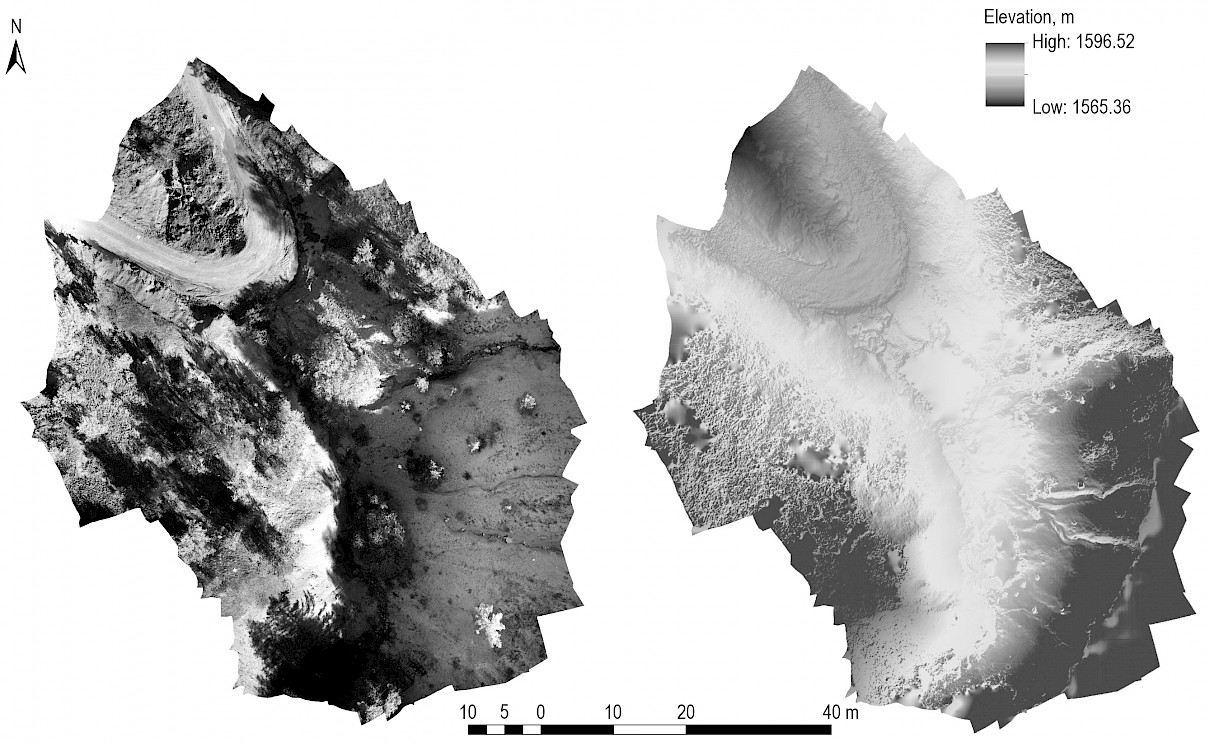
Fig. 6 (Left) UAV-based orthomosaic of Watershed-15, (Right) DEM-generated for stream crossing of Watershed 15
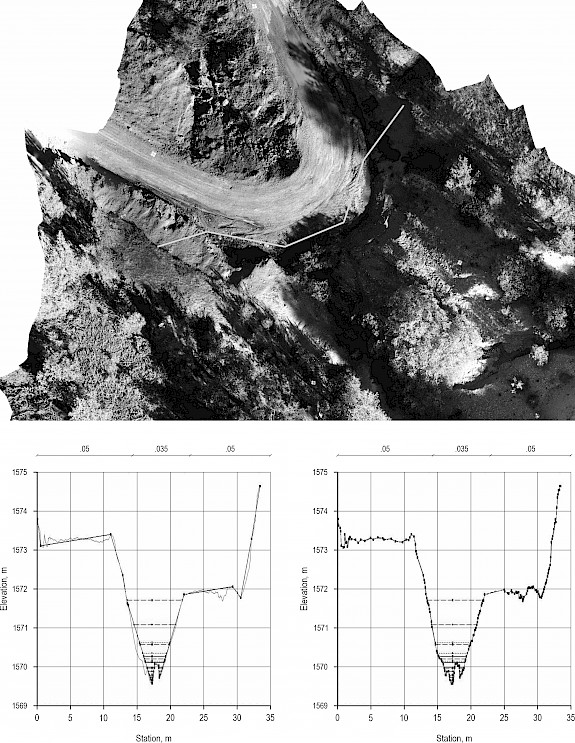
Fig. 7 (Left) Cross-section at discrete points surveyed by GNSS, (Right) Cross-section created from very high-resolution UAV-DEM
According to the simulation results of the HEC-RAS models, the installed Culverts 3, 7, 13, and 15 were unable to drain the estimated maximum discharges. However, the installed Culverts 6 and 14 were found to be capable of draining the estimated maximum discharges (Fig. 8). The finding for a sample simulation conducted for Culvert 15 revealed that it was unable to drain the maximum discharge (Fig. 9). However, a sample HEC-RAS simulation for Culvert 15 with its proposed size was found to be capable of draining the maximum discharge (Fig. 10). In this sample, a two-box culvert in dimensions of 1.5×1 m each was proposed rather than the corrugated pipe culverts (Table 3). The results showed that the installed culverts were mostly unable to drain the maximum discharges. In other words, they were not designed to meet engineering standards with regard to structural dimensions. Consequently, as was expected, they failed by causing and/or increasing deformations on the road. The CSAs of the installed culverts were also compared with the CSAs calculated by Talbot’s formula, which showed that for three culverts (No. 7, 13, and 15), the CSAs were significantly smaller than the CSAs obtained by Talbot’s formula (Table 3). Culverts 3 and 14 had almost the same CSA values as those calculated by Talbot’s formula. However, Culvert 6 had a greater CSA than that calculated by Talbot’s formula.
The CSAs of the culverts capable of draining maximum discharges were determined via the HEC-RAS models considering the largest maximum discharges estimated by the selected methods, i.e., Rational, Kürsteiner, and SCS-CN (Table 3). The CSAs determined by the HEC-RAS models considering the maximum discharges were found to be larger than for the installed culverts and those calculated by Talbot’s formula. Culverts 3, 7 and 15 were found to have significantly lower CSAs in both installed and calculated by Talbot’s formula. The same value was found for the CSA of Culvert 13 (0.85 m2) by both Talbot’s formula and the proposed HEC-RAS-based model. The CSAs calculated according to Talbot’s formula were not tested with the HEC-RAS analyses as to whether they would flow the water with maximum discharges or not. It was revealed that most of the CSAs calculated using Talbot’s formula were found incapable of draining maximum discharges compared to the CSA calculations based on the HEC-RAS model.
Table 3 Comparison of CSA values of culverts and proposed types of hydraulic structures
|
Culvert No. |
CSA, m2 |
Proposed hydraulic structures |
||
|
Installed |
By Talbot’s formula |
By HEC-RAS simulation |
||
|
3 |
0.57 |
0.60 |
1.00 |
Corrugated pipe culvert |
|
6 |
0.57 |
0.45 |
- |
Installed culvert is sufficient |
|
7 |
0.57 |
3.25 |
4.50 |
Double-cell box culvert |
|
13 |
0.57 |
0.85 |
0.85 |
Corrugated pipe culvert |
|
14 |
0.33 |
0.30 |
- |
Installed culvert is sufficient |
|
15 |
0.57 |
2.60 |
3.30 |
Double-cell box culvert |
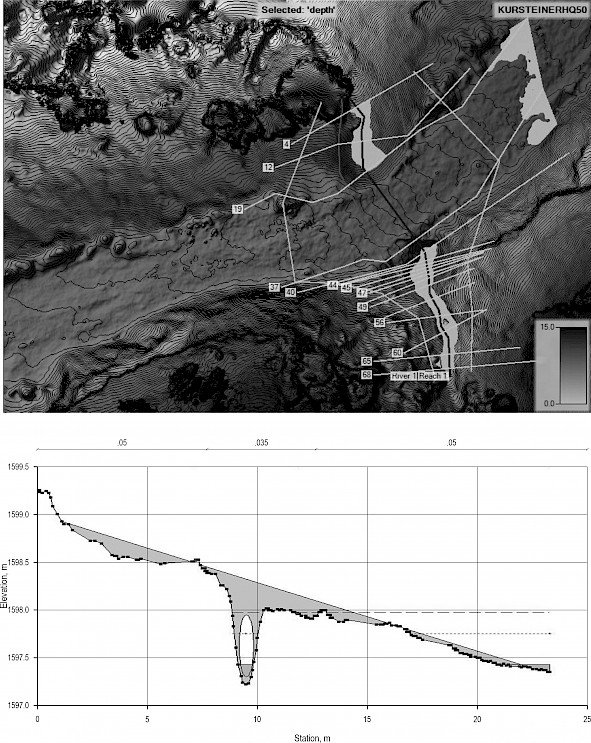
Fig. 8 HEC-RAS model simulation results for installed Culvert 14 (0.33 m2 CSA) capable of draining maximum discharge: (Top) Depth map, (Bottom) Upstream cross-section of the culvert
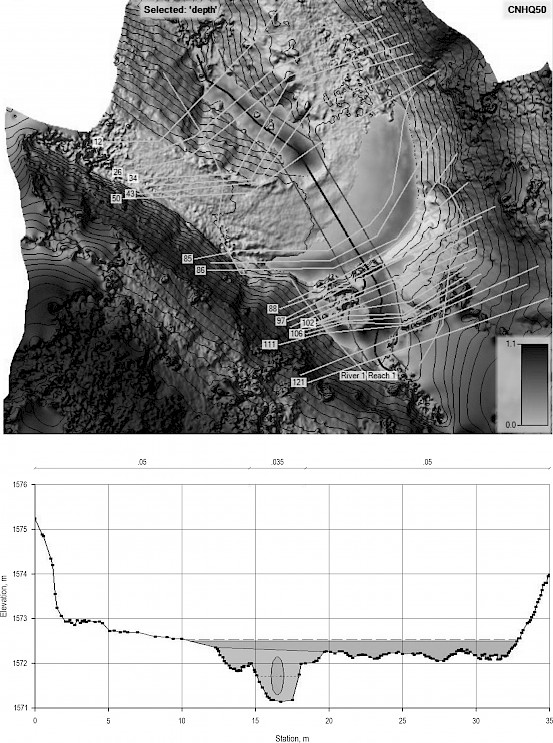
Fig. 9 HEC-RAS model simulation results for installed Culvert 15 (0.57 m2 CSA) incapable of draining maximum discharge: (Top) Depth map, (Bottom) Upstream cross-section of the culvert
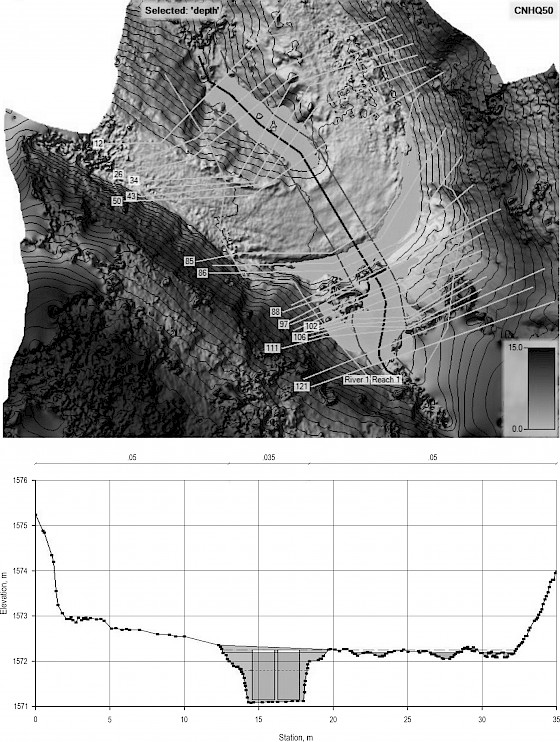
Fig. 10 HEC-RAS model simulation results for proposed Culvert 15 (double-cell box culvert), with recalculated CSA, capable of draining maximum discharge: (Top) Depth map, (Bottom) Upstream cross-section of the culvert
5. Conclusions
The study concluded that, when forest roads are not constructed to meet engineering standards in terms of the structures designed to drain maximum discharges at stream-crossing points, they suffer from rainfall and surface runoff-related deformation, causing heavy increases in maintenance costs. It could also be concluded that the dimensions of most such drainage structures installed on forest roads in Turkey are incapable of draining the maximum discharges expected from relevant watersheds. In Turkey, drainage structures are designed in accordance with Communiqué No 292, and numbered forest roads are built according to Forest Road Planning, Construction and Maintenance. In the Communiqué, the Talbot’s formula is recommended for dimensioning drainage structures. However, this study concluded that the culvert dimensions (i.e., CSA values) obtained via Talbot’s formula were mostly insufficient and were incapable of draining maximum discharges when compared to the proposed dimensions based on other hydrologic models visualized by the HEC-RAS. The present study demonstrated that the HEC-RAS models had successfully used advanced methods in the dimensioning and visualization of hydraulic structures in a more reliable way. The HEC-RAS model requires two main inputs: a geometric model and correctly estimated maximum discharges. Maximum discharges were estimated using three different approaches: the Rational, Kürsteiner, and SCS-CN methods. These different approaches can provide flexibility for engineers in the estimation of maximum discharges, depending on data availability. For example, the Kürsteiner method does not require any meteorological data, meaning that this method can be an option when meteorological precipitation data cannot be obtained. Thus, each method has various advantages or disadvantages for the estimation of maximum discharges. Another important point of the study was the use of UAV remote sensing to obtain the model geometry required for the HEC-RAS model. In the present study, manual UAV flights were carried out because of the existence of vegetation at the stream-crossing points. When there is high-density vegetation, UAV-based DEMs cannot be created accurately by autonomous flights whose images are taken mostly at nadir-view angles. The present study concluded that both modern UAV remote sensing technology and HEC-RAS modeling, as an advanced approach in simulating maximum discharges, can be used successfully, efficiently, and with more reliable results, by the engineers.
7. References
Allison, C., Sidle, R.C., Tait, D., 2004: Application of decision analysis to forest road deactivation in unstable terrain. Environ Manage 33(2): 173–185. https://doi.org/10.1007/s00267-003-0142-y
Arıcak, B., Enez, K., Acar, H.H., 2010: Defining the Slope Stability Areas of Forest Roads. In: Proceeding of FORMEC 2010, Forest Engineering: Meeting the Needs of the Society and the Environment, 11–14 July, Padua, Italy, 1–7 p.
Bayoğlu, S., Hasdemir, M., 1991: Selection and sizing of small hydraulic road structures established on forest roads. J Fac For Istanbul U B41(3–4): 17–38.
Bayoğlu, S., 1997: Forest Transport Facilities and Vehicles. İstanbul University Faculty of Forestry Publication, No. 434, İstanbul.
Brinker, R.W., 1995: Forest Road and Construction Associated Water Diverson Devises. Alaban Cooperatives Extension System. ANR 916.
Bo, X., Qing-Hai, W., Jun, F., Feng-Peng, H., Quan-Hou, D., 2011: Application of the SCS-CN model to runoff estimation in a small watershed with high spatial heterogeneity. Pedosphere 21(6): 738–749. https://doi.org/10.1016/S1002-0160(11)60177-X
Çalışkan, U., 2007: Surface Drainage Systems and Hydraulic Design Principles in Road Transport Networks. MSc, İstanbul University, İstanbul, Türkiye.
Casas, A., Benito, G., Thorndycraft, V.R., Rico, M., 2006: The topographic data source of digital terrain models as a key element in the accuracy of hydraulic flood modelling. Earth Surface Processes and Landforms: BSG 31(4): 444–456. https://doi.org/10.1002/ESP.1278
Case, A.B., Donnelly, J.G., 1979: Type and extent of ground disturbance following skidder logging in Newfoundland and Labrador. Environment Canada, Newfoundland For. Res. Cent. Inf. Rep. N-X-176: 25 p.
Chow, V.T., 1964: Statistical and probability analysis of hydrologic data. In Handbook of Applied Hydrology (Section 8–1). McGraw-Hill Inc.: New York.
Chow, V.T., Maidment, D.R., Mays, L.W., 1988: Applied hydrology. McGraw-Hill Inc.: New York.
Coker, R.I., Fahey, B.D., 1993: Road-related mass movement in weathered granite, Golden Downs and Motueka Forests, New Zealand: a note. J Hydrol 31(1): 65–69.
Conesa-García, C., García-Lorenzo, R., 2013: Evaluating the effectiveness of road-crossing drainage culverts in ephemeral streams. Hydrol Process 27(12): 1781–1796. https://doi.org/10.1002/hyp.9335
Damayanti, M., Sutrisno, M., Karnisah, I., 2020: The road drainage planning for flood control in Dr. Djunjunan road, Pasteur – Bandung. In: proceeding of IOP Conference Series: Materials Science and Engineering, Volume 180, 1st Annual Applied Science and Engineering Conference (AASEC), in conjuction with The International Conference on Sport Science, Health, and Physical Education (ICSSHPE) 16–18 November 2016, Bandung, Indonesia, 012032 p. https://doi.org/10.1088/1757-899X/732/1/012032
Demir, S., 2019: Assessment of forest roads and art structures in terms of flood risk with the help of GIS. MSc Thesis, Artvin Çoruh University, Artvin, Turkey.
Eker, R., Aydın, A., 2014: Assessment of forest road conditions in terms of landslide susceptibility: a case study in Yığılca Forest Directorate (Turkey). Turk J Agric For 38(2): 281–290. https://doi.org/10.3906/kim-1204-72
Eker, R., Aydın, A., Hübl, J., 2018: Unmanned aerial vehicle (UAV)-based monitoring of a landslide: Gallenzerkogel landslide (Ybbs-Lower Austria) case study. Environ Monit Assess 190: article number 28. https://doi.org/10.1007/s10661-017-6402-8
Egan, A., Jenkins, A., Rowe, J., 1985: Forest road in west Virgina, USA: Virgina University Morgan, Town, WV, USA.
Faudzi, S.M.M., Abustan, I., Kadir, M.A.A., Khairi, M., Wahab, A., Razak, M.F.A., 2019: Two-dimensional simulation of Sultan Abu Bakar Dam release using hec-ras. Int. J. GEOMATE 16(58): 124–131.
Farooq, M., Shafique, M., Khattak, M.S., 2019: Flood hazard assessment and mapping of River Swat using HEC-RAS 2D model and high-resolution 12-m TanDEM-X DEM (WorldDEM). Nat Hazards 97(2): 477–492. https://doi.org/10.21660/2019.58.icee18
Forman, R.T., Sperling, D., Bissonette, J.A., Clevenger, A.P., Cutshall, C.D., Dale, V.H., Fahrig, L., France, R., Goldman, C.R., Heanue, K., Jones, J.A., Swanson, F.J., Turrentine, T., Winter, T.C., 2003: Road ecology: science and solutions. Island press. GREIS, P.N., 1983. Flood Frequency Analysis: A Review of 1979–1982. Reviews of Geophysics and Space Physics 21(3): 699–706. https://doi.org/10.1029/RG021i003p00699
Griva, A., Baltas, E.A., Varanou, A., Mimikou, M.A., 2003: GIS-Based Floodplain Mapping in Greece. In: proceeding of International Conference on Towards Natural Flood Reduction Strategies, 6–13 September, Warsaw, Poland, 1–5 p.
Gül, A., 1999: Cross-Drainage&Culvert Design On Highways, MSc Thesis, Dokuz Eylül University, İzmir, Turkey.
Haan, C.T., 1977: Statistical Methods in Hydrology. The Iowa State University Press: Ames, Iowa.
Hasmadi, M.I., Kamaruzaman, J., Azizon, J.M., 2008: Forest road assessment in Ulu Muda Forest Reserve, Kedah, Malaysia. Modern App Sci 2(4): 100–108. https://doi.org/10.5539/mas.v2n4p100
Hawkins, R.H., Hjemfelt, A.T., Zevenberger, A.W., 1985: Runoff Probability, Storm Depth, and Curve Numbers. J Irrig Drain Eng 111(4): 330–340.
Hirpessa, Y.A., Hailu, D., 2019: Assessment of failure of drainage structures along the Ethiophian National Railway Line of Sebeta-Mieso (Case Study of Akaki River Crossing Drainage Structure). Int. J. Res. Granthaalayah 7(9): 123–137. https://doi.org/10.29121/granthaalayah.v7.i9.2019.568
Horritt, M.S., Bates, P.D, 2002: Evaluation of 1-D and 2-D numerical models for predicting river flood inundation. J Hydrol 268(1–4): 87–99. https://doi.org/10.1016/S0022-1694(02)00121-X
Hutanu, E., Mihu-Pintilie, A., Urzica, A., Paveluc, L.E., Stoleriu, C.C., Grozavu, A., 2020: Using 1D HEC-RAS Modeling and LiDAR Data to Improve Flood Hazard Maps Accuracy: A Case Study from Jijia Floodplain (NE Romania). Water 12(6): 1624. https://doi.org/10.3390/w12061624
Johnson, R.R., 1998: An Investigation of Curve Number Applicability to Watersheds in Excess of 25000 Hectares (250 km2). J Environ Hydrol 6: 1–6.
Jones, J.A., Swanson, F.J., Wemple, B.C., Snyder, K.U., 2000: Effects of roads on hydrology, geomorphology, and disturbance patches in stream networks. Conserv Biol 14(1): 76–85. https://doi.org/10.1046/j.1523-1739.2000.99083.x
Keller, G., Sherar, J., 2003: Low-volume roads engineering: best management practices, In: Transportation Research Record No. 1819, Volume 1, 8th International Conference on Low-Volume Roads, 22–25 June; Reno, Nevada, 174-181 p.
Kent, K.M., 1968: A method for estimating volume and rate of runoff in small watersheds. USDA SCS. TR 149.
Kochenderfer, J.N., 1977: Area in skidroads, truck roads, and landings in the central Appalachians. J. For. 75(8): 507–508. https://doi.org/10.1093/jof/75.8.507
Kollersberger, M., 2009: Hydrologische Modellierung für die Planung und Durchführung von erweiterten Hochwasserschutzmaßnahmen am Goiserer Weißenbach, Institut für Alpine Naturgefahren, Diplomarbeit, Universität für Bodenkultur, Wien.
Luce, C.H., 1997: Effectiveness of Road Ripping in Restoring Infiltration Capacity of Forest Roads. Restor. Ecol. 5(3): 265–270. https://doi.org/10.1046/j.1526-100X.1997.09731.x
Maidment, D., Tate, E., Olivera, F., 1998: GIS for floodplain mapping in design of highway drainage facilities. Research Report 1738-4, Centre for Transportation Research, Bureau of Engineering research, the University of Texas at Austin.
Maurato, S., Fernandez, P., Pereira, L., Moreira, M., 2017: Improving a DSM obtained by unmanned aerial vehicle for flood modelling, IOP Conf Ser: Earth Environ. Sci. 95 022014.
Mazdi, R.A.A., Ghanbarpour, M.R., Lotfalian, M., Mehran, M., Amiri, H.K., Foumani, B.S., 2012: Hydrological considerations in designing the dimensions of cross drainage culvert in forest road. Ann. Biol. Res. 3(4): 1768–1772.
Md Ali, A., Solomatine, D.P., Di Baldassarre, G., 2015: Assesing the impact of different sources of topographic data on 1-D hydroulic modelling of floods. Hydrol Earth Syst Sci 19(1): 631–643. https://doi.org/10.5194/hess-19-631-2015
Menemencioğlu, K., Bilgili, B.C., Günlü, A., 2013: Determining the type and places of drainage structures on forest roads using remote sensing and GIS. J Food Agric Environ 11(2): 1487–1491.
Mishra, S.K., Singh, V.P., 1999: Another Look at SCS-CN Method. J. Hydrol. Eng. 4(3): 257–263. https://doi.org/10.1061/(ASCE)1084-0699(1999)4:3(257)
Mockus, V., 1964: Hydrologic Soil Groups, National Engineering Handbook, Section 4, Chaoter 7 (Reprinted with minor revisions, 1972), United States Department of Agriculture, Washington D.C.
Montgomery, D.R., 1994: Road surface drainage, channel initiation, and slope instability. Water Resour. Res. 30(6): 1925-1932. https://doi.org/10.1029/94WR00538
Mourato, S., Fernandez, P., Pereira, L., Moreira, M., 2017: Improving a DSM Obtained by Unmanned Aerial Vehicles for Flood Modelling. IOP Conf Ser: Earth Environ Sci 95(2): 022014. https://doi.org/10.1088/1755-1315/95/2/022014
Mulvaney, T.J., 1851: On the use of self-registering rain and flood gauges in making observations of the relations of rainfall and flood discharges in a given catchment. Proceedings of the Institution of Civil Engineers of Ireland, 4, 19–31.
Neitsch, S.L., Arnold, J.G., Kiniry, J.R., Williams, J.R., 2001: Soil and Water Assesment Tool, Theoretical Documentation and User’s Manual. Ver. 2000, Grassland, Texas, Soil and Water Research Laboratory, Agricultural Research Service.
OGM, 2008: Communiqué No 292 on Forest Road Planning, Construction and Maintenance. Turkish General Directorate of Forestry, Ankara.
Öztürk, T., 2020: Temporal Change of Drainage Structures in Forest Roads (Study of Bentler Forest Enterprise 2009-2019). EJFE 6(2): 52–59. https://doi.org/10.33904/ejfe.721965
Parsakhoo, A., 2018: Investigating some flow properties of forest channels in cross passage of road by HEC-RAS. Gorgan University of Agriculture science and Natural Resource 7(1): 191–204. https://doi.org/10.22069/ejang.2019.11170.1315
Reich, B.M., Renard, K.G., 1981: Applications of Advances in Flood Frequency Analysis, Water Resour Bull 17(1): 67–74. https://doi.org/10.22069/ejang.2019.11170.1315
Rezvani, M., 2012: Investigation of Drainage Structure of Forest Roads in North of Iran. GJBB 1(2): 220–222.
Saksena, S., Merwade, V., 2015: Incorporating the effect of DEM resolution and accuracy for improved flood inundation mapping. J Hydrol. 530: 180-194. https://doi.org/10.1016/j.jhydrol.2015.09.069
Scandari, S., Hosseini, S.A., 2011: Evaluation of drainage system of forest roads in Iran: Darabkola forest roads. JDAE 3(16): 703–709. https://doi.org/10.5897/JDAE11.012
Schumann, G., Di Baldassarre, G., Alsdorf, D., Bates, P.D., 2010: Near real‐time flood wave approximation on large rivers from space: Application to the River Po, Italy. Water Resour Res. 46(5): W05601. https://doi.org/10.1029/2008WR007672
Schwab, J., 1994: Erosion Control: Planning, Forest Road Deactivation and Hillslope Revegetation. A Guide for Management of Landslide-Prone Terrain in the Pacific Northwest, Second Edition, Victoria, British Columbia.
SCS, 1964: National Engineering Handbook Supplement A, Section 4, böl. 10, Washington D.C., USA, United States Department of Agriculture, Soil Conservation Service.
SCS, 1972: National Engineering Handbook (NEH) Section 4. Hydrology. Washington D.C., USA, United States Department of Agriculture, Soil Conservation Service.
SCS, 1985: Hydrology-National Engineering Handbook, Section 4. böl. 10, Washington D.C., USA, United States Department of Agriculture, Soil Conservation Service.
SCS, 1986: Urban Hydrology for Small Watersheds, TR-55, Washington D.C., USA, United States Department of Agriculture, Soil Conservation Service.
Sidle, R.C., Pierce, A.J., O‘Loughlin, C.L., 1985: Hillslope Stability and Land Use. Water Resources Monograph Series, Volume 11. Washington, DC: American Geophysical Union.
Silver, Y., Nilantha, K., Giorgis, H., 2011: 2D vs. 1D Hydraulic Modelling for Suttor Creek and Middle Creek Railway Bridge Design [online]. In: Proceedings of the 34th World Congress of the International Association for Hydro- Environment Research and Engineering: 33rd Hydrology and Water Resources Symposium and 10th Conference on Hydraulics in Water Engineering. Barton, A.C.T.: Engineers Australia, 466–474 p.
Sorkhi, A., Hosseini, S.A., Lotfalian, M., Parsakhoo, A., 2012: Effect of the standard clearing limit of forest road right-of-way on stand stock growth: case study of Vaston forests, Hyrcanian zone. Afr J Environ Sci Tech 6(1): 43–49. https://doi.org/10.5897/AJEST11.330
Stoleriu, C.C., Urzica, A., Mihu-Pintilie, A., 2020: Improving flood risk map accuracy using high-density LiDARdata and the HEC-RAS river analysis system: A case study fromnorth-eastern Romania. J Flood Risk Manag 13(Suppl. 1): e12572. https://doi.org/10.1111/jfr3.12572
Tektaş, Y., Polat, N., 2021: Flood Modeling with HEC-RAS and Flood Damage Analysis from Sentinel-2 Remote Sensing Image: The Case of Çakmak Stream Sycamore Region in Diyarbakir Province. TJRS 3(1): 28–35.
Temesgen, B.M., Gebremariam, B., Ayele, G.T., Demissie, S.S., Jemberie, M.A. 2015: Investigating Highway Drainage Problems in the Sile River Bridge, South, Ethiopia. JMEST 2(4): 515–527.
Tighe, S., Haas, R., Ponniah, J., 2003: Life-cycle cost analysis of mitigating reflective cracking. Transp Res Rec 1823(1): 73–79. https://doi.org/10.3141/1823-09
Torresan, C., Berton, A., Carotenuto, F., Di Gennaro, S.F., Gioli, B., Matese, A., Miglietta, F., Vagnoli, C., Zaldei, A., Wallace, L., 2017: Forestry applications of UAVs in Europe: A review. Int. J. Remote Sens 38(8–10): 2427–2447. https://doi.org/10.1080/01431161.2016.1252477
USACE, 1993: EM 1110-2-1415: Hydrologic Frequency Analysis. U.S. Army Corps of Engineers. Washington, D.C.
USACE, 2020: HEC-RAS Mapper User’s Manual. U.S. Army Corps of Engineers. Washington, D.C.
USGS, 1982: Guidelines for Determining Flood Flow Frequency, Bulletin 17 B, U.S. Department of Interior Geological Survey, Office of Water Data Coordination, Virginia 22092.
Üneş, F., Ziya Kaya, Y., Varçin, H., Demirci, M., Taşar, B., Zelenakova, M., 2020: Flood Hydraulic Analyses: A Case Study of Amik Plain, Turkey. Water 12(7): 2070. https://doi.org/10.3390/w12072070
van der Ree, R., Smith, D.J., Grilo, J., 2015: The Ecological Effects of Linear Infrastructure and Traffic: Challenges and Opportunities of Rapid Global Growth. In: van der Ree R, Smith D, Grilo C, (Eds.) Handbook of Road Ecology. Oxford: John Wiley & Sons; 159–171 p.
Vozinaki, A.K., Morianou, G.G., Alexakis, D.D., Tsanis, I.K., 2017: Comparing 1D and combined 1D/2D hydraulic simulations using high-resolution topographic data: a case study of the Koiliaris basin, Greece. Hydrol Sci J 62(4): 642–656. https://doi.org/10.1080/02626667.2016.1255746
Wemple, B.C., 1994: Hydrologic integration of forest roads with stream networks in two basins, Western Cascades, Oregon. MSc Thesis, Oregon State University, Corvallis, Oregon.
Yalçın, E., 2019: Two-dimensional hydrodynamic modelling for urban flood risk assessment using unmanned aerial vehicle imagery: A case study of Kirsehir, Turkey. J Flood Risk Manag 12 (Suppl. 1): e12499. https://doi.org/10.1111/jfr3.12499
Yavari, A., Homayouni, S., Oubennaceur, K., Chokmani, K., 2020: Flood inundation modeling in ungauged basins using Unmanned Aerial Vehicles imagery. Earth Observ Geomat Eng 4(1): 44-55. https://doi.org/10.22059/EOGE.2020.297824.1075
© 2022 by the authors. Submitted for possible open access publication under the
terms and conditions of the Creative Commons Attribution (CC BY) license (http://creativecommons.org/licenses/by/4.0/).
Authors’ addresses:
Ahmet Açıl, MSc *
e-mail: ahmetacil@karabuk.edu.tr
Assist. prof. Ahmet Duyar, PhD
e-mail: ahmetduyar@karabuk.edu.tr
Karabük University
Faculty of Forestry
78050 Karabük
TURKEY
Prof. Abdurrahim Aydın, PhD
e-mail: aaydin@duzce.edu.tr
Düzce University
Faculty of Forestry
81620 Düzce
TURKEY
Assist. prof. Remzi Eker, PhD
e-mail: remzi.eker@ikc.edu.tr
İzmir Katip Çelebi University
Faculty of Forestry
35620 İzmir
TURKEY
* Corresponding author
Received: May 26, 2021
Accepted: November 15, 2021
Original scientific paper