Evaluating the Use of Smartphone Applications for Log Stacks Volume Measurement in Turkish Forestry Practices
doi: 10.5552/crojfe.2024.2398
volume: 45, issue: 2
pp: 12
- Author(s):
-
- Ucar Zennure.
- Eker Remzi
- Bilici Ebru
- Akay Abdullah Emin
- Article category:
- Original scientific paper
- Keywords:
- machine vision, photogrammetry, stack volume, solid wood volume, photo-optical mobile apps
Abstract
HTML
With recent technological development, photo-optical measurement systems in mobile devices have been increasingly used for automatic wood volume estimation because of their ease of use and efficiency. This study aimed to evaluate the use of photo-optical mobile apps for measuring solid wood volume of the stack in Turkish forestry practices. For this study, 21 log stacks were measured using the traditional technique and two photo-optical mobile apps – iFovea Pro and Timbeter. A strong correlation was found between the traditionally measured solid wood volume of the stack and the volume estimated using both photo-optical apps, the number of logs in the stack, and the mean diameter of the stack. The estimated number of trees from the two apps and manual measurement were not statistically different. However, statistical differences were observed between all three measurement approaches for the mean diameter of the stack. Also, statistical test results indicated mixed results for estimated solid wood volume in the stack. In addition, the study tested whether both apps correctly measure the diameter of the logs in the stack. Thus, manually measured diameter of the randomly selected 50 trees within 21 stacks was compared to the log diameters measured automatically using both mobile apps. The results indicated no statistical difference between the three measurement approaches. The study results are promising for using photo-optical mobile apps in Turkish forestry in terms of transition to digital forestry. However, there are still opportunities to improve the capabilities of the method through further analysis of estimating stack volume using the image from both sides of the logs considering different quality and diameter classes with bark conditions.
Evaluating the Use of Smartphone Applications for Log Stacks Volume Measurement in Turkish Forestry Practices
Zennure Ucar, Remzi Eker, Ebru Bilici, Abdullah Emin Akay
Abstract
With recent technological development, photo-optical measurement systems in mobile devices have been increasingly used for automatic wood volume estimation because of their ease of use and efficiency. This study aimed to evaluate the use of photo-optical mobile apps for measuring solid wood volume of the stack in Turkish forestry practices. For this study, 21 log stacks were measured using the traditional technique and two photo-optical mobile apps – iFovea Pro and Timbeter. A strong correlation was found between the traditionally measured solid wood volume of the stack and the volume estimated using both photo-optical apps, the number of logs in the stack, and the mean diameter of the stack. The estimated number of trees from the two apps and manual measurement were not statistically different. However, statistical differences were observed between all three measurement approaches for the mean diameter of the stack. Also, statistical test results indicated mixed results for estimated solid wood volume in the stack. In addition, the study tested whether both apps correctly measure the diameter of the logs in the stack. Thus, manually measured diameter of the randomly selected 50 trees within 21 stacks was compared to the log diameters measured automatically using both mobile apps. The results indicated no statistical difference between the three measurement approaches. The study results are promising for using photo-optical mobile apps in Turkish forestry in terms of transition to digital forestry. However, there are still opportunities to improve the capabilities of the method through further analysis of estimating stack volume using the image from both sides of the logs considering different quality and diameter classes with bark conditions.
Keywords: machine vision, photogrammetry, stack volume, solid wood volume, photo-optical mobile apps
1. Introduction
In general, the methods to calculate the solid wood volume of the stack are divided into two main groups: conventional and automatic. The conventional method includes different approaches to estimate solid round wood in the stack. The first one is the use of measurements of the height, length, which is generally constant for specific assortment, and width of stacks to estimate solid round wood that includes split wood used for fuelwood, some special products, and a single log of large-size wood (Knyaz and Maksimov 2014, Hohmann et al. 2017, Berendt et al. 2021). The second is one-by-one log measurement in the stack, starting with measuring the diameter from both ends or the middle of the log and the length of each log. Then, the solid wood volume is estimated by applying diameter and length based empirical equations. Calculating the solid wood volume of every single log with a manual one-by-one measurement method can provide the most accurate volume estimation (Knyaz and Maksimov 2014). However, with a limited number of experienced operators in a limited time, this procedure leads to human-caused errors and lower accuracy. Error from the manual one-by-one method can reach up to ±10% (Janák 2005, Knyaz and Maksimov 2014, Mitrofanovs and Cekule 2019). Another method used in estimating wood volume in the stack, the weight sampling method, is applied by weighting the wood by the scale at the mill, then obtaining the green density of the wood (Fonseca 2010, Meyen and O'Connell 2012, Melkas 2018). Furthermore, the water displacement method, considered the most precise method, has been employed for measuring the actual volume of the log (Keepers 1945). Although these conventional methods of measuring the solid wood volume in the stack are considered accurate inventory methods, they are significantly labor-intensive, time-consuming, and costly depending on the number and size of stacks (Kärhä et al. 2019).
Measuring the harvested wood accurately and fast is an essential task in the wood supply chain regarding economic aspect. In particular, estimating log volume from round wood measurement is one of the most important issues in price-fixing besides log quality (Pásztory et al. 2019, Cremer et al. 2020, Berendt et al. 2021). Round wood, including split wood used for firewood and some specialty products, is usually stacked in many countries and the volume of the round wood in the stack can often be measured using two relevant parameters: stack volume and solid wood content. Stack volume is usually calculated from a cubic area occupied by a wood stack that multiples the length, width, and height of the stack (Fonseca 2005, Kärhä et al. 2019). There are two main measurement units for stack volume: cord and stere. The cord is used in North America and is defined as a unit of measure of stacked wood, occupying a space of 3.63 m3 (128 ft3), while stere is used in regions outside North America and is defined as a unit of measure of stacked wood occupying the space of 1 m3. The dimension of the stacked wood shows differences between the countries. The widely used stacked length is 1, 2, and 3 meters in Europe and 2.44 m (8 ft) in North America (Pásztory et al. 2019). Also, the suggested stack height in Europe is no more than 3 m to produce lower error in the stack height measurements (Kärhä et al. 2019) because these factors impact the accuracy of the stack volume measurement.
Solid wood content can be determined as the actual round wood volume by summating the volume from each measured log in the stack. This method (called manual or traditional), measuring the logs one-by-one, is the most accurate technique. However, it is not feasible, especially for huge volumes of round wood purchases due to time and cost (Fonseca 2005, de Miguel-Díez et al. 2021). Hence, solid wood volume (i.e., net volume) is estimated from stack wood volume by multiplying with a conversion factor, which depends on tree species, the assortment length, the bark thickness, and wood defects (Fonseca 2005, Berendt et al. 2021). The solid wood volume in the stack ranges between 50% and 80% depending on some factors, including but not limited to the size of the log, bark condition, branchiness and limping of logs, crookedness, tightness of the stacking, and shape of the logs, and taper amount. It is suggested to use log types specified solid wood conversion factor for estimating the solid wood content (Fonseca 2005, van Laar and Akça 2007).
As an alternative to conventional methods, thanks to technological developments, automatic methods have offered innovative solutions to the markets (Pásztory et al. 2019). These methods are composed of computational and technical backgrounds. For example, electro-mechanical harvesting technology (harvester measurement) has been used as one of the earliest automatic measurement techniques in the estimation of the solid wood content in the stack. In this technique, the harvester unit includes a measurement device that measures the diameter and length of each log during the harvesting process and registers the data automatically. However, this method also requires continuous calibration of the systems depending on log conditions to acquire valid data. Many studies have been conducted to evaluate the accuracy of the harvester measurement (including diameter, length, volume, and position of the log) worldwide (i.e., Europe, North America, New Zealand, and Australia) (Moller 1998, Anderson and Dyson 2002, Murphy et al. 2005, Murphy et al. 2006, Rasinmäki and Melkas 2006, Leitner et al. 2014, Pásztory et al. 2018, Noordermeer et al. 2022). The studies mainly showed that, with properly calibrated harvesters, the error of the harvester measurements for log diameter, length, and volume are not worse than traditional standing tree inventory. Some European countries, particularly Germany and the Czech Republic, have partially used this measurement method for a long time but are not allowed to use the system legally for billing purposes (Hohmann et al. 2017).
Another automatic method for measuring stack volume relies on modern image-based techniques using photogrammetry and 3D reconstruction. For example, the solid wood volume of logs in piles (Kruglov and Chiryshev 2017) and trucks (Sosa et al. 2015, Acuna and Sosa 2019) were measured using multi-view photogrammetry and 3D reconstruction. The results of these studies demonstrated a great potential for operational implementation of these techniques in forestry. With the development and improvement in technology, photo-optical measurement systems have also become more popular in many disciplines, such as automatic inspection, robot, and process guidance industry, or security monitoring (Snyder and Qi 2010, Davies 2012, Kärhä et al. 2019, de Miguel-Díez et al. 2021). This method includes image and signal processing, machine vision, analysis, and modeling (Snyder and Qi 2010, Davies 2012, Kärhä et al. 2019). Recently, the machine vision-based photo-optical method has been integrated into forestry to measure the stack volume. In this method, a mobile system, usually a smartphone or a tablet, uses its standard camera along with the apps to capture the images of each stack. Then, the processing of the images, using statistical image analysis methods in Hue, Saturation, and Value (HSV) colors (Pásztory and Polgár 2016), is performed within the app automatically. Thus, with the automatically processed image, every single log in the stack can be detected to measure some of the stack parameters (i.e., the diameter of every single log, mean diameter of the stack, number of trees, and volume). Several commercial mobile measuring applications, including but not limited to AFoRS, LogStackPRO, LogStackLIDAR, iFovea Pro, Logsize, sScale, Timbeter, and Trestima Stack, have been developed and are now being used by large forest companies in the European markets. These listed applications (apps) are mobile tools for smartphones and tablet devices, except sScale. These apps often require references, such as a stick or manual measurement of stack length, for scaling and calculating stack parameters (i.e., mean diameter of the stack, stack volume).
The continuous improvements in mobile phone cameras and apps and the integration of advanced technologies into mobile phones, such as LiDAR (Light Detection and Ranging) technology and Augmented Reality (AR), increase the demands for the use of these applications in forestry. Many studies have been conducted to examine the accuracy and efficiency of using mobile photo-optical stack measurement apps, especially in Europe. The study by Kärhä et al. (2019) was conducted to determine the accuracy and time consumption of a mobile machine vision application (Trestima Stack app) in measuring log stacks in Finland. In total, 60 log stacks were measured, 32 being in terminal and intermediate yard, and 28 in roadside landing. The result of the study indicated that the overall accuracy of log stack volume from the app was +2.7%. The result was better in terminal yards (+0.7%) than that obtained by the conventional stack volume measurement method. However, there was a statistically significant difference between these two methods. The average effective total measurement time consumption for the app was less than that of the conventional method. Berendt et al. (2021) also examined the reliability of photo-optical measurements of log stack gross volume using the iFovea app and found that the photo-optical measurement app provided similar results as conventional methods in larger log stacks. Jodłowski et al. (2016) and Dietz et al. (2019) tested many photo-optical applications and systems measuring log piles volume. The findings pointed out that all tested apps and systems are user-friendly and produce satisfying results compared to the conventional method. Moreover, Borz at al. (2022) conducted a study to test LiDAR-embedded mobile app in log measurements and their results pointed out that phone-based photo-optical log measurements have a high potential for replacing the traditional log measurements.
In Turkey, the stack volume measurement units stated as stere are only used for round wood. It generally means split wood used for fuelwood and some specialty products (DBH <18 cm), including fuelwood, pulpwood, fiber-chip wood, other industrial wood and thin pole (OGM 2019). The dimensions of the stacked wood for the stere unit in Turkey could show differences compared to Europe. Instead of dividing the stack into sections for measuring the volume, the wood stack is prepared using a 1 m (length) x 1 m (width) x 1.05 m (height) section at the beginning. Then, the measured stack volume as stere is converted to the cubic meter by multiplying the conversion factor (0.75) for estimating solid round wood volume in the stack (OGM 2015). Besides, the most common measuring method for solid wood volume in the stack is the one-by-one log measurement in Turkey. The dimension of stacked wood is similar to that used in Europe. The length is 1.5, 2.5, and 5 meters but can change based on the demands of the markets. Also, round wood can be stacked based on the quality, DBH class, length, or product types (i.e., log, mine pole, pole, wooden pole, industrial wood, pulpwood, and fiber-chip wood). According to the Forest Production and Marketing Department under the General Directorate of Forestry (OGM 2019), standard solid wood volume measurement in the stack is performed with one-by-one log measurement method. In general, the middle DBH of every single log in the stack is measured by operators, and solid wood volume in the stack is estimated using the empirical formula, Huber formula being widely used. Another empirical formula called the Smalian formula, requiring top and bottom DBH measurement of the log, can be used to measure solid wood volume in the stack. Thus, studies were conducted to evaluate these volume formulas for accurate and precise volume estimation (Carus 2002, Özçelik 2006, Durkaya and Durkaya 2011).
Although these conventional methods for measuring solid round wood volume in the stack offer accurate inventory, it is not time and cost-efficient. In the course of the fast digitalization process in forestry, new approaches have been tested in a limited number of studies in Turkey. For example, Eker and Aydin (2020) used UAV-based images to measure stack volume in forest enterprise depots. The round wood volume in the stack was estimated from the 3D model of the pile that was generated from the combination of UAV-based images and the Structure from Motion (SfM) algorithm. The findings pointed out that the estimated volume for round wood from UAV-based images was relatively similar to recorded stacked measurements, calculated by the conventional method (one-by-one log measurement method).
The increase in digitization integrates Industry 4.0 into forestry practices. Many applications have been developed for wood supply chains worldwide, including remote sensing data in forest inventory, harvest planning and operation, transport and logistics of logs, the use of machine vision and the Internet of the things for data generation, information flows, and monitoring goods and services (Muller et al. 2019, Kemmerer and Labelle 2020). For example, the machine vision mobile photo-optical stack measurements app is an attractive alternative to manual measurement and is widely used in European forestry. The concept of Forestry 4.0 has begun to integrate into the wood supply chain in Turkish forestry practices, as well. For example, recently, OGM, the only government agency authorized to manage forest areas in Turkey, has started to use the barcode application, which allows buyers to monitor logs from the forest stands to the final destinations in some pilot areas. Based on the feedback from the users and buyers, the barcode application will have the potential to be more common for forestry practices in Turkey due to its ease of use, along with its time and cost-effectiveness. However, these kinds of innovative applications require continual research and examination. Hence, the aim of this study was to evaluate the usability of the machine vision photo-optical measurement method for measuring solid wood volume in the stack in the forest enterprise depot (terminal yards) compared to the conventional measurement method. It will help to understand how these existing apps are suitable for the volume measurements or how they need to be adjusted for the wood supply chain in Turkish forestry.
2. Materials and Methods
2.1 Data of the Study
For this study, in total, 21 log stacks were measured at a forest enterprise depot which belongs to Kemalpasa Forest Enterprise unit located in the eastern part of Regional Forest Directorate of Izmir, Turkey (Fig. 1). The measured stacks comprised logs, industrial wood, and pulpwood of only softwood tree species, including (14) Turkish red pine (Pinus brutia) and (7) European black pine (Pinus nigra). These wood products in the stacks are classified based on the diameter, quality, height, tree species, and demand of the markets.
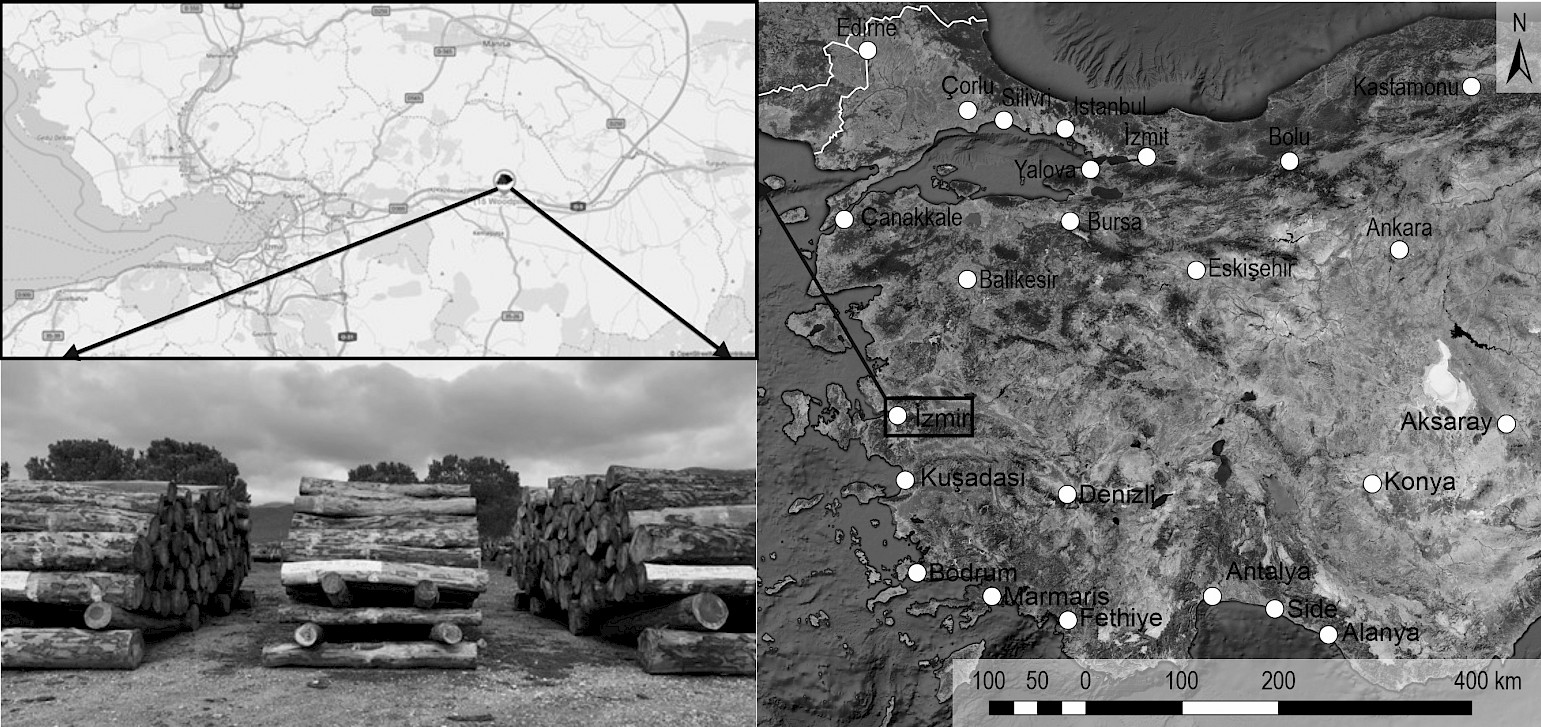
Fig. 1 Location of the study area and map view of the forest enterprise depot (terminal yard) from iFovea Pro app
2.2 Measuring the Stack with Conventional Methods
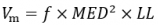
In Turkey, the stacks in the forest enterprise depot are generally composed of logs (without bark), piled parallel to each other based on similar parameters such as tree species, length, quality, product types, and diameters. The volume (Vm) of the stacks was measured all year around (January 2021 – December 2021) at the depot based on the code by Forest Production and Marketing Department under the General Directorate of Forestry. According to the code, standard solid wood volume measurement in the stack is performed with the conventional measurement method that measures logs in the stack one-by-one. First, the middle DBH of every single log in the stack is measured by forestry workers, and then solid wood volume in the stack is estimated using the Huber formula (Briggs 1994):
 (1)
(1)
Where:
ƒ 0.00007854 for metric units (cubic meters)
MED diameter from the middle of the log
LL length of log.
Also, number of trees, length of the log (divided into two classes: short (1.25 – 2.5 m) and long (>2.5 m – 5 m)), quality, diameter class (divided into two classes: thin or thick) and product types were recorded during conventional stack logs measurements. In this study, the total solid wood volume without bark (later: m3), number of log (NoL), and mean diameter (MD) (cm) of the stack obtained from the records of Kemalpasa Forest enterprise depot were used as reference data. Some of the logs in the stack were piled in different directions, and the cameras did not capture them. Therefore, these logs were subtracted from reference data and the reference data were corrected. The reference data volume was also recalculated using the mean diameter and number of the logs laid diagonally.
2.3 Measuring the Stack with Photo-Optical Stack Measurements Apps
The measurement of the stack was performed with two widespread photo-optical apps: iFovea Pro version 2.5.2 and Timbeter version 3.0. Both apps show similarities in the estimation of the stack volume due to using machine vision technique, but there are some differences in the application procedure of the apps. Also, these two apps are not free, but both provide free use for a limited time. Three people performed the measurements in the depot. Two of them used mobile apps; the third person only helped to measure stack length and take notes related to the study. The two people, who used apps for the measurements, have had experience with conducting similar studies on tree measurement using close-range photogrammetry, LiDAR, and mobile apps. Before starting the stack measurement study, these two people conducted a test measurement for training purposes to make sure about the procedure. Also, each person used the same mobile app during the entire measurement process.
iFovea Pro is a machine vision-based mobile app developed by German technology (SDP Digitale Produkte GmbH) for measuring the volume of logs stack from the images taken by smartphone or tablet devices (https://www.fovea.eu/). In this study, the iFovea Pro app was employed within an iPhone X (Apple Inc.), which contains a 12-megapixel rear camera system equipped with dual optical image stabilization and a 14.7 cm (5.8 inches) super retina display. Overlapped photos of the front of the log stacks were taken and then combined to create a single image of the stack. In the calculation of the log volume within a stack, the app allows to use images taken from both side of the stacks, but in our study, the stacks in forest enterprise depot (terminal yards) were arranged so close to each other that it was impossible to capture the photos from both sides of the stack (Fig. 1). Therefore, the images obtained from the single available side of the stacks were used to calculate the log volume.
For achieving optimal results, the instructions developed by the company were followed. According to that, the photos were taken at approximately 2 to 4 m distance from the log stack with at least 60% overlap and the log stack height needed to cover 85% of the photo height. In addition, the user manuals of the app provide detailed information related to photo-optical measurements and functions of the app (i.e., holding position of the device, lightning conditions and adjustment, woodpile dimensions). Fig. 2a shows accurate photo capturing with 60% overlap. After the image-taking process was completed, the length and depth of the stack were measured manually and recorded to the app for scaling and estimating the volume. The solid wood volume in the stack can be estimated by defining contour of the stack front automatically or detecting diameter of every single log. For this study, the latter option was used to allow user to detect every single log and extract diameter for each of them (Fig. 2b). The iFovea Pro app offers three methods (Cylinder, Polish and Japanese) for calculating solid wood volume of the log within the stack. The cylindrical method is suggested for the cases where logs have been stacked with mixed ends. Also, it is the dominant method used in most of the European continent (https://www.timbeter.com). Thus, the cylindrical method was employed in iFovea Pro app to calculate net solid wood volume without bark within the stack. Moreover, the app also enables users to report the number of logs within the stack, average diameter, classified volume based on quality, tree species, and diameter class.
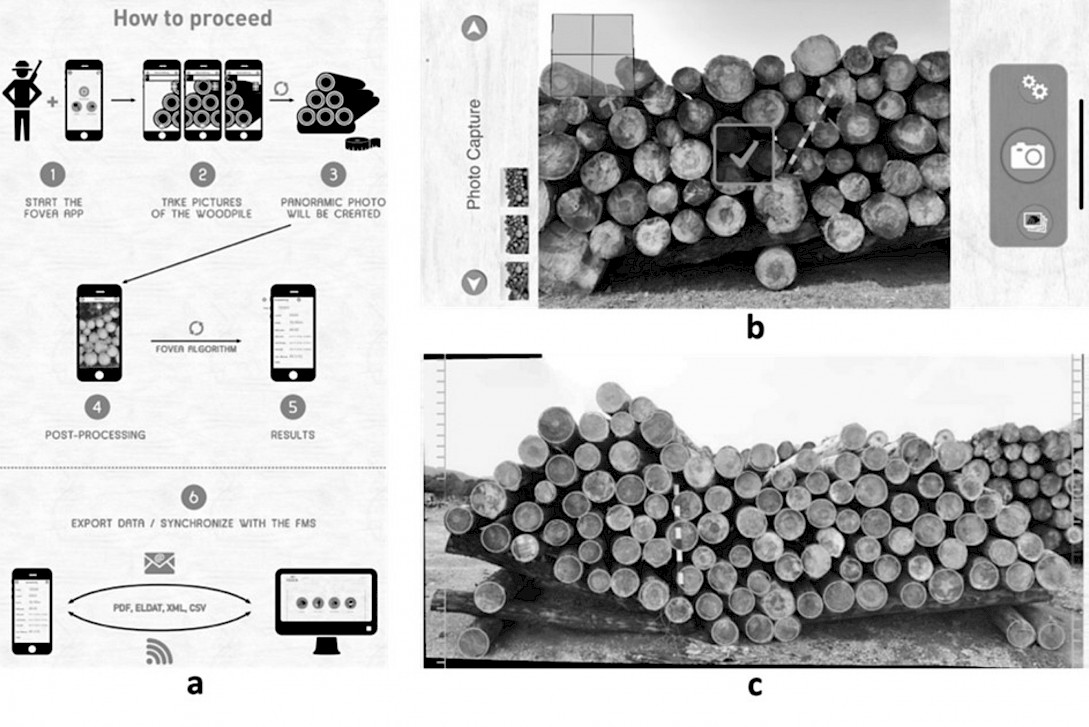
Fig. 2 Flowchart of iFovea Pro mobile app and view of the app during measurement (Fovea 2021)
Another machine vision-based mobile app, called Timbeter, was used to estimate solid wood volume of log within the stack. The Timbeter app was developed by the Green ICT program (Norway – Estonia) as a digital log measurement tool that uses machine learning technology and artificial intelligence for accurately detecting and measuring the log in the stack (https://timbeter.com/). The app was downloaded and installed on a Nokia 8 smartphone with a 13 MP camera. In general, the Timbeter app has a similar procedure as iFovea Pro in image taking process. The photos were taken from one side of the log stacks with at least 60% overlapping, then combined into one panoramic image. Alternatively, the Timbeter offers an automated panoramic mode option for calculating the solid wood volume of the log within the stack. The Timbeter requires the use of a 1 m scaling stick, which should be positioned as in Fig. 3. In this study, a 1 m stick was used with yellow and brown colors in each 10 cm section. As in iFovea Pro app, after capturing the photo of the entire stack, every single log was detected automatically, and then the diameter of the logs was determined. The Timbeter offers ten methods to the users for volume estimation. In this study, the cylindrical method was selected to calculate net solid wood volume of the stack without bark as in the iFovea Pro app. In addition, the number of trees and average diameter of the stack were recorded automatically and will be used in the evaluation of the methods.
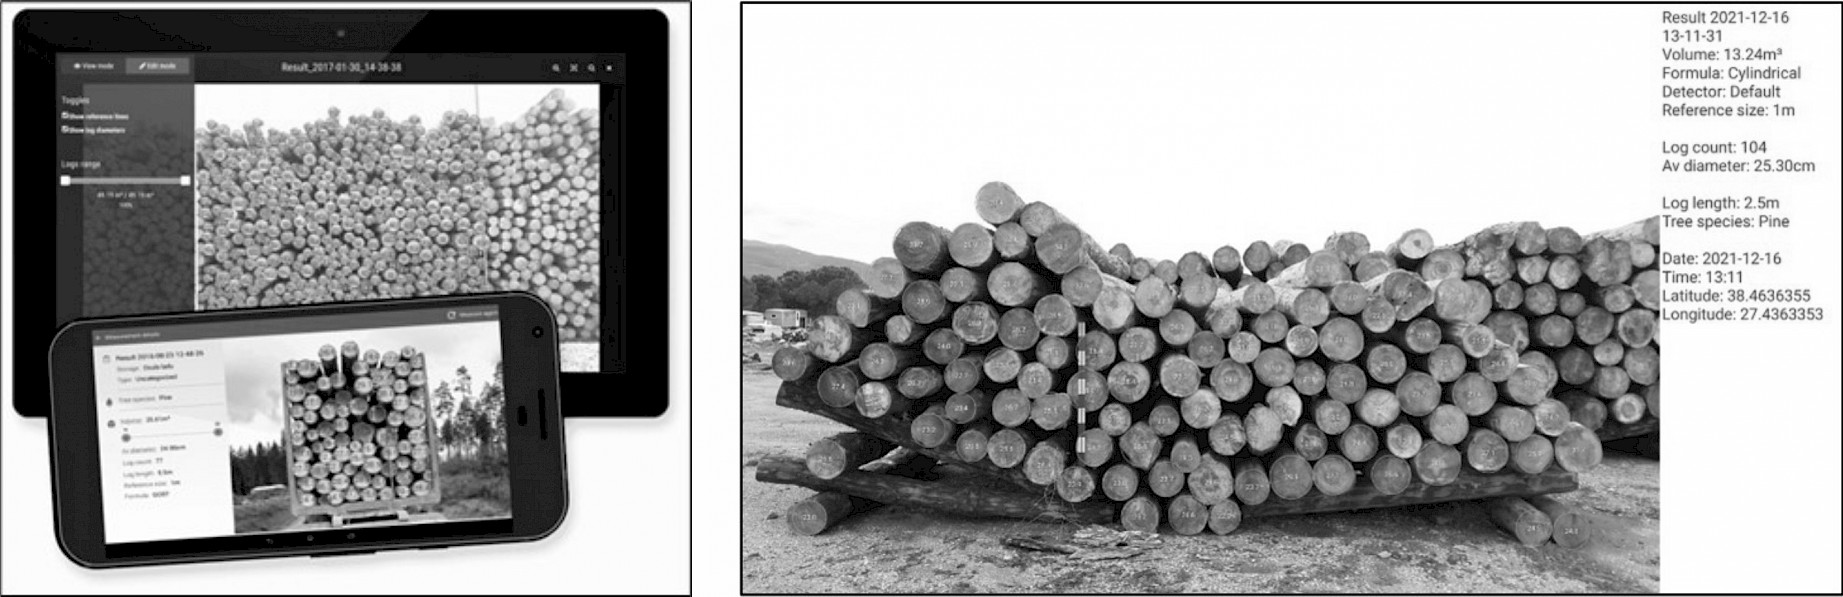
Fig. 3 View of Timbeter mobile app and view of the app during measurement (Timbeter 2021)
Both apps allow users to post process data, which is necessary to avoid common mistakes, such as false- or non-detected logs. For example, due to color of the wood, diameter of the log can be detected smaller or bigger, or the app can incorrectly mark the logs from a second wood stack in the background. With post processing, diameter circle can be adjusted (i.e., delete, add, move circle or increase/decrease circle size), and incorrectly marked logs can be removed. According to a study by Boberg and Lilja (2016), adjusted data with post processing was significantly different than unadjusted data. Thus, before the volume estimation, post process (adjust the data) was applied in this study. Also, the apps can synchronize the result with Forest Management System (FMS) cloud that is a free and online platform, including maps and accounting functions.
2.4 Evaluating Automatic Extraction of Log Diameter by Mobile Photo-Optical Apps
The primary purpose of the study was to compare the net solid wood volume of the logs and the number of trees within stacks, and the mean diameter of each stack, which were obtained by using two machine vision-based mobile apps (iFovea Pro and Timbeter) and conventional method. However, the reference volume was calculated using middle diameter of the log, while both apps used the diameter from one side of the log for volume estimation of the stack. Using diameter obtained from a different part of the logs might cause a difference in comparison of volume estimation. Therefore, the diameters of randomly selected 50 trees from the 21 log stacks were measured manually on a diagonal way twice. Then, the calculated average value from these two measurements for each log was compared to the log diameters extracted automatically by using both mobile apps (iFovea Pro and Timbeter).
2.5 Statistical Analyses
A repeated-measures ANOVA (Analysis of variance) was used to examine the effects of measurement techniques on the stack-level parameters (including the number of trees, volume, and mean diameters) and randomly measured diameters of fifty trees within the measured stacks. A repeated ANOVA method tests the equality of means of the more than two groups to determine whether at least one group is statistically different from the others, as with any ANOVA method. However, repeated-measures approaches are used when numerous measurements are made on the same subjects over time or when all measurement are performed under different conditions (Hill and Lewicki 2006). In this study, 21 log stacks and diameter of 50 individual trees within these stacks were measured using three different devices. Also, this approach is not restricted by the homogeneity of variance assumption of ANOVA if the assumption of normality and independence are met. Instead of assumption of homogeneity of variance, sphericity or circularity assumptions must be met in repeated measures approach when applying the test. If the sphericity assumption is not met, various corrections can be employed to produce a valid F-ratio.
In this study, we first tested whether each set of mobile photo-optical stack measurement apps (Timbeter and iFovea) and traditional (one-by-one log) measurements for stack parameters, including the number of logs (NoL) in the sctaks, Volume (V) and mean diameter of stacks (MD), were normally distributed. Also, normality of randomly measured diameters of fifty trees within the measured stacks was checked. According to Kolmogorov-Smirnov, Shapiro-Wilk, Skewness and Kurtosis tests, and Histogram and Q-Q plots, sets of measurements for the number of trees and volume were normally distributed, while mean diameter and randomly measured diameters of fifty trees within the measured stacks were not normally distributed. The ANOVA test is not affected by violations of normality when working with large samples. The ANOVA test produces highly accurate p-values in violation of normality even when the sample size of each group is reduced to 15 (Green and Salkind 2014). For normally distributed stack parameters (NoL and V), repeated measures ANOVA was applied after testing if the condition of the sphericity was met using Mauchly's test in SPSS. For the mean diameter and randomly measured diameters of fifty trees measurements, which did not meet the normality assumption, Friedman test was used as a nonparametric alternative for a repeated-measures ANOVA. Using the repeated-measures ANOVA and Friedman tests, the following hypotheses were tested:
H0: There is no difference between the parameters measured with different approaches (Timbeter, iFovea and Traditional)
Ha: There is a difference between the parameters measured with different approaches (Timbeter, iFovea and Traditional)
If the null hypothesis is rejected, post-hoc comparisons (Bonferroni for repeated measures ANOVA test and Wilcoxon signed rank test for Friedman test) were used to examine the statistical significance of the differences between means of measurement approaches.
3. Results
3.1 Results of Stack Volume Measurements with Mobile Photo-Optical Apps
Table 1 shows the summary of the statistic for the number of logs (NoL), volume (V, m3), and mean diameter of the stack (MD, cm) estimated for 21 log stacks. The NoL in stacks estimated using both mobile apps produced almost the same results with reference data in every measured stack, except stack 14 and 16, in which both apps did not estimate correctly, and stack 18, where iFovea Pro did not count accurately. The mean volume and mean diameter of the analyzed log stacks suggested that the solid wood volume in the stacks and mean diameter of the stacks estimated using both Timbeter and iFovea Pro were smaller than the reference solid wood volume and mean diameter of the stacks. Also, it seems that the mean volume and mean diameter of stacks estimated using the Timbeter mobile app produced values closer to the reference mean volume and mean diameter of the stacks.
Table 1 Summary statistics of number of log (NoL), volume (V, m3), and mead diameter of the stack (MD, cm) from 21 log stacks
|
Stack Number |
Number of Log (NoL) |
Volume, m3 |
Mean Diameter, cm |
||||||
|
Ref. |
Timbeter |
iFovea Pro |
Ref. |
Timbeter |
iFovea Pro |
Ref. |
Timbeter |
iFovea Pro |
|
|
1 |
295 |
295 |
295 |
36.90 |
44.27 |
37.31 |
25.24 |
27.33 |
25.00 |
|
2 |
97 |
97 |
97 |
37.54 |
40.19 |
37.06 |
44.40 |
44.40 |
42.00 |
|
3 |
9 |
9 |
9 |
4.46 |
5.33 |
4.93 |
35.53 |
37.67 |
37.00 |
|
4 |
281 |
281 |
281 |
33.67 |
34.47 |
31.56 |
24.70 |
24.66 |
24.00 |
|
5 |
156 |
156 |
156 |
23.50 |
21.88 |
22.03 |
39.17 |
35.67 |
36.00 |
|
6 |
90 |
90 |
90 |
30.24 |
26.76 |
28.04 |
41.36 |
38.19 |
39.00 |
|
7 |
101 |
101 |
101 |
12.17 |
10.35 |
10.24 |
35.04 |
30.89 |
31.00 |
|
8 |
104 |
104 |
104 |
13.92 |
13.28 |
12.76 |
26.11 |
25.34 |
25.00 |
|
9 |
141 |
141 |
141 |
51.68 |
50.88 |
46.78 |
43.21 |
41.30 |
40.00 |
|
10 |
192 |
192 |
192 |
32.78 |
30.28 |
29.19 |
41.70 |
38.26 |
37.00 |
|
11 |
91 |
91 |
91 |
27.23 |
25.78 |
22.13 |
39.04 |
37.43 |
34.00 |
|
12 |
141 |
141 |
141 |
44.12 |
42.50 |
38.92 |
39.92 |
38.59 |
37.00 |
|
13 |
421 |
421 |
421 |
35.78 |
31.59 |
29.41 |
29.42 |
26.70 |
26.00 |
|
14 |
214 |
212 |
212 |
31.26 |
27.89 |
25.16 |
38.58 |
35.00 |
33.00 |
|
15 |
152 |
152 |
152 |
46.27 |
44.23 |
38.46 |
39.38 |
37.90 |
35.00 |
|
16 |
286 |
287 |
287 |
38.35 |
38.80 |
34.76 |
26.13 |
25.90 |
25.00 |
|
17 |
35 |
35 |
35 |
9.16 |
9.29 |
8.37 |
36.51 |
36.10 |
34.00 |
|
18 |
316 |
316 |
315 |
40.42 |
37.08 |
36.69 |
25.52 |
24.10 |
24.00 |
|
19 |
146 |
146 |
146 |
58.75 |
42.51 |
47.22 |
45.27 |
37.50 |
40.00 |
|
20 |
190 |
190 |
190 |
46.81 |
47.03 |
41.32 |
35.42 |
34.20 |
32.00 |
|
21 |
41 |
41 |
41 |
10.97 |
12.56 |
11.13 |
36.92 |
37.90 |
36.00 |
Also, when reference measurements of NoL, V, and MD were compared to the estimated measurements of NoL, V, and MD obtained by Timbeter and the iFovea Pro, the slopes ranged between 0.84 and 1 and R2 ranged between 0.89 and 1 (Fig. 4). Also, it seems that the mean volume and mean diameter of stacks estimated using the Timbeter mobile app produced values closer to the reference mean volume and mean diameter of the stacks. On the other hand, the iFovea Pro app had smaller variation and error for NoL, V, and MD measurements compared to the results from the Timbeter app and conventional method.
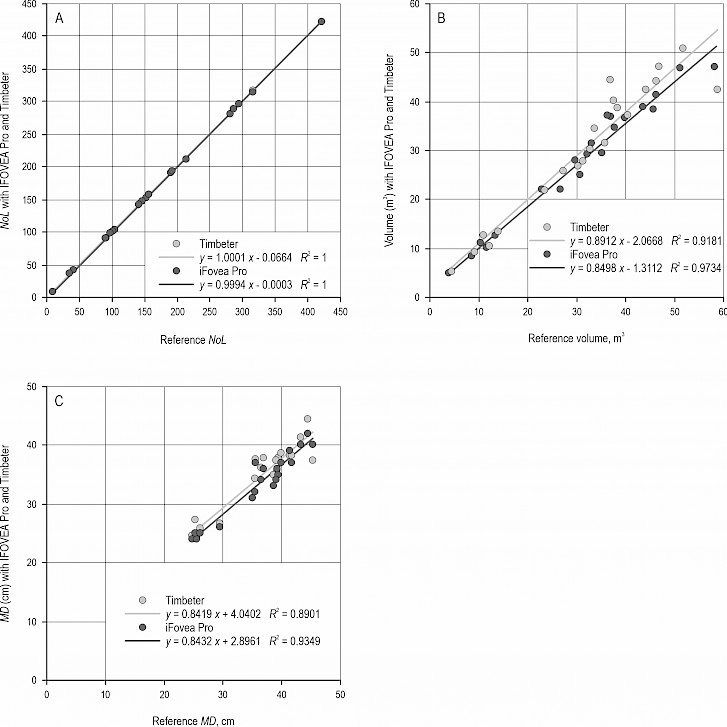
Fig. 4 NoL (A), Volume (B) and MD (C) comparison between reference data, Timbeter and iFovea Pro
3.2 Results of Statistical Analyses
Based on the repeated measures ANOVA test results, the Sphericity assumption was met (p>0.05) for NoL, and there was no significant difference between the measurements obtained from two different mobile photo-optical apps and conventional techniques (p-value: 0.534 or p>0.05). For the volume estimation, the Sphericity assumption was not met (p<0.05). Thus, the Greenhouse-Geisser row in Tests of Within-Subjects Effects was used (p<0.05). The null hypothesis was rejected, and a significant difference was observed between calculated solid wood volume in the stack using mobile photo-optical apps and conventional techniques. Therefore, a post-hoc (Bonferroni) test was performed to examine which set of estimated volumes was significantly different. When examining Bonferroni pairwise comparison, no significant difference was observed between reference volume and volume calculated using the Timbeter app. However, a significant difference was observed between reference volume and volume estimated with iFovea Pro, and estimated volume using Timbeter and estimated volume using iFovea Pro.
For the comparison of mean diameter (MD) measurements within 21 stacks, the Friedman test, a nonparametric alternative for a repeated-measures ANOVA, was performed because the normality assumption was not met. The test result showed that at least one of the measurement approaches was different (measurements from two mobile photo-optical apps and reference data). Hence, a post-hoc test (Wilcoxon signed-rank test) was performed to examine which pair was statistically different between measurement approaches. It was found that MD measured using mobile photo-optical apps and traditional methods were significantly different from each other (p<0.05).
3.3 Results of Automatic Extraction of Log Diameter by Mobile Photo-Optical Apps
The mean diameter of randomly selected fifty trees in section 2.4, measured with two mobile photo-optical apps and the traditional technique, was compared. In Turkish forestry, the middle diameter of the log is used to calculate solid wood volume in the stack (reference volume). However, photo-optical apps use one side end diameter of the log in volume calculation. Hence, we wanted to evaluate whether volume difference between mobile app measurement and reference data could be due to the diameter. The mean diameter of randomly selected fifty trees were 29.09 cm, 29.65 cm, and 28.92 cm for reference, Timbeter and iFovea Pro measurement, respectively. The results of reference measurement and Timbeter were relatively comparable (SE was 1.63 for reference measurement and 1.64 for Timbeter measurement). Notably, the iFovea Pro app produced smaller variation and error (SD: 1.53 cm) compared to the other two measurements of 21 log stacks. Similar to the mean diameter (MD) comparison, the Friedman test was performed due to not meeting the normality assumption. However, the results indicated that there is no difference between the three measurement approaches (p>0.05).
4. Discussion and Conclusion
Accurate and fast solid wood volume estimation in the stack is of the highest importance in forest inventory due to its direct relation to log pricing. Thus, this study aimed to evaluate the usability of machine-vision-based photo-optical mobile apps for measuring solid wood volume in the stack in Turkish forestry practices as a more practical and affordable alternative to conventional volume measurements of the log in the stack. For this study, 21 log stacks were measured in total using the traditional technique (one-by-one log measurement) and two photo-optical mobile apps – iFovea Pro and Timbeter. The results of the study showed that there is a strong correlation between the traditionally measured solid wood volume of the stack and the volume estimated using both photo-optical apps (iFovea Pro and Timbeter). These findings are similar to the recent Cremer et al. (2020) study, where the photo-optical measurements app (iFovea) produced comparable results with manual measurements of stack volume in Germany.
Also, the statistical test result from comparing solid wood volume measurements of the stack using traditional and photo-optical apps techniques indicated mixed results. No significant difference was observed between the volume estimated with the Timbeter app, and the volume measured manually (reference data). In contrast, the estimated stack volume obtained from the iFovea Pro app is statistically different from the reference volume and the volume estimated with the Timbeter app. This difference could be related to features of the apps even though the two apps have quite similar interfaces and show similarities in the process of estimation of solid wood volume in the stack, starting from the image-taking process to reporting the results. However, iFovea Pro does not allow users to make the decimal measurements, which can affect the accurate and precise estimation of solid wood volume in the stack.
Although the researchers cautiously followed the instruction of the app user manual for image taking process, used the same volume estimation formula (cylindrical) along with the conversion factor, and chose the same or similar quality class for the stack to avoid bias between the two apps, the use of two different smartphones that have different camera features might have an indirect impact on volume estimation. For instance, the distance to wood piles might vary due to the camera angle. Boberg and Lilja (2016) noted in their study that the distance to log piles affects the accuracy of the solid wood volume estimation in the stack when using a photo-optical measurement app (Timbeter).
Additionally, external factors such as weather and light conditions might affect the accuracy of the measurements due to shadows or darkness on the bottom of the log, which may cause wrong detection or measurement of diameter. Although our study did not focus on which factor has an impact on the accuracy of the measurement, the data were collected in similar environmental conditions considering weather and light conditions (Acuna and Sosa 2019, Pásztory et al. 2019, Berendt et al. 2020). On the other hand, Berendt et al. (2020) evaluated the impact of factors (weather, light conditions, tree species, and stack length and quality) that affect the accuracy of the photo-optical measurements. The findings showed that weather and light conditions did not significantly impact the stack volume estimation accuracy measured with the mobile apps. In contrast, log stack length, quality, and tree species significantly affect the accuracy of volume estimation. Hence, the observed large deviation in volume estimation in this study (i.e., stack 19, 18, 14, and 9) might be due to log stack quality because these stacks were classified as pulpwood, using the lowest quality logs.
Moreover, the number and diameter of the log within the stack estimated by traditional methods and photo-optical mobile apps were compared to understand how accurately the apps determined the boundary of the wood piles and diameter of every single log, directly related to volume estimation. Many studies (i.e., Lepoglavec et al. 2019, Cremer et al. 2020, Berendt et al. 2021) evaluated the use of the photo-optical apps for volume estimation of the log stack, but they did not test how accurately these two parameters were estimated by using the photo-optical apps. Our findings showed that the NoL estimated with iFovea Pro and Timbeter apps were almost the same as the reference data. Although MD estimated using mobile photo-optical apps was highly correlated with MD estimated with the traditional method, statistical test results pointed out a significant difference in measurement of MD between using mobile photo-optical apps and traditional techniques. The difference might be related to the human-caused error, such as wrong tape reading, missing some of the logs within the stacks, or using diameter reading from different log parts in photo-optical techniques. For example, for reference data, MD is calculated from the diameter measured from the middle of the log. However, both photo-optical apps have used the diameter obtained from the image of one side of the log to calculate the MD. It was further analyzed whether variation in volume estimation between reference and photo-optical app measurement could be related to inaccurate diameter measurement obtained by the photo-optical mobile app. Therefore, the diameter of the randomly selected fifty logs, measured with the traditional method and two photo-optical mobile apps (iFovea Pro and Timebeter), was compared. In contrast to MD, the results showed no difference between the three measurement methods (reference, iFovea Pro and Timbeter).
In general, it was observed that both photo-optical mobile apps (iFovea Pro and Timbeter) underestimated the mean solid wood volume in the stack compared to the reference volume obtained by the traditional measurement method. On the other hand, it was noted that the estimated solid wood volume of the logs in the stack using the iFovea Pro and Timebeter mobile apps was highly correlated with reference volume. Also, the results of the Timbeter app showed no statistical difference from the reference volume. The results were quite similar to previous studies that indicated that the volume estimated using photo-optical mobile apps was compatible with traditional stack volume measurement technique (reference data) (Jodlowski et al. 2016, Dietz et al. 2019, Kärhä et al. 2019, Cremer et al. 2020, Berendt et al. 2021). Although time consumption in the stack measurement was not compared in this study, it was clearly observed that measuring the largest stack took about less than 10 minutes, including data adjustment.
With technological development, this kind of machine vision-based mobile app use has increased due to being easy to use and handy, providing accurate and fast results, and requiring less time and cost. Thus, many European countries have used these mobile apps in forestry practices. With this study, it was evaluated whether photo-optical mobile apps can be considered for estimating solid wood volume of the stack in Turkey. The results are promising, but further analysis needs to be conducted, such as estimating stack volume using the image from both sides of the logs and testing mobile apps in different quality and diameter classes with bark conditions. Also, these two apps have been developed based on the conditions of European forestry. If it is considered to use these apps in Turkish forestry practices, it might be recommended to modify some of the app interfaces.
Acknowledgements
We would like to thank the personnel of the Regional Forest Directorate of Izmir and the Kemalpasa Forest Enterprise depot for giving us the precious opportunity to conduct this study and providing resources to investigate. We would also like to thank Timbeter company for allowing us to use the app for free during our study. Most importantly, we thank Dr. Mehmet Demirci and Kamber Can Alkiş for helping us while taking pictures of the stack in the depot. Last but not least, our appreciation is sent to the reviewers.
5. References
Acuna, M., Sosa, A., 2019: Automated volumetric measurements of truckloads through multi-view photogrammetry and 3D reconstruction software. Croat. J. For. Eng. 40(1): 151–162.
Anderson, B., Dyson, P., 2002: Evaluating the measuring accuracy of harvesters and processors. Forest Engineering Research Institute of Canada, Vancouver, BC, Canada, Advantage 3(4): 1–19.
Berendt, F., Wolfgramm, F., Cremer, T., 2021: Reliability of photo-optical measurements of log stack gross volume. Silva Fenn. 55(3): 10555. https://doi.org/10.14214/sf.10555
Boberg, A., Lilja, J., 2016: Precision of pile-measurement of roundwood with photographic technology applied in smartphones. MSc Thesis, SLU, Faculty of Forestry, Umea, Sweden, 1–33 p.
Briggs, D.G., 1994: Forest products measurement and conversion factors: with special emphasis on the U.S. Pacific Northwest. College of Forest Resources, University of Washington, Seattle, WA, 1–153.
Carus, S., 2002: Comparison of some volume formulas regarding the stem, segments and fractions of the stem. Turk. J. Agric. and For. 3(1): 101–114.
Cremer, T., Berendt, F., Diez, F.D.M., Wolfgramm, F., Blasko. L., 2020: Accuracy of photo-optical measurement of wood piles. Environ. Sci. Proc. 3(1): 90. https://doi.org/10.3390/IECF2020-08192
Davies, E.R., 2012: Computer and Machine Vision: Theory, Algorithms, Practicalities, 4th ed.; Academic Press, Waltham, USA, 1–871 p.
de Miguel-Díez, F., Tolosana-Esteban, E., Purfürst, T., Cremer, T., 2021: Analysis of the influence that parameters crookedness and taper have on stack volume by using a 3D-simulation model of wood stacks. Forests 12(2): 238. https://doi.org/10.3390/f12020238
Dietz, H.U., Jensen, L., Seeling, U., 2019: Measuring log piles with Photo-optical Mono Camera Systems. Proceedings of the 52nd International Symposium on Forestry Mechanization (FORMEC) – Exceeding the Vision: Forest Mechanisation of the Future, October 6–9, Sopron, Hungary, 302.
Durkaya, B., Durkay, A., 2011: Comparing different volume formulas using log volume estimations. Bartın Orman Fakültesi Dergisi 13(20): 18–22.
Fonseca, M.A., 2005: The measurement of roundwood methodologies and conversion ratios. CABI Publishing, 1–269 p.
Fonseca, M.A., 2010: Forest Products Conversion Factors. In Nordic Wood Measurement Conference, 26–27 October, Drammen, Norway, 1–25 p.
Green, S.B., Salkind, N.J., 2013: Using SPSS for Windows and Macintosh: Analyzing and Understanding Data (Seventh Edition), Pearson, New Jersey, USA.
Fovea, 2021: Website. [accessed on 21 Dec 2021] Retrieved from https://www.fovea.eu/ifovea_pro_woodpile_measurement?language=en
Hill, T., Lewicki, P., 2006: Statistics: methods and applications: a comprehensive reference for science, industry, and data mining, 1st ed.; StatSoft, Inc. USA.
Hohmann, F., Ligocki, A., Frerichs, L., 2017: Harvester measuring system for trunk volume determination: comparison with the real trunk volume and applicability in the forest industry. Bulletin of the Transilvania University of Brasov, Series II, 59(10): 27–34.
Janák, K., 2005: Differences in volume of round timber caused by different determination methods. Drvna industrija 56(4): 165–170.
Jodłowski, K., Moskalik, T., Tomusiak, R., Sarzyński, W., 2016: Proceedings of the 49th International Symposium on Forestry Mechanization (FORMEC) – From Theory to Practice: Challenges for Forest Engineering, September 4–7, 2016, Warsaw, Poland, 306.
Kärhä, K., Nurmela, S., Karvonen, H., Kivinen, V.P., Melkas, T., Nieminen, M., 2019: Estimating the accuracy and time consumption of a mobile machine vision application in measuring timber stacks. Comput. Electron. Agric. 158: 167–182. https://doi.org/10.1016/j.compag.2019.01.040
Keepers, C.H., 1945: A New Method of Measuring the Actual Volume of Wood in Stacks. Journal of Forestry 43(1): 16–22. https://doi.org/10.1093/jof/43.1.16
Knyaz, V.A., Maksimov, A.A., 2014: Photogrammetric technique for timber stack volume control. The International Archives of the Photogrammetry, Remote Sensing and Spatial Information Sciences, Volume XL-3, ISPRS Technical Commission III Symposium, September 5–7, Zurich, Switzerland, 157–162 p.
Kruglov, A., Chiryshev, Y., 2017: The image analysis algorithm for the log pile photogrammetry measurement. WSEAS Trans. Signal Process. 13: 135–145.
Leitner, T., Stampfer, K., Visser, R., 2014: Analysing log length measurement accuracy of harvester and processor heads. Austrian J. For. Sci. 131(3): 129–146.
Melkas, T., 2018: Wood measuring methods used in Finland 2017. Metsätehon tuloskalvosarja 6b/2018, 1-13. [accessed on 21 May 2022] Retrieved from http://www.metsateho.fi/ wp-content/uploads/Tuloskalvosarja_2018_6b_Wood_measuring_methods_used_in_ 2017.pdf
Meyen, S., O'Connell, K., 2012: Stacked timber measurement. The 2012 ITGA Forestry & Timber Yearbook. Irish Timber Growers Ass., 50–56 p.
Mitrofonovs, I., Cekule, M., 2019: Effective Collaboration Research Project on IT Solution for Automatic Measurement of Timber Assortment. Syst. Cybern. Inf. 17(2): 78–83.
Orman Genel Müdürlüğü (OGM), 2015: Dikili Agac Satisi Esasları, Tamim No: 6877/A. Ankara, Turkiye.
Orman Genel Müdürlüğü (OGM), 2019: Oduna Dayali Orman Urunlerinin Uretim Islerine Ait Teblig, Teblig No: 310. Ankara, Turkiye.
Moller, J.J., 1998: Timber Mensuration by Harvester. Resultat – SkogForsk No. 16: 1–4.
Murphy, G.E., Marshall, H.D., Evanson, A.W., 2005: Production speed effects on log-making error ratesand value recovery for a mechanized processing operation in radiata pine in New Zealand. South. Afr. For. J. 204(1): 23–35. https://doi.org/10.2989/10295920509505224
Murphy, G., Wilson, I., Barr, B., 2006: Developing methods for pre-harvest inventories which use a harvester as the sampling tool. Austral. For. 69(1): 9–15. https://doi.org/10.1080/00049158.2006.10674982
Noordermeer, L., Næsset, E., Gobakken, T., 2022: Effects of harvester positioning errors on merchantable timber volume predicted and estimated from airborne laser scanner data in mature Norway spruce forests. Silva. Fenn. 56(1): 10608. https://doi.org/10.14214/sf.10608
Özçelik, R., 2006: Comparison of formulas for estimating volume in stacked logs. Turk. J. For. 7(1): 26–32.
Pásztory, Z., Heinzmann, B., Barbu, M.C., 2018: Manual and Automatic Volume Measuring Methods for Industrial Timber. IOP Conf. Series: Earth and Environmental Science 159(1): 012019. https://doi.org/10.1088/1755-1315/159/1/012019
Pásztory, Z., Heinzmann, B., Barbu, M.C., 2019: Сomparison of different stack measuring methods. Sib. J. For. Sci. 3: 5–13. https://doi.org/10.15372/SJFS20190301
Rasinmäki, J., Melkas, T., 2005: A method for estimating tree composition and volume using harvester data. Scand. J. Forest Res. 20(1): 85–95. https://doi.org/10.1080/02827580510008185
Remzi, E., Aydın, A., 2020: The use of Unmanned Aerial Vehicle (UAV) for Tracking Stock Movements in Forest Enterprise Depots. Eur. J. For. Eng. 6(2): 68–77. https://doi.org/10.33904/ejfe.835793
Sosa, A., Klvac, R., Coates, E., Kent, T., Devlin, G., 2015: Improving Log Loading Efficiency for Improved Sustainable Transport within the Irish Forest and Biomass Sectors. Sustainability 7(3): 3017–3030. https://doi.org/10.3390/su7033017
Snyder, W.E., Qi, H., 2010: Machine Vision. Cambridge University Press, New York, USA.
Timbeter, 2021: Website. [accessed on 21 Dec 2021] Retrieved from https://timbeter.com/
van Laar, A., Akça, A., 2007: Forest mensuration. Textbook, Springer, Netherlands, 1–385 p.
© 2023 by the authors. Submitted for possible open access publication under the
terms and conditions of the Creative Commons Attribution (CC BY) license (http://creativecommons.org/licenses/by/4.0/).
Authors' addresses:
Asst. prof. Zennure Ucar, PhD *
e-mail: zennure.ucar@ikcu.edu.tr
Asst. prof. Remzi Eker, PhD
e-mail: remzi.eker@ikc.edu.tr
Izmir Katip Celebi University
Faculty of Forestry
Department of Forest Engineering
35620, Balatçık, Çiğli, İZMİR
TÜRKIYE
Assoc. prof. Ebru Bilici, PhD
e-mail: ebru.bilici@giresun.edu.tr; ebilici@uidaho.edu
Giresun University
Dereli Vocational School
28902, Giresun
TÜRKIYE
and
University of Idaho
Experimental Forest College of Natural resources
83844, Moscow, ID
USA
Prof. Abdullah Emin Akay, PhD
e-mail: abdullah.akay@btu.edu.tr
Bursa Technical University
Faculty of Forestry
Department of Forest Engineering
16310 Yıldırım, Bursa
TÜRKIYE
* Corresponding author
Received: July 07, 2023
Accepted: November 17, 2023
Original scientific paper