

How do Wildfires Influence Harvesting Productivity and Volume Recovery in Cut-to-Length Mechanized Operations?
doi: https://doi.org/10.5552/crojfe.2027.4888
volume: issue, issue:
pp: 15
- Author(s):
-
- Solofonirina R. Jessica
- Labelle Eric R.
- Beaudoin Daniel
- Article category:
- Original scientific paper
- Keywords:
- boreal forest, post-disturbance operations, mechanized logging, cut-to-length system, wood recovery efficiency
Abstract
HTML
Wildfires are among the most significant natural disturbances affecting boreal forests, yet their operational impacts on mechanized harvesting remain poorly quantified. This study evaluated the effects of wildfire burn category on harvesting productivity and volume recovery under operational conditions in Quebec, Canada. Over 800 stems were harvested across four burn categories: carbonized, red, affected and green (unburned). Harvesting productivity was assessed through a time-and-motion study combined with harvester on-board computer (OBC) data, while volume recovery was calculated as the ratio of harvested volume to standing merchantable volume per stem. Non-parametric statistical tests and regression analyses were used to compare harvesting productivity and volume recovery across burn categories. Results showed that harvesting productivity did not differ significantly among burn categories within the examined stem size range (≤0.20 m³/stem), indicating that wildfire severity alone did not reduce operational productivity. In contrast, volume recovery rates were significantly lower in burned categories compared to unburned stands, with reductions increasing with burn severity. These results suggest that post-fire economic losses are more strongly linked to reduced wood recovery than to decreased harvesting productivity. Overall, this study provides empirical evidence supporting the operational feasibility of harvesting in burned boreal stands, while emphasizing the need to account for burn-related wood losses in planning following wildfires. Future research using large-scale OBC datasets is recommended to further refine the evaluations of harvesting productivity and volume recovery across burn categories.
How do Wildfires Influence Harvesting Productivity and Volume Recovery in Cut-to-Length Mechanized Operations?
Jessica Solofonirina R., Eric R. Labelle, Daniel Beaudoin
https://doi.org/10.5552/crojfe.2027.4888
Abstract
Wildfires are among the most significant natural disturbances affecting boreal forests, yet their operational impacts on mechanized harvesting remain poorly quantified. This study evaluated the effects of wildfire burn category on harvesting productivity and volume recovery under operational conditions in Quebec, Canada. Over 800 stems were harvested across four burn categories: carbonized, red, affected and green (unburned). Harvesting productivity was assessed through a time-and-motion study combined with harvester on-board computer (OBC) data, while volume recovery was calculated as the ratio of harvested volume to standing merchantable volume per stem. Non-parametric statistical tests and regression analyses were used to compare harvesting productivity and volume recovery across burn categories. Results showed that harvesting productivity did not differ significantly among burn categories within the examined stem size range (≤0.20 m³/stem), indicating that wildfire severity alone did not reduce operational productivity. In contrast, volume recovery rates were significantly lower in burned categories compared to unburned stands, with reductions increasing with burn severity. These results suggest that post-fire economic losses are more strongly linked to reduced wood recovery than to decreased harvesting productivity. Overall, this study provides empirical evidence supporting the operational feasibility of harvesting in burned boreal stands, while emphasizing the need to account for burn-related wood losses in planning following wildfires. Future research using large-scale OBC datasets is recommended to further refine the evaluations of harvesting productivity and volume recovery across burn categories.
Keywords: boreal forest, post-disturbance operations, mechanized logging, cut-to-length system, wood recovery efficiency
1. Introduction
Approximately one quarter of Canada’s forested area lies within the province of Quebec, where 90% of forests are publicly owned and managed by the government (MNRFa 2022). Beyond their ecological value, forests are a key driver of Quebec’s economy. Between 2016 and 2023, the forestry sector in Quebec, which combined sawmilling, pulp and paper and wood-based products, generated an annual average of $6.9 billion CAD in Gross Domestic Product (GDP) with harvested volume of 30 million m3 per year (MNRFa 2024). However, these valuable resources are increasingly exposed to various natural disturbances, particularly wildfires, which account for substantial annual burned areas. Between 2014 and 2024, an average of 441,358 ha was burned with 505 fires per year (MFWP 2015, 2016, 2017, 2018, MNRF 2019, 2020, 2021, 2022, 2023, MNRFb 2024). In 2023 alone, the burned area reached 4,288,264 ha with 713 fires (MNRFb 2024). Although wildfires arise from diverse ignition sources, lightning alone accounts for more than 90% of the total area burned (MNRFb 2024). Unfortunately, climate change is expected to further increase both the frequency and the severity of wildfires, thus placing additional pressure on forest resources (Boulanger et al. 2013, Gauthier et al. 2014).
The time window to recover damaged stems following forest wildfires is an important harvesting parameter. In fact, according to Barrette et al. (2015), wood recovery should occur within the disturbance year, or at the latest by the following year. Prestemon et al. (2006) estimated that delays in harvesting operations over a two-year period generated an additional revenue loss of approximately $1.5 million, representing about 25% of the total revenue in the Bitterroot National Forest, northern Rocky Mountains, United States, following wildfires. Improving post-fire recovery strategies is then essential to minimize economic losses after wildfires. However, this requires a detailed understanding of how burn category affects both harvesting productivity and volume recovery rates. Indeed, harvesting productivity is known to be strongly influenced by stand variability (Han et al. 2018), while volume recovery is shaped by natural disturbances (Nieuwenhuis and Fitzpatrick 2002, Lewis and Hartley 2006). Therefore, clarifying the role of burn category in these two components is essential for increasing the efficiency of harvesting operations and supporting sustainable forest management in Quebec.
In terms of harvesting productivity, several studies have shown a general decline when natural disturbances such as windthrow or insect infestations occur. For instance, Kärhä et al. (2018) confirmed that harvesting productivity of stems affected by windthrow was 19–33% lower than healthy stems in Norway spruce (Picea abies (L.) Karst.) dominated forests. Moving, delays and processing time were respectively 76%, 157% and 26% higher in damaged stems compared to undamaged ones. Average total cycle time was between 23% and 49% higher in damaged stems. Similarly, Spinelli and Hartsough (2006) observed a productivity loss of 10–20% in windblown poplar plantations, depending on the degree of damage. Moreover, Béland et al. (2020) stated that harvesting productivity of stems from balsam fir (Abies balsamifera), spruces (Picea spp.), white birch (Betula papyrifera), and poplars (Populus spp.) affected by spruce budworm (Choristoneura fumiferana) was 4–8% lower compared to healthy stems in a study conducted in Quebec. More time was required by the operators to analyze cutting strategies and volume recovery decreased in affected stems. However, each type of disturbance produces different working conditions. Trees may be entangled and lying on the ground after windthrow, while they often remain standing after wildfire. These differences can affect harvesting productivity in various ways and to different extents. Therefore, comparisons across disturbance types should be made with caution.
Concerning volume recovery rates, multiple studies have also focused on the effects of different natural disturbances. For example, Lewis and Hartley (2006) reported that volume recovery rates in stems affected by mountain pine beetles (Dendroctonus ponderosae) were comparable to those of healthy stems as long as the bark remained intact, with most volume losses occurring during felling and handling. However, recovery rates declined significantly once the bark was lost. Harvey (1979) also reported that less than 1% of the total volume was lost to advanced decay 11 years after mountain pine beetle infestation in a study conducted in Oregon. Besides, Nieuwenhuis and Fitzpatrick (2002) stated a volume loss of 9.7 m3/ha equivalent to 2.6% of volume loss per hectare following a windblow calamity in Ireland.
In the context of wildfires, many studies have investigated the ecological impacts of post-fire recovery on biodiversity (Purdon et al. 2002, Hébert 2006, Thorn et al. 2020), wildlife (Purdon et al. 2002, Boucher 2010, Ibarzabal et al. 2011, Jeffrey 2013), and forest regeneration (Noël 2001, Gauthier 2009, Boucher et al. 2014). Despite these contributions, and although burn categories are used to allocate recovery budgets and guide operational decisions, their actual operational implications, particularly their effects on harvesting productivity and volume recovery rates, have not yet been empirically quantified in Quebec.
As wildfire frequency is expected to increase in the future, harvesting operations may become increasingly affected. Based on findings from other types of natural disturbances, a decline in harvesting productivity could therefore be anticipated. However, such results cannot be directly transferred to wildfire-affected forests, as fire produces specific forms of damage, including burned structures, weakened branches, and fissured stems. Therefore, quantifying volume recovery rates by burn categories would also allow for more realistic predictions of key parameters for planning purposes and for estimating the costs of recovery operations.
Furthermore, the Ministry of Natural Resources and Forests (MNRF) of Quebec creates special development plans following significant natural disturbances to reduce economic losses (MNRF 2025). The MNRF provides financial support to organizations responsible for forest management under these plans. Support is stratified by burn category: carbonized (severely burned), red (moderately burned), affected (lightly burned) and green (unburned) (MNRF 2025).
We hypothesized that harvesting productivity and volume recovery rate would decrease with increasing burn category. Therefore, this study aims to address those gaps by analyzing the effects of wildfire on harvesting operations by focusing on the following objectives:
- (1) Quantify the influence of burn category on harvesting productivity, and
- (2) Evaluate the influence of burn category on volume recovery rate.
By empirically quantifying harvesting productivity and volume recovery across burn categories, this study improves the understanding of harvesting operations and provides practical evidence to support harvesting operations and cost estimation in boreal forests following wildfires.
2. Materials and Methods
2.1 Study Site Locations
This research was conducted in Quebec, Canada. The sites were selected based on the availability of special development plans provided by the MNRF. These plans included harvesting blocks and fire classification maps delineating different burn categories within the blocks. Therefore, sites 1 (48.64532, –72.91792) and 3 (48.363763, –72.931535) were located in La Doré, while site 2 (50.096847, –73.555305) was situated northeast of Chibougamau. Carbonized, red, affected plots were found in sites 1 and 2, whereas green plots were in site 3 (Fig. 1).
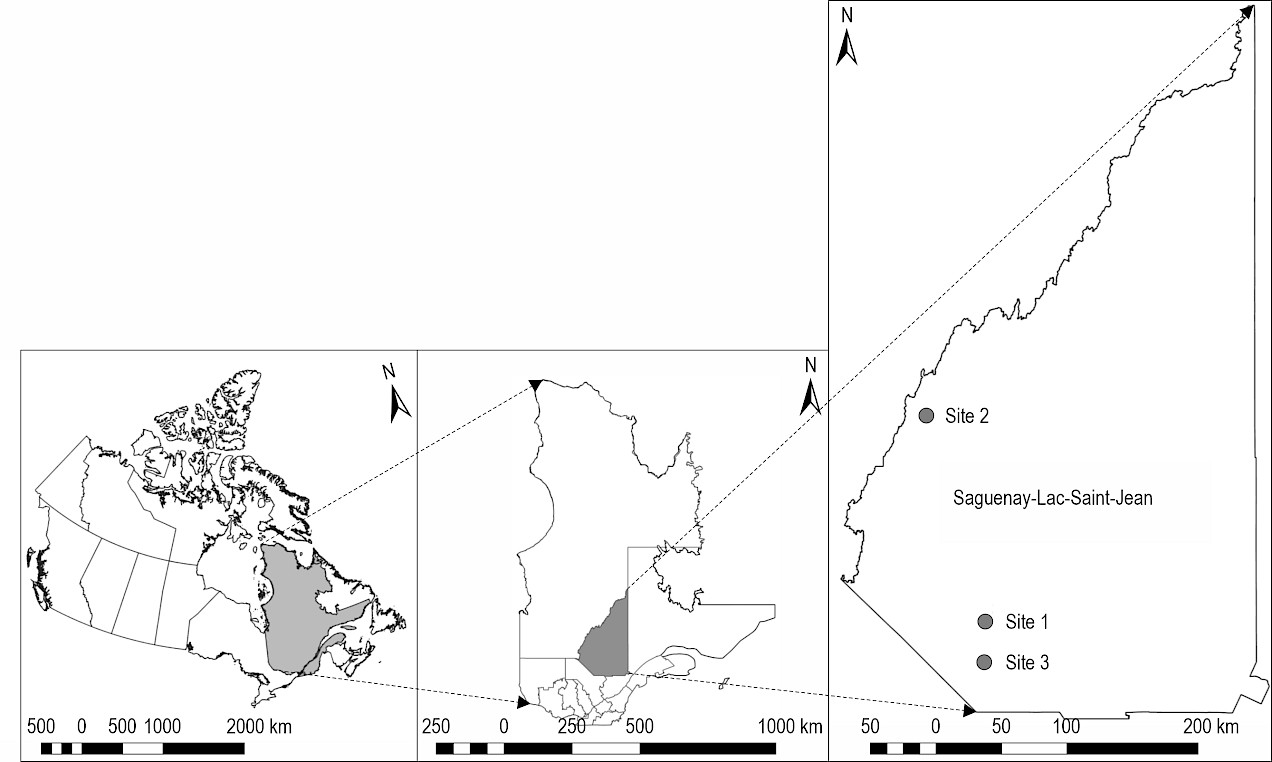
Fig. 1 Locations of study sites in Quebec, Canada
2.2 Machines Specifications
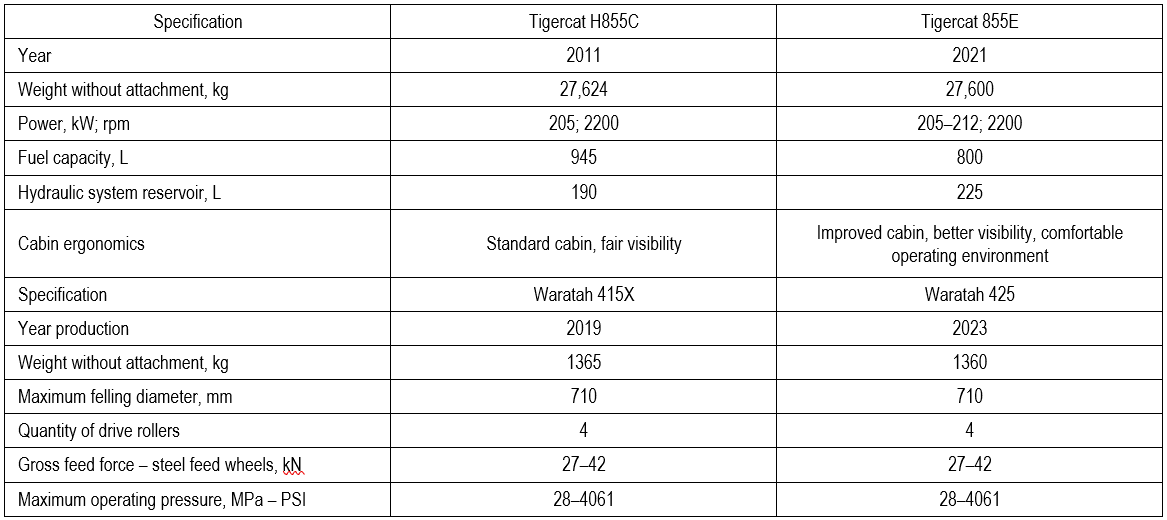
Two harvesters were used at the study sites. A Tigercat H855C equipped with a Waratah 415X was operated at sites 1 and 2, whereas a Tigercat 855E equipped with a Waratah 425 was used at site 3 (Table 1). Both machines were operated by the same operator during day shifts, who had over 20 years of harvesting experience.
Table 1 Specifications of harvesters and harvesting heads (Ritchie Specs 2025, Tigercat 2025, Brandt 2025, Waratah 2025)
2.3 Experimental Design
Pre-harvesting field inventories were conducted in August, November and December 2023, as well as in July 2024. The plots were subjected to a salvage clear-cut silvicultural treatment and the same product specifications were applied to all study sites. Treatments corresponded to burn categories as defined in Table 2.
Table 2 Description of burn categories (adapted from MNRF 2025)

In total, nine plots were harvested: three carbonized, two red, two affected, and two green plots. Carbonized, red and affected plots were harvested using the Tigercat H855C, while green plots were harvested with a Tigercat 855E. Each plot, measuring 20 m in width and extending over a variable length, was marked with flagging tape and comprised approximately 120 trees. Machine operating trails were also flagged along the longitudinal axis at the center of each plot (Fig. 2). A unique alpha-numeric code was painted on each merchantable tree. Tree species, diameter at breast height (DBH) (measured with a circumference tape), and total height (measured with a digital height-measuring device) were recorded.
Two video cameras were installed inside the harvester cabin: one directed at the on-board computer (OBC) screen and the other aimed at the harvesting head. During harvesting operations, the operator was instructed to announce aloud the number marked on each stem being processed. This procedure enabled us to link the data from the pre-harvest inventory, OBC records and harvesting video footage.
Before entering each plot, a dedicated work file was created on the harvester’s OBC to record all plot-specific data. Once harvesting was completed, the work file was closed and the associated .pri files were exported to a USB drive.
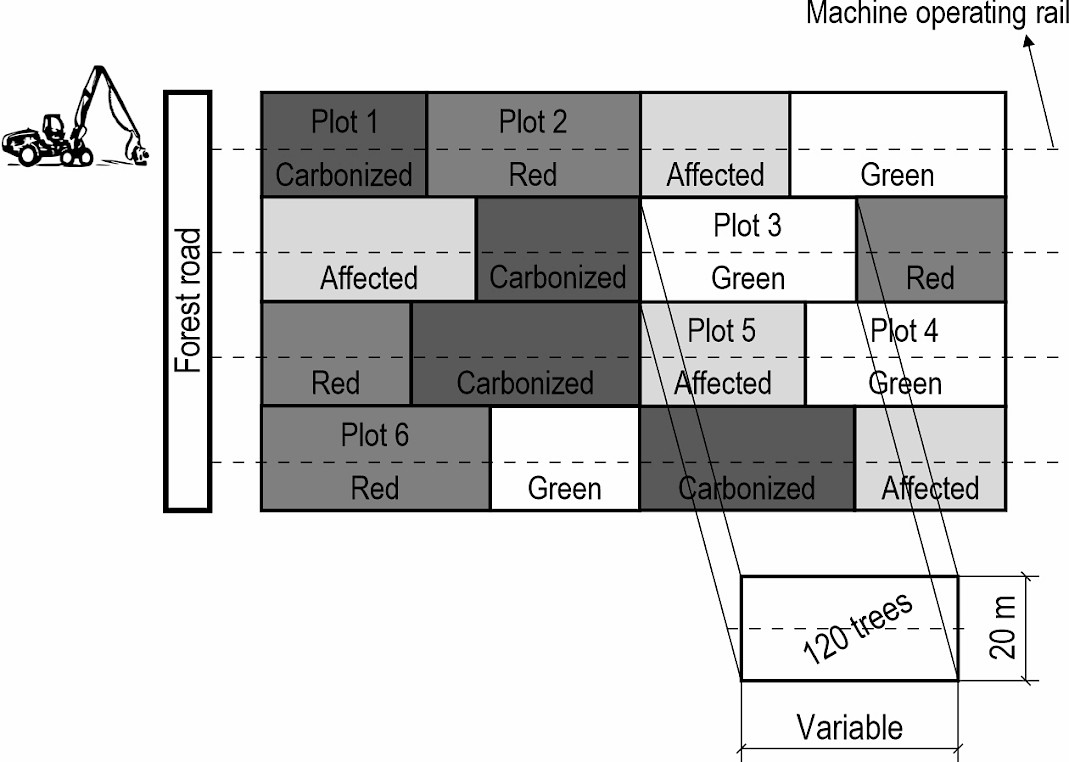
Fig. 2 Field experimental design depicting burn categories
2.4 Data Collection and Analysis
2.4.1 Harvesting Productivity and Time Studies
Harvesting productivity is measured using processed volume per Productive Machine Hour (PMH) (Ackerman et al. 2014), with results expressed in PMH15, including delays shorter than 15 minutes. Processed volume at the stem level was calculated by summing the volumes of individual products. These volumes were computed using the Smalian formula based on diameter and length measurements recorded in the harvester OBC.

In some cases, certain stems could not be identified in the harvesting video footage and were consequently excluded from the analyses. Also, the stems with merchantable volumes of more than 0.20 m³/stems (80/819 stems) were excluded due to a low representation within burn categories (carbonized: 18, red: 35, affected: 13 and green: 14), which could potentially bias non-parametric comparisons.
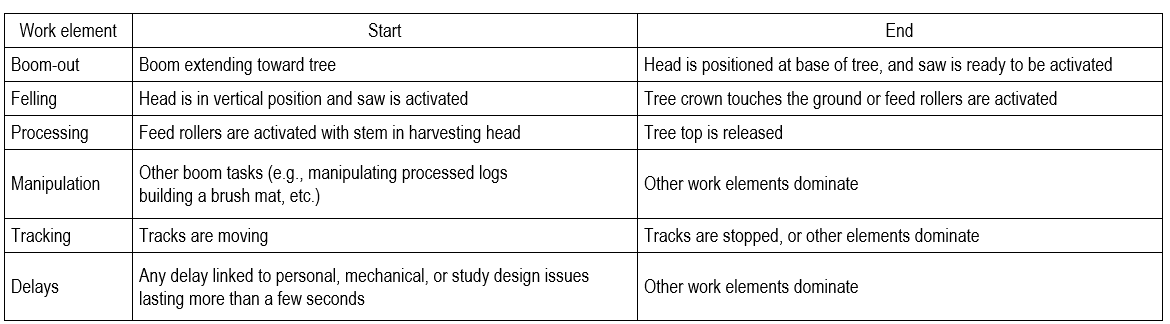
A detailed time and motion study was then conducted using UMT+ software to segment each work cycle into predefined elements (Laubrass 2025): boom-out, felling, processing, tracking, manipulation and delays (Table 3). Standardized time values were allocated to work elements not systematically occurring for each stem, including tracking, manipulation, and delays.
Table 3 Description of work elements during the time and motion study (adapted from Labelle et al. 2017)
2.4.2 Volume Recovery
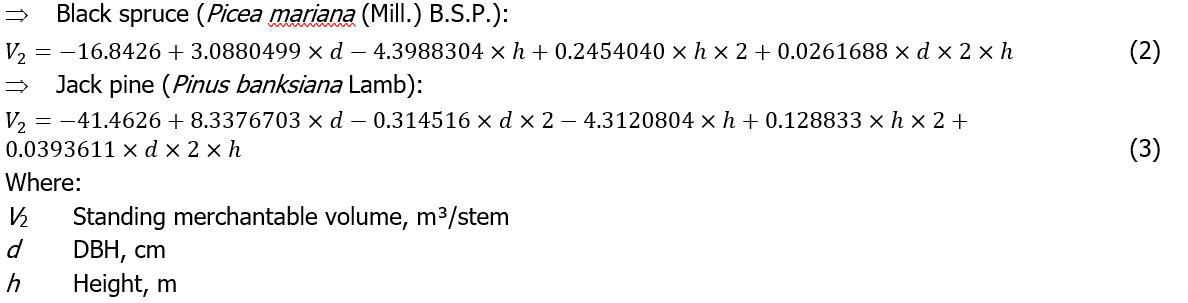
Volume recovery rate was calculated as the percentage ratio of processed volume per stem (V1) to standing merchantable volume per stem (V2).
Standing merchantable volume per stem (V2) was calculated according to two equations (Perron 2003), corresponding to the Quebec volume tables:
2.4.3 Statistical Analysis
To verify the similarity of stand characteristics among burn categories, DBH, height, and standing merchantable volume per stem were first compared for processed stems. Normality was assessed using the Shapiro-Wilk test and since the assumptions were not met, differences among burn categories were tested using the Kruskal-Wallis test. To ensure meaningful comparisons, further analysis was conducted by grouping stems into two volume classes: ≤0.10 m³/stem and those between 0.10–0.20 m³/stem. Dunn test with Holm method was then used for comparisons between burn categories. The same statistical procedure, as described above, was applied for cycle time, harvesting productivity and volume recovery rates. Afterwards, multiple regression analyses were conducted to examine the relationship between (i) harvesting productivity and standing merchantable volume per stem, and (ii) log volume and standing merchantable volume per stem. The response variable was log-transformed (ln) to stabilize residual variance, and a second-degree polynomial regression was applied to standing merchantable volume. Analyses were performed using R version 4.4.2 and the significance level was set at p<0.05 in this study.
3. Results
3.1 Mensuration of Processed Stems
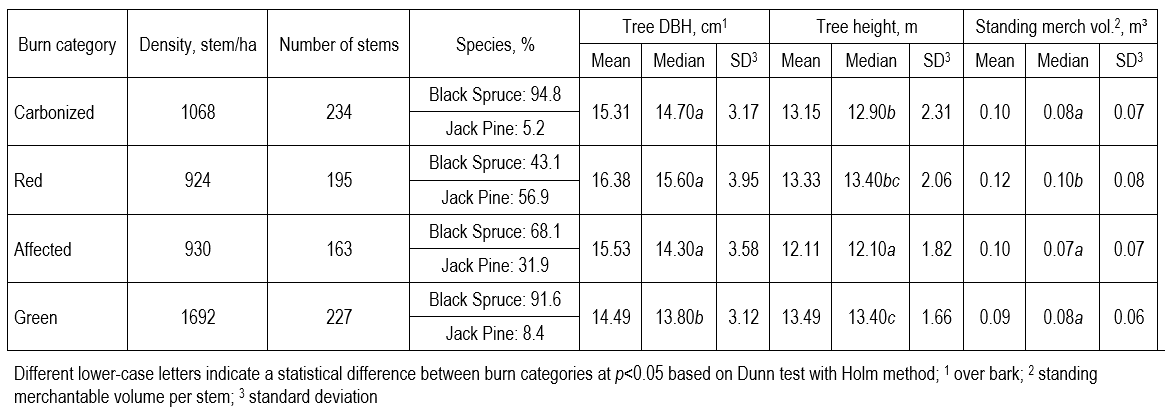
From the 1082 trees inventoried, 819 stems were processed across the plots. Carbonized and green categories were predominantly composed of black spruce (94.8% and 91.6%, respectively), while affected and red categories presented a more balanced species composition, with black spruce representing 68.1% and 43.1% of stems, respectively, and jack pine representing 31.9% and 56.9%, respectively (Table 4). Stand density was quite similar for carbonized, red and affected plots (mean of 974 trees/ha) whereas green plots were much denser at 1692 trees/ha.
Mean DBH varied between 14.5 cm to 16.4 cm for green and red categories, respectively. Statistical analysis revealed significant differences in DBH between (i) carbonized – green, (ii) red – green and (iii) affected – green. However, no significant differences were observed between the other burn categories (Table 4). Mean height ranged from 12.1 m to 13.5 m for affected and green categories, respectively. Height differed significantly between (i) carbonized – affected, (ii) carbonized – green, (iii) red – affected and (iv) green – affected (Table 4). The highest average standing merchantable volume per stem was observed in the red category (0.12 m³/stem).
Table 4 Characteristics of processed stems by burn category
By adding more analyses and considering stems ≤0.20 m3, standing merchantable volume for processed stems remained significantly different among burn categories (Fig. 3). However, when those stems were grouped into two classes ((i) ≤0.10 m³/stem and (ii) >0.10–≤0.20 m³/stem), no significant differences were detected among burn categories (Fig. 3). Therefore, these volume classes enabled meaningful comparisons of harvesting productivity and volume recovery rates across burn categories by reducing size-related bias.
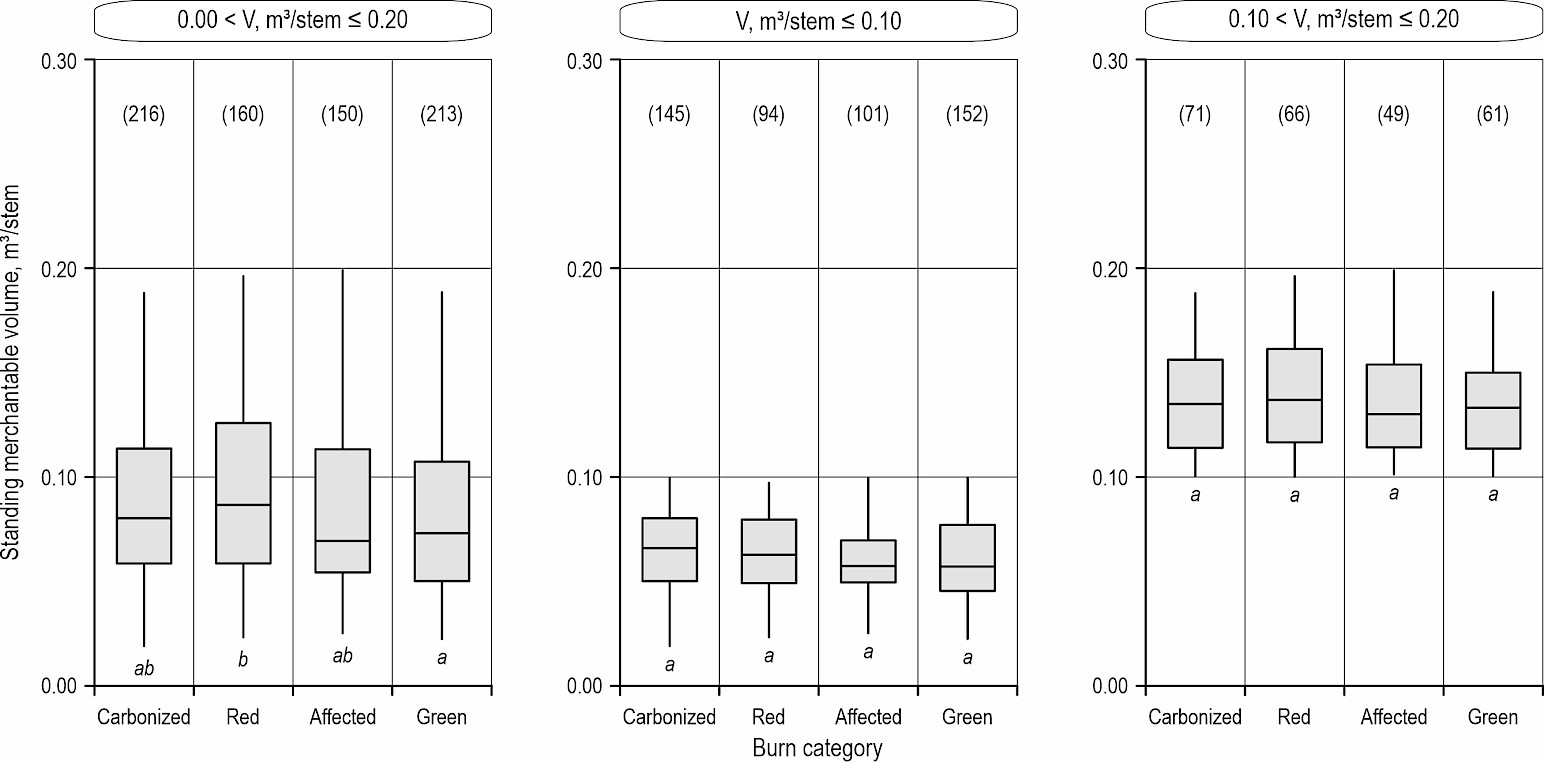
Fig. 3 Distribution of standing merchantable volume for processed stems by burn category; Different lower-case letters indicate a statistical difference between burn categories at p<0.05 based on Dunn test with Holm method
3.2 Time and Motion Analysis
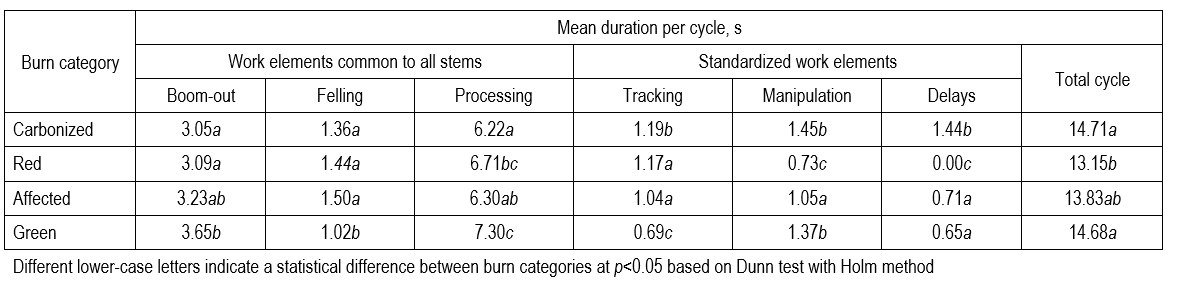
For stems ≤0.10 m3, the shortest total cycle time was observed in the red category (13.15 s), while the longest occurred in the carbonized category (14.71 s). Significant differences were detected between (i) carbonized – red and (ii) green – red. No significant differences in total cycle time were observed among the other burn categories (Table 5).
Boom-out and processing times were shortest in the carbonized category (3.05 s, 6.22 s, respectively) and longest in the green category (3.65 s, 7.30 s, respectively). Manipulation and delay times were lowest in the red category (0.73 s, 0.00 s, respectively), and highest in the carbonized category (1.45 s, 1.44 s, respectively). Felling time was shortest in the green category (1.02 s) and longest in the affected category (1.50 s), whereas tracking was shortest in the green category (0.69 s) and longest in the carbonized category (1.19 s). Although several work elements showed significant differences among burn categories, the trends varied from one work element to another (Table 5).
Table 5 Mean duration of each work element for standing merchantable volume ≤0.10 m³ across burn categories
Overall, the distribution of work elements varied among burn categories. Processing accounted for the highest proportion of total cycle time across all burn categories, ranging from 42% in the carbonized category to 51% in the red category. Boom-out consistently ranked second, representing between 21% and 25% of the cycle time in carbonized and green categories, respectively. Together, processing and boom-out accounted for the majority of the total cycle time. Felling, delays, tracking and manipulation each contributed less than 12% of the total cycle time, with minor variations between burn categories (Fig. 4).

Fig. 4 Mean proportion of each work element for standing merchantable volume ≤0.10 m³/stem across burn categories
For stems >0.10 m ³ and ≤0.20 m³, the shortest total cycle time was observed in the affected category (14.71 s), whereas the longest occurred in the green category (16.75 s). Significant differences were detected between (i) green – affected, (ii) green – red. No significant differences were observed among the other burn categories (Table 6).
Boom-out and processing times were shortest in carbonized (2.97 s and 7.19 s, respectively) and longest in the green category (3.44 s and 9.43 s, respectively). Manipulation and delay times were lowest in the red category (0.76 s and 0.00 s, respectively), while the highest manipulation time occurred in the green category (1.35 s) and the highest delay time in the carbonized category (1.39 s). Felling and tracking times were quicker in the green category (1.22 s and 0.69 s, respectively), while longer durations were observed in the red category for felling (1.56 s) and in the affected category for tracking (1.24 s). Although several work elements showed significant differences among burn categories, the trends varied from one work element to another (Table 6).
Table 6 Mean duration of each work element for standing merchantable volume >0.10 m³ and ≤0.20 m³ across burn categories
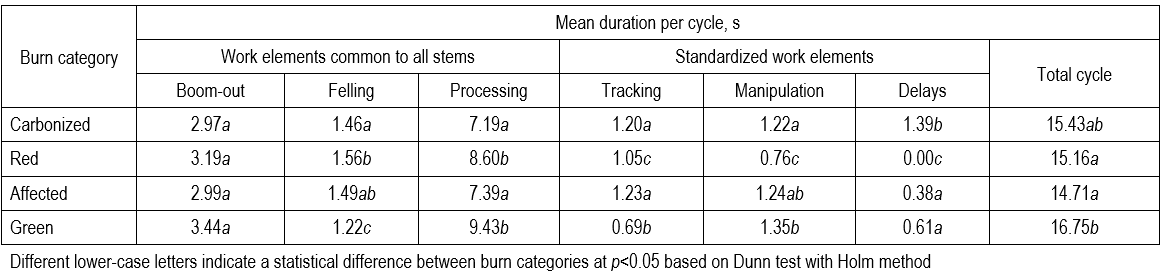
Overall, the proportion of work elements varied across burn categories. Similar to what was reported for smaller stems, processing also accounted for the largest share of the total cycle time in all burn categories, ranging from 47% in the carbonized category to 57% in the red category. Boom-out consistently ranked second, contributing between 19% and 21% of the total cycle time across burn categories. Felling, delays, tracking, and manipulation each contributed less than 10% of the total cycle time in all burn categories (Fig. 5).

Fig. 5 Mean proportion of each work element for standing merchantable volume > 0.10 m³ and ≤ 0.20 m³ across burn categories
3.3 Harvesting Productivity
The relationship between harvesting productivity and standing merchantable volume per stem is illustrated via the scatterplot (Fig. 6). Due to the presence of heterogeneous residual variance, a transformation was applied to stabilize the variance and improve model assumptions. Therefore, exponential models combined with second-degree polynomial regression were fitted to better describe the non-linear relationship between the variables. For all burn categories, the fitted equations suggested that productivity increased exponentially with increasing standing merchantable volume within the analyzed stem size interval. The coefficients of determination (R2) ranged from 0.66 to 0.73 across burn categories, indicating moderate to strong explanatory power of the models (Fig. 6).
Between 0.00–0.02 m3/stem, harvesting productivity was similar for red and affected categories, whereas carbonized and green categories showed lower productivity. In the range of 0.02–0.05 m3/stem, harvesting productivity was similar for red, affected and green categories, while carbonized remained the lowest. Between 0.05–0.14 m3/stem, the green category presented the highest productivity, followed by red, affected, and carbonized. From 0.14–0.17 m3/stem, red showed the highest productivity, followed by affected, green and carbonized. Up to 0.17 m3/stem, productivity remained similar and highest for red and affected categories until a point at which carbonized surpassed them. In the green category, productivity reached its optimum within this volume interval (Fig. 6).
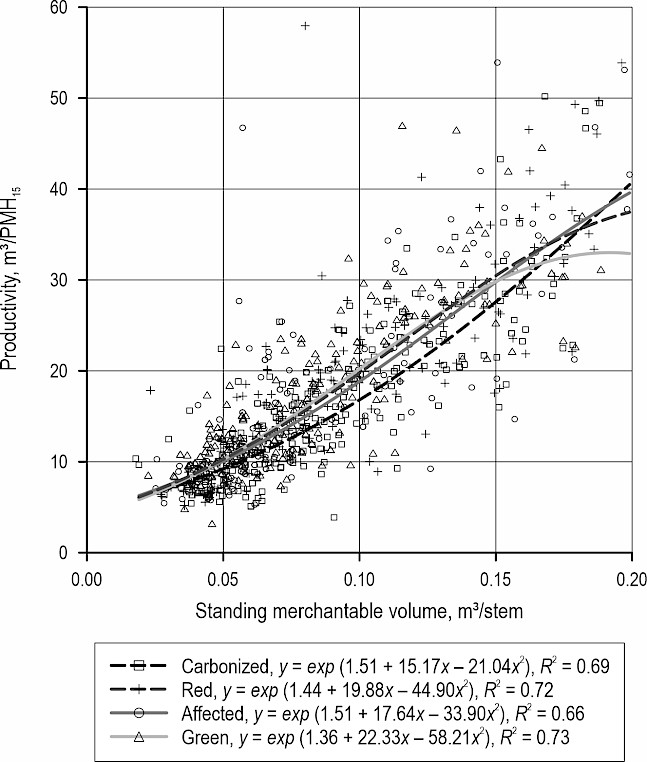
Fig. 6 Harvesting productivity curves (2nd degree polynomial regressions) in function of burn category, residual standard error: 0.29, R2: 0.71; p-value: <2.2e-16
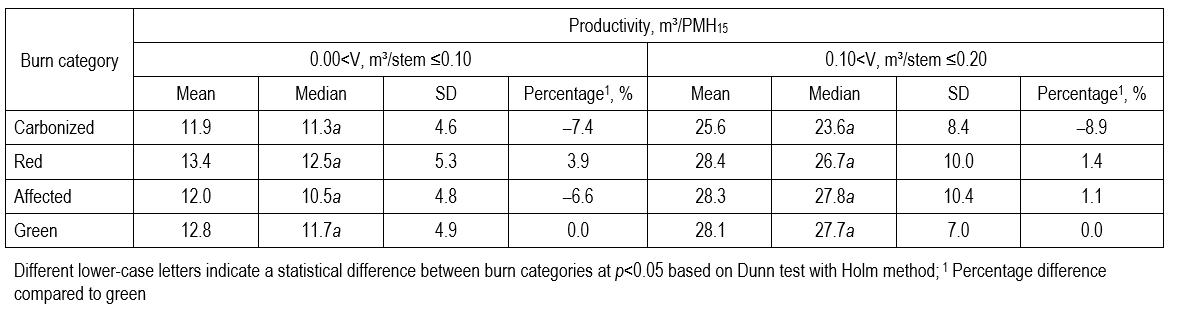
For stems ≤0.10 m3, the highest average productivity occurred in the red category (13.4 m³/PMH15), while the lowest was observed in the carbonized category (11.9 m³/PMH15). Productivity decreased by 7.4% in the carbonized category and by 6.6% in the affected category, while it increased by 3.9% in the red category compared to green category. For stems >0.10 m ³ and ≤0.20 m³, the highest average productivity was again observed in the red category (28.4 m³/PMH15), while the lowest occurred in the carbonized category (25.6 m³/PMH15). Productivity declined by 8.9% in the carbonized category, while it increased by 1.4% in the red category and by 1.1% in the affected category compared to green category. However, for both standing merchantable volume classes, productivity did not differ significantly among burn categories (Table 7).
Table 7 Mean harvesting productivity and standard deviation per burn category
3.4 Volume Recovery
The scatter plot shows the relationship between harvested volume per stem and standing merchantable volume per stem (Fig. 7). As the residuals exhibited heterogeneous variance, a transformation was necessary to stabilize the variance and to improve model assumptions. Consequently, exponential models combined with a second-degree polynomial regression were applied. For each burn category, volume recovery increased exponentially with increasing standing merchantable volume until reaching an optimum, then decreased, particularly for the green category. The coefficients of determination (R2) of each burn category were greater than 0.71, indicating a strong ability of the models to explain the variability.
Between 0.00 and 0.04 m3/stem approximately, volume recovery was similar for all burn categories. In the range of 0.04 to 0.12 m3/stem approximately, the green category showed the highest volume recovery, followed by affected, red and carbonized. From 0.12 to 0.16 m3/stem approximately, green still presented the highest volume recovery followed by red, affected and carbonized. Up to 0.16 m3/stem, green showed the highest volume recovery followed by red, carbonized and affected up to a certain point. Thereafter, red and carbonized surpassed green. Volume recovery reached its optimum within this interval for the green category (Fig. 7).
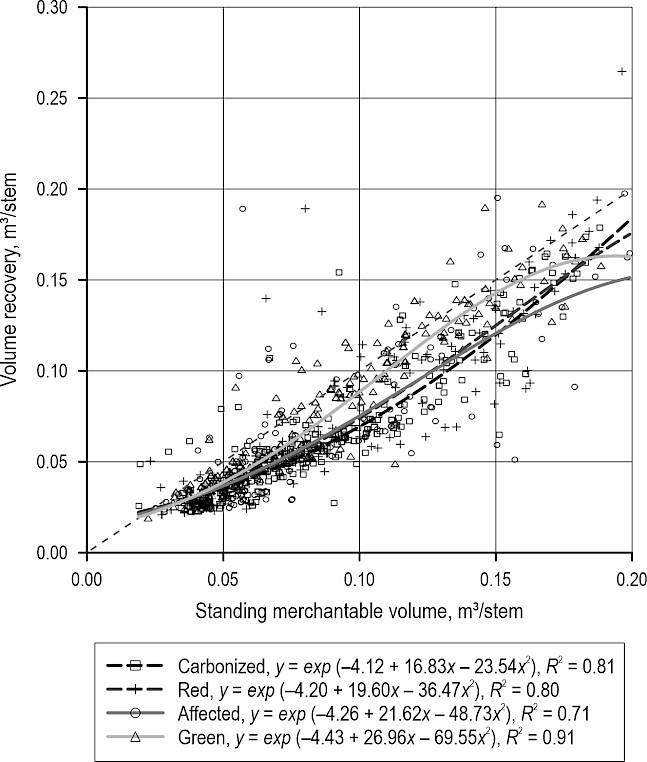
Fig. 7 Volume recovery curves (2nd degree polynomial regressions) in function of burn category, the red line indicates the line of unity (1:1), residual standard error: 0.24, R2: 0.82; p-value: <2.2e-16
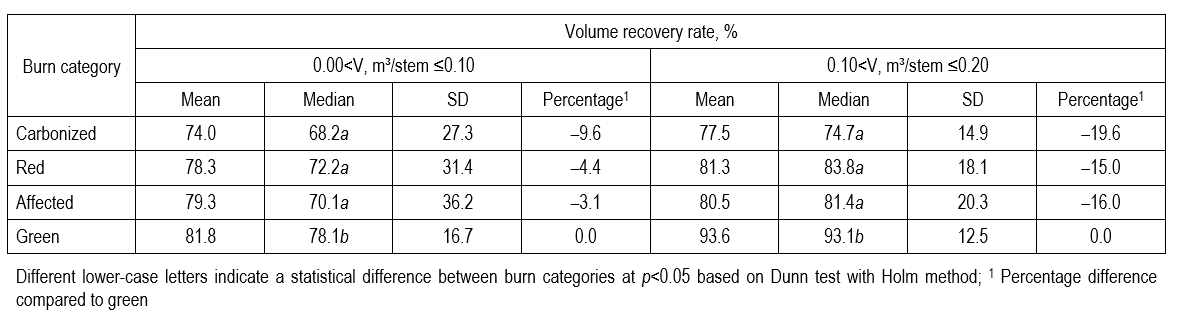
From 0.00 to 0.10 m3/stem, the average volume recovery rates ranged between 74.0% and 81.8% in the carbonized and green categories, respectively. Compared to the green category, recovery rates decreased in carbonized (9.6%) followed by red (4.4%) and affected (3.1%). From 0.10 to 0.20 m3/stem, average volume recovery rates varied from 77.5% to 93.6%, in the carbonized and green categories, respectively. Recovery rates declined by 19.6% in the carbonized, 15.0% in the red and 16.0% in the affected categories compared to the green category. For both standing merchantable volume classes, volume recovery rates differed significantly between (i) carbonized – green, (ii) red – green and (iii) affected – green. However, no significant differences were observed between the other burn categories (Table 8).
Table 8 Volume recovery rate per merchantable volume classes and burn category
4. Discussion
4.1 Time and Motion Studies
In this study, average cycle durations were mostly shorter than those reported in previous studies. For example, Pohjala et al. (2024) reported average total effective times per tree, including processing, felling, boom-out, moving and delays, of approximatively 20 s in Scots pine (Pinus sylvestris L.) dominated stands in Finland (9.5–17.6 cm DBH), thus equaling a 29% longer cycle time compared to our results.
When examining the distribution of work elements, processing consistently remained the most time-consuming element across all burn categories, which was similar to previous works. For instance, processing accounted for more than 60% (mean DBH of 33.5 cm) of the total cycle time, followed by felling and boom-out with 19% and 13.6%, respectively, in Norway spruce dominated stems (Kärhä et al. 2018). Similarly, processing represented >50% (mean DBH of 29.5 cm) of total cycle time in hardwood dominated stands in Germany (Labelle et al. 2018). In contrast, the proportion of tracking time in our study was lower than the 9.9–13.8% reported for pine-dominated stands in Germany (Labelle et al. 2017). However, this work element may have been underestimated in our dataset, as it was not prioritized when occurring simultaneously with other work elements. Furthermore, harvester boom length varied from 10 m in our study to 14.5 m in Labelle et al. (2017). The longer boom triggered shorter tracking times at the expense of longer boom-out times.
Regarding cycle time among burn categories, the differences may be explained by variations in stem condition as well as stand structure and burn category. In the green category, longer processing times may be related to higher wood resistance and denser crowns, while faster felling may be partly explained by more predictable stem behavior and fewer safety or control adjustments. In contrast, the carbonized category presented the shortest processing time since most branches had been burnt, thus requiring less processing effort. However, this category showed longer delays times, mainly due to work interruptions caused by chain derailment or chain removal during harvesting operations. In red and affected categories, damage was neither minimal nor severe. This heterogeneity likely required frequent operator adjustments. As a result, work element durations were less consistent and overall cycle times were intermediate than those observed in carbonized and green categories. Finally, tracking time was statistically shortest in the green category, which can be explained by the highest stand density, which reduces the need for frequent machine repositioning.
4.2 Harvesting Productivity
Within the defined stem-size interval, harvesting productivity mostly increased with standing merchantable volume for each burn category. However, the green category seems to reach a maximum productivity at about 0.19 m3/stem. This decline is likely due to the limited number of stems within the standing merchantable volume range. In contrast, Visser and Spinelli (2012) reported that productivity continued to increase with stem size and reached a maximum at approximately 1.9 m³/stem (mean DBH of 42cm). Their study, performed in New Zealand, was based on excavator-mounted systems equipped with high-capacity harvesting heads, which differ from the smaller-scale equipment used in the present study, designed for smaller-diameter trees.
No significant difference in overall productivity between burned and unburned stands was observed, potentially reflecting a compensation effect whereby higher burn severity reduces volume recovery for a given DBH while simultaneously accelerating work cycles. Nevertheless, some deviations between burned and unburned stands were observed, reflecting variations in stand structure rather than the effect of burn category itself. This interpretation aligns with previous findings suggesting that statistical similarity does not preclude the presence of operational variability (Labelle et al. 2024). Moreover, stem size, which varies within and among forest stands, remains a dominant determinant of harvesting productivity (Lindroos et al. 2024). Additional factors such as operator adaptation, visibility, and terrain conditions may also have contributed to the observed productivity among burn categories. It is also important to note that, when productivity is based on measured processed volume while merchantable volume is estimated from standing volume, differences in recovery ratios due to burn severity can introduce a volume recovery bias.
Furthermore, the average productivity observed in both burned and unburned categories was similar or higher than the ranges reported in previous studies performed in pine and/or spruce stands. For instance, Mizaras et al. (2008) reported harvesting productivity lower than 20 m³/PMH (<0.2 m³/stem) in spruce stands with a Timberjack 1270. Similarly, Hiesl and Benjamin (2014) reported harvesting productivity values ranging from 6.1 m³/PMH to 26.5 m³/PMH (13.1–18.7 cm DBH) in spruce fir stands in west-central Maine, USA. In Polish pine stands, Mederski et al. (2016) found an average harvesting productivity of 18.6 m³/PMH (15.4–25.9 cm DBH). Labelle et al. (2017) also stated that harvesting productivities ranged from <20 m³/PMH₀ (10–19 cm DBH) with an Atlas Königstiger T23 single-grip harvester for pine and spruce stands. Morevover, Dlokweni et al. (2022) reported in a pine fire salvage operation in the Eastern Cape, South Africa that harvesting productivity varied with tree size, with a mean harvester productivity of 60.5 m³/PMH for trees averaging 0.72 m³, and a mean feller-director productivity of 22.7 m³/PMH for smaller trees averaging 0.14 m³, which is comparable to the stem sizes examined in the present study. These comparisons suggest that the harvesting productivity observed in the present study reflects typical mechanized harvesting performance under comparable stem size conditions.
Finally, the effects of wildfire on harvesting productivity observed in this work differed from those reported for other natural disturbances. While previous studies have documented reduced harvesting productivity in windthrow and spruce budworm-affected stands (Kärhä et al. 2018, Béland et al. 2020), wildfire did not lead to a comparable decrease. Overall, the results suggest that harvesting in burned stands remains productive, as wildfire severity alone did not constitute a limiting factor of work pace within the examined stem-size range and operational conditions.
4.3 Volume Recovery
In contrast to harvesting productivity, volume recovery rates were clearly influenced by wildfire effects. Generally, recovery rates increased with standing merchantable volume across all burn categories. However, in the green category, volume recovery reached a maximum at approximately 0.19 m3/stem and then began to decrease, which may be partly explained by the limited number of observations, particularly for merchantable volumes greater than 0.15 m³/stem.
Significant differences in volume recovery were observed between burned and green categories, whereas no significant differences were detected among the burned categories (carbonized, red, and affected). Unburned stems likely retained greater structural integrity, which may have contributed to reduced wood loss during processing. In contrast, burned stems may have been partially damaged or deformed, leading to a reduced number of logs or/and lower volume recovery rate. Variations in stand characteristics may have further contributed to these differences.
The average volume recovery rates in this study were similar or higher than those reported in previous research. Labelle et al. (2017) reported recovery rates below 50% for small-diameter stems (10–24 cm DBH) in pine-dominated stands, while Labelle et al. (2018) observed higher recovery rates ranging, from 73% to 85%, in large diameter hardwood dominated stands. In fire-affected stands, Dlokweni et al. (2022) reported that log volume recovery (utilizable stem volume) reached 84% for cut-to-length (CTL) systems and 58.1% for full-tree (FT) systems. However, in the present study, harvester calibration settings and the selection of log volume tables may have affected processed and standing merchantable volumes, respectively. Moreover, measurement errors associated with the digital height measurement device used during field inventory may have introduced bias. These methodological factors potentially contributed to high recovery rates observed, which in some cases exceeded 100%.
Overall, the results suggest that harvesting in burned stands remains operationally productive under the studied conditions, whereas volume recovery appears more sensitive to wildfire effects. The hypothesis that harvesting productivity would decrease with increasing burn severity was not supported, whereas the hypothesis regarding reduced volume recovery in burned stands was supported.
4.4 Study Limitations and Future Research
This study was conducted under operational conditions that impose certain limitations. Harvesting operations were done using two harvesters: a Tigercat H855C with a Waratah 415X and a Tigercat 855E equipped with Waratah 425. The observed differences, or the absence of differences, in harvesting productivity and volume recovery rates may partly reflect the effects of the harvester or harvesting head rather than burn category alone. However, several factors may limit this potential source of bias. The harvesters and harvesting heads used were from the same manufacturers and represent only improvements over previous models. In addition, all plots were harvested by the same operator working day shifts and using consistent working techniques. Moreover, the analyses focused on stems with small standing merchantable volume (≤0.20 m³/stem), a range within which both harvesting heads are expected to operate in a similar way. Nevertheless, future studies should explicitly control harvester and harvesting head types.
Site selection was based on wildfire areas from 2023 and 2024, availability of fire classification maps, site accessibility and company harvesting planning. As this study was limited in time and space, stand characteristics, such as density, DBH, height and species were difficult to control across the plots. Only the operator and the burn categories were controlled. However, to minimize variability, plots were initially selected based on visual field assessment to ensure similar stand and site conditions, and their comparability was subsequently confirmed through additional analyses.
Measurement uncertainty may also have affected both harvesting productivity and volume recovery rates. Harvested volumes were calculated using log lengths and diameters from the OBC data, which were influenced by the calibration of the harvester head. In fact, calibration was guided by an operational control protocol communicated to the harvesting crews. Operators were instructed to perform two control checks per week, with five logs measured at each control point. Calibration of the harvester head was required when results did not meet the accepted accuracy thresholds (i.e., 80% of diameter measurements within ±6 mm and 80% of length measurements within ±2 cm). In addition, standing merchantable volume was estimated using a formula, which may have introduced potential errors. These methodological factors contributed to the observed recovery rates exceeding 100% in some cases, which should not be interpreted as an analytical error.
In addition, this study did not analyze the influence of burn categories on damage to the harvesting head or harvester maintenance. Nevertheless, these operational aspects remain essential for understanding long-term equipment performance and cost management, thereby providing a more comprehensive evaluation of the technical and economic consequences associated with post-fire harvesting operations.
Despite these limitations, the consistency of trends observed across burn categories strengthens the robustness of the conclusions within the studied operational context. Nevertheless, these limitations warrant caution when extrapolating the present findings beyond the examined stem size range and operational conditions.
Previous research has identified several factors that significantly influence harvesting productivity, including stem size (Nakagawa et al. 2007, Purfürst and Erler 2011, Eriksson and Lindroos 2014, Ghaffariyan et al. 2019, Rossit et al. 2019, Lindroos et al. 2024), tree species (Eriksson and Lindroos 2014, Rossit et al. 2019, Spinelli et al. 2020), stand density (Mederski et al. 2016), operator performance (Purfürst and Erler 2011, Rossit et al. 2019) and work shift (Rossit et al. 2019). Regula et al. (2018) further emphasize the influence of factors such as market conditions, time management, planning, mechanical characteristics, labor and machine specifications. These factors may also be relevant when evaluating volume recovery. Therefore, further analyses using larger datasets derived from harvester OBC are recommended. Such datasets would allow improved statistical control by incorporating additional variables, while increasing replication within each burn category. Olivera et al. (2016) demonstrated that OBC systems allow a continuous collection of detailed data on harvested stems, harvesting processes and these data represent a valuable resource for both industrial applications (Rossit et al. 2019) and scientific research (Polowy and Molińska-Glura 2023). Moreover, as emphasized by Ackerman et al. (2022) and Lindroos et al. (2024), OBC datasets offer a promising way to improve the evaluation of harvesting productivity. Similar approaches could also enhance the analysis of volume recovery in post-fire harvesting contexts.
5. Conclusions
This study provides empirical evidence that, within the examined stem size range, harvesting productivity in burned stands (mean of 12.4 m³/PMH15 and 27.4 m³/PMH15 for small and intermediate stems, respectively) remained comparable to that observed in unburned stands (mean of 12.8 m³/PMH15 and 28.1 m³/PMH15, respectively). In contrast, volume recovery was significantly lower in burned stands (mean of 77.2% and 81.8% for small stems and intermediate stems, respectively) compared to the unburned stands (mean of 79.8% and 93.6%, respectively), highlighting that wildfire mainly affects wood recovery rather than harvesting productivity. These results suggest that economic losses following wildfires are more likely associated with wood recovery as opposed to harvesting productivity. Further research using larger datasets derived from harvester OBC is recommended to strengthen these conclusions. Integrating additional variables, such as stand characteristics, operator performance, and machine type, would allow a more comprehensive evaluation of harvesting performance following wildfires.
Acknowledgments
This study was co-financed by The Fonds de recherche du Québec (FRQ) and the Ministry of Natural Resources and Forests (MNRF) of Quebec. The authors sincerely thank Patrick Girard (MNRF) and Luca Serban (MNRF) for their valuable advice and constructive discussions. They are also grateful to Emile Delisle (Université Laval), Gabriel Chabot (Université Laval), Finidi Ratefiarison (Université Laval), Pierre-Luc Théberge (GTO) and Gabriel Verret (Domtar) for their assistance during field data collection.
6. References
Ackerman, P., Gleasure, E., Ackerman, S., Shuttleworth, B., 2014: Standards for time studies for the South African forest industry, 1st edition, ICFR/FESA: South Africa, 1–49.
Ackerman, S.A., Talbot, B., Astrup, R., 2022: The effect of tree and harvester size on productivity and harvester investment decisions. Int. J. For. Eng. 33(1): 22–32. https://doi.org/10.1080/14942119.2021.1981046
Barrette, J., Thiffault, E., Saint-Pierre, F., Wetzel, S., Duchesne, I., Krigstin, S., 2015: Dynamics of dead tree degradation and shelf-life following natural disturbances: can salvaged trees from boreal forests »fuel« the forestry and bioenergy sectors? Forestry 88(3): 275–290. https://doi.org/10.1093/forestry/cpv007
Béland, M., Thiffault, E., Barrette, J., Mabee, W., 2020: Degraded trees from spruce budworm epidemics as bioenergy feedstock: a profitability analysis of forest operations. Energies 13(4609): 1–19. https://doi.org/10.3390/en13184609
Boucher, D., Gauthier, S., Noël, J., Greene, D.F., Bergeron, Y., 2014: Salvage logging affects early post-fire tree composition in Canadian boreal forest. For. Ecol. Manage. 325: 118–127. https://doi.org/10.1016/j.foreco.2014.04.002
Boucher, J., 2010: Impacts de la coupe de récupération après feu sur les coléoptères associés aux brûlis en forêt boréale : Une dynamique temporelle. Master’s thesis, Université de Québec à Chicoutimi, Quebec, Canada.
Boulanger, Y., Gauthier, S., Gray, D.R., Le Goff, H., Lefort, P., Morissette, J., 2013: Fire regime zonation under current and future climate over eastern Canada. Ecol. Appl. 23(4): 904–923. https://doi.org/10.1890/12-0698.1
Brandt, Available online: https://www.brandt.ca/Divisions/Tractor/Products/Forestry-Attachments/Harvesting-Heads/400-Series-4-Roller/H415X (accessed 05 january 2026).
Dlokweni, P., Ramantswana, M., Spinelli, R., McEwan, A., 2022: An assessment of productivity and volume recovery of mechanised harvesting in a pine fire salvaging operation in the eastern Cape, South Africa. Proceedings of the Joint 44th Annual Meeting of Council on Forest Engineering (COFE), the 54th International Symposium on Forest Mechanization (FORMEC), and IUFRO All-Division 3 Meeting, Corvallis, Oregon, USA, October 4–7, 160 p.
Eriksson, M., Lindroos, O., 2014: Productivity of harvesters and forwarders in CTL operations in northern Sweden based on large follow-up datasets. Int. J. For. Eng. 25(3): 179–200. https://doi.org/10.1080/14942119.2014.974309
Gauthier, S., 2009: Bois brûlés : Récupérer en favorisant la regénération. Service canadien des forêts – Centre de foresterie des Laurentides: Quebec, Canada. L’éclaircie 51: 1–1.
Gauthier, S., Bernier, P., Burton, P.J., Edwards, J., Isaac, K., Isabel, N., Jayen, K., Le Goff, H., Nelson, E.A., 2014: Climate change vulnerability and adaptation in the managed Canadian boreal forest. Environ. Rev. 22(3): 256–285. https://doi.org/10.1139/er-2013-0064
Ghaffariyan, M.R., Acuna, M., Brown, M.W., 2019: Machine productivity evaluation for harvesters and forwarders in thinning operations in Australia. Silva Balcanica 20(2): 13–25. https://doi.org/10.6084/m9.figshare.9929051
Han, H., Chung, W., She, J., Anderson, N., Wells, L., 2018: Productivity and costs of two beetle-kill salvage harvesting methods in northern Colorado. Forests 9(9): 1–17. https://doi.org/10.3390/f9090572
Harvey, R.D. Jr., 1979: Rate of increase of blue stained volume in mountain pine beetle killed lodgepole pine in northeastern Oregon, U.S.A. Can. J. For. Res. 9(3): 323–326. https://doi.org/10.1139/x79-055
Hébert, C., 2006: Optimizing salvage harvesting and conserving biodiversity. Canadian Forest Service – Laurentian Forestry Centre: Quebec, Canada. Branching out 26: 1–2.
Hiesl, P., Benjamin, J.G., 2014: Harvester productivity and cost in small diameter timber stands in central Maine, USA. 37th Council on Forest Engineering Annual Meeting, Moline, Illinois, USA, June 22 – 25, 1–8.
Ibarzabal, J., Azeria, E.T., Hébert, C., Boucher, J., Imbeau, L., Savard, J.-P.L., 2011: Impact de la récupération sur la diversité des oiseaux en forêt d’épinettes noires. Actes du Colloque Les Feux de forêt, science et défis d’aménagement, Saint-Félicien, Quebec, Canada, March 23–24, 63–67.
Jeffrey, O., 2013: Effets des coupes de récupération sur les successions naturelles de coléoptères saproxyliques le long d’une chronoséquence de 15 ans après feu en forêt boréale commerciale. Master’s thesis, Université Laval, Quebec, Canada.
Kärhä, K., Anttonen, T., Poikela, A., Palander, T., Laurén, A., Peltola, H., Nuutinen, Y., 2018: Evaluation of salvage logging productivity and costs in windthrown Norway spruce-dominated forests. Forests 9(5): 1–22. https://doi.org/10.3390/f9050280
Labelle, E.R., Bergen, M., Windisch, J., 2017: The effect of quality bucking and automatic bucking on harvesting productivity and product recovery in a pine-dominated stand. Eur. J. For. Res. 136(4): 639–652. https://doi.org/10.1007/s10342-017-1061-4
Labelle, E.R., Breinig, L., Sycheva, E., 2018: Exploring the use of harvesters in large-diameter hardwood-dominated stands. Forests 9(424): 1–14. https://doi.org/10.3390/f9070424
Labelle, E.R., Brochert, H., Aurenhammer, P.K., Breinig, L., Spinelli, R., Magagnotti, N., 2024: Effect of season and machine type on performance of semi- and fully mechanized harvesting systems in beech-dominated stands. Croat. J. Fo.r Eng. 45(2): 237–249. https://doi.org/10.5552/crojfe.2024.2281
Laubrass, Available online: https://laubrass.com/solutions/umt-plus/ (accessed 05 january 2026).
Lewis, K.J., Hartley, I.D., 2006: Rate of deterioration, degrade, and fall of trees killed by mountain pine beetle. BC J. Ecosyst. Manage. 7(2): 11–19. https://doi.org/10.22230/jem.2006v7n2a538
Lindroos, O., Pettersson, J., Nordfjell, T., 2024: How stem size variations in forest stands influence harvester productivity and the use of productivity models. Int. J. For. Eng. 35(3): 389–398. https://doi.org/10.1080/14942119.2024.2387523
Mederski, P.S., Bembenek, M., Karaszewski, Z., Łacka, A., Szczepańska-Álvarez, A., Rosińska, M., 2016: Estimating and modelling harvester productivity in pine stands of different ages, densities and thinning intensities. Croat. J. For. Eng. 37(1): 27–36.
Ministry of Forests, Wildlife and Parks (MFWP), 2015: Insectes, maladies et feux dans les forêts du Québec en 2015. Annual report, Quebec, Canada, 1–58.
Ministry of Forests, Wildlife and Parks (MFWP), 2016: Insectes, maladies et feux dans les forêts du Québec en 2016. Annual report, Quebec, Canada, 1–64.
Ministry of Forests, Wildlife and Parks (MFWP), 2017: Insectes, maladies et feux dans les forêts du Québec en 2017. Annual report, Quebec, Canada, 1–64.
Ministry of Forests, Wildlife and Parks (MFWP), 2018: Insectes, maladies et feux dans les forêts du Québec en 2018. Annual report, Quebec, Canada, 1–72.
Ministry of Natural Resources and Forests (MNRF), 2019: Insectes, maladies et feux dans les forêts du Québec en 2019. Annual report, Quebec, Canada, 1–78.
Ministry of Natural Resources and Forests (MNRF), 2020: Insectes, maladies et feux dans les forêts du Québec en 2020. Annual report, Quebec, Canada, 1–84.
Ministry of Natural Resources and Forests (MNRF), 2021: Insectes, maladies et feux dans les forêts du Québec en 2021. Annual report, Quebec, Canada, 1–82.
Ministry of Natural Resources and Forests (MNRF), 2022: Insectes, maladies et feux dans les forêts du Québec en 2022. Annual report, Quebec, Canada, 1–82.
Ministry of Natural Resources and Forests (MNRF), 2023: Insectes, maladies et feux dans les forêts du Québec en 2023. Annual report, Quebec, Canada, 1–80.
Ministry of Natural Resources and Forests (MNRF), 2025: Information sur les plans d’aménagement spéciaux et l’aide financière à l’intention des organismes désignés. Quebec, Canada, 1–16.
Ministry of Natural Resources and Forests (MNRFa), 2022: Chiffres-clés du Québec forestier – Édition 2023. Quebec, Canada, 1–8.
Ministry of Natural Resources and Forests (MNRFa), 2024: Ressources et industries forestières – Portrait statistique 2023. Quebec, Canada, 1–154.
Ministry of Natural Resources and Forests (MNRFb), 2024: Insectes, maladies et feux dans les forêts du Québec en 2024. Annual report, Quebec, Canada, 1–80.
Mizaras, S., Sadauskienė, L., Mizaraitė , D., 2008: Productivity of harvesting machines and costs of mechanized wood harvesting: Lithuanian case study. Balt. For. 14(2): 155–162.
Nakagawa, M., Hamatsu, J., Saitou, T., Ishida, H., 2007: Effect of tree size on productivity and time required for work elements in selective thinning by a harvester. Int. J. For. Eng. 18(2): 24–28. https://doi.org/10.1080/14942119.2007.10702547
Nieuwenhuis, M., Fitzpatrick, P.J., 2002: An assessment of stem breakage and the reduction in timber volume and value recovery resulting from a catastrophic storm: An Irish case study. Forestry 75(5): 513–523. https://doi.org/10.1093/forestry/75.5.513
Noël, J., 2001: Régénération forestière après feu et coupe de récupération dans le secteur de Val-Paradis, Abitibi. Master’s thesis, Université de Québec à Montréal, Quebec, Canada.
Olivera, A., Visser, R., Acuna, M., Morgenroth, J., 2016: Automatic GNSS-enabled harvester data collection as a tool to evaluate factors affecting harvester productivity in a Eucalyptus spp. harvesting operation in Uruguay. Int. J. For. Eng. 27(1): 15–28. https://doi.org/10.1080/14942119.2015.1099775
Perron, J-Y., 2003: Tarif de cubage général : Volume marchand brut (3ème publication). Ministry of Natural Resources and Forests: Quebec, Canada, 1–60.
Pohjala, J., Vahtila, M., Ovaskainen, H., Kankare, V., Hyyppä, J., Kärhä, K., 2024: Effect of prior tree marking on cutting productivity and harvesting quality. Croat. J. For. Eng. 45(1): 25–42. https://doi.org/10.5552/crojfe.2024.2213
Polowy, K., Molińska-Glura, M., 2023: Data mining in the analysis of tree harvester performance based on automatically collected data. Forests 14(165): 1–19. https://doi.org/10.3390/f14010165
Prestemon, J.P., Wear, D.N., Stewart, F.J., Holmes, T.P., 2006: Wildfire, timber salvage, and the economics of expediency. For. Policy Econ. 8(3): 312–322. https://doi.org/10.1016/j.forpol.2004.07.003
Purdon, M., Noël, J., Nappi, A., Drapeau, P., Harvey, B., Brais, S., Bergeron, Y., Gauthier, S., Greene, D., 2002: L’impact des coupes de récupération après feu en forêt boréale : Leçons d’Abitibi. Chaire industrielle CRSNG-UQAT-UQAM en aménagement forestier durable: Quebec, Canada, 1–8.
Purfürst, F.T., Erler, J., 2011: The human influence on productivity in harvester operations. Int. J. For. Eng. 22(2): 15–22. https://doi.org/10.1080/14942119.2011.10702606
Regula, J., Germain, R., Bick, S., Zhang, L., 2018: Assessing the economic viability of loggers operating tree-length harvest systems in the Northeast. J. For. 116(4): 347–356. https://doi.org/10.1093/jofore/fvy006
Ritchie Specs, Available online: https://www.ritchiespecs.com/model/tigercat-h855c-harvester (accessed 05 january 2026).
Rossit, D.A., Olivera, A., Céspedes, V.V., Broz, D., 2019: A big data approach to forestry harvesting productivity. Comput. Electron. Agric. 161: 29–52. https://doi.org/10.1016/j.compag.2019.02.029
Spinelli, R., Hartsough, B.R., 2006: Harvesting SRF poplar for pulpwood: Experience in the Pacific Northwest. Biomass and Bioenergy 30(5): 439–445. https://doi.org/10.1016/j.biombioe.2005.11.021
Spinelli, R., Magagnotti, N., Labelle, E.R., 2020: The effect of new silvicultural trends on mental workload of harvester operators. Croat. J. Fo.r Eng. 41(2): 177–190. https://doi.org/10.5552/crojfe.2020.747
Thorn, S., Chao, A., Georgiev, K.B., Müller, J., Bässler, C., Campbell, J.L., Castro, J., Chen, Y.-H., Choi, C-Y., Cobb, T.P., Donato, D.C., Durska, E., Macdonald, E., Feldhaar, H., Fontaine, J.B., Fornwalt, P.J., Hernández, R.M.H., Hutto, R.L., Koivula, M., Lee, E.J., Lindenmayer D., Mikusiński G., Obrist M.K., Perlík M., Rost J., Waldron, K., Wermelinger, B., Weiß, I., Żmihorski, M., Leverkus, A.B., 2020: Estimating retention benchmarks for salvage logging to protect biodiversity. Nat. Commun. 11(4762): 1–8. https://doi.org/10.1038/s41467-020-18612-4
Tigercat, Available online: https://www.tigercat.com/product/h855e-harvester/ (accessed 05 january 2026).
Visser, R., Spinelli, R., 2012: Determining the shape of the productivity function for mechanized felling and felling-processing. J. For. Res. 17(5): 397–402. https://doi.org/10.1007/s10310-011-0313-2
Waratah, Available online: H425. Waratah. https://www.waratah.com/fr/product/h425/ (accessed 05 january 2026).
© 2026 by the authors. Submitted for possible open access publication under the
terms and conditions of the Creative Commons Attribution (CC BY) license (http://creativecommons.org/licenses/by/4.0/).
Authors’ addresses:
Jessica R. Solofonirina, MSc *
e-mail: jessica.nirina.1@ulaval.ca
Prof. Eric R. Labelle, PhD
e-mail: Eric.Labelle@sbf.ulaval.ca
Prof. Daniel Beaudoin, PhD
e-mail: Daniel.Beaudoin@sbf.ulaval.ca
Université Laval
Faculty of Forestry, Geography, and Geomatics
Department of Forest and Wood Sciences
2405 Rue de la Terrasse
G1V 0A6, Québec
CANADA
Received: February 21, 2026
Accepted: March 30, 2026
Original scientific paper